initially described over a decade earlier (9,10), is now classified as a form of systemic vasculitis with “IgA-dominant immune deposits affecting small vessels and typically involving the skin, gut, and glomeruli and associated with arthralgias or arthritis” (11), although renal involvement does not occur in all cases. Renal disease in Henoch-Schönlein purpura (Henoch-Schönlein nephritis), and how this may be related to primary IgA nephropathy, are addressed later in this chapter.
TABLE 12.1 Frequency of primary IgA nephropathy in renal biopsy series | ||||||||||||||||||||||||||||||||||||||||||||||||||||||||||||||||||||||||||||||||||||||||||||||||||||||||||||||||||||||||||||||||||||||||||||||||||||||||||||||||||||||||||||||||||||||||||||||||||||||||||||||||||||||||||||||||||||||||||||||||||||||||||||||||||||||||||||||||||||||||||||||||||||||||||||
|---|---|---|---|---|---|---|---|---|---|---|---|---|---|---|---|---|---|---|---|---|---|---|---|---|---|---|---|---|---|---|---|---|---|---|---|---|---|---|---|---|---|---|---|---|---|---|---|---|---|---|---|---|---|---|---|---|---|---|---|---|---|---|---|---|---|---|---|---|---|---|---|---|---|---|---|---|---|---|---|---|---|---|---|---|---|---|---|---|---|---|---|---|---|---|---|---|---|---|---|---|---|---|---|---|---|---|---|---|---|---|---|---|---|---|---|---|---|---|---|---|---|---|---|---|---|---|---|---|---|---|---|---|---|---|---|---|---|---|---|---|---|---|---|---|---|---|---|---|---|---|---|---|---|---|---|---|---|---|---|---|---|---|---|---|---|---|---|---|---|---|---|---|---|---|---|---|---|---|---|---|---|---|---|---|---|---|---|---|---|---|---|---|---|---|---|---|---|---|---|---|---|---|---|---|---|---|---|---|---|---|---|---|---|---|---|---|---|---|---|---|---|---|---|---|---|---|---|---|---|---|---|---|---|---|---|---|---|---|---|---|---|---|---|---|---|---|---|---|---|---|---|---|---|---|---|---|---|---|---|---|---|---|---|---|---|---|---|---|---|---|---|---|---|---|---|---|---|---|---|---|---|---|---|---|---|---|---|---|---|---|---|---|---|---|---|---|---|---|---|---|
| ||||||||||||||||||||||||||||||||||||||||||||||||||||||||||||||||||||||||||||||||||||||||||||||||||||||||||||||||||||||||||||||||||||||||||||||||||||||||||||||||||||||||||||||||||||||||||||||||||||||||||||||||||||||||||||||||||||||||||||||||||||||||||||||||||||||||||||||||||||||||||||||||||||||||||||
glomerular diseases diagnosed by renal biopsy in certain Asian countries, including Japan, Mainland China, and Singapore (15,16,17,18,19,20,21). In most European and Australian studies, IgA nephropathy accounts for 10% to 20% of renal biopsy diagnoses and 20% to 30% of primary glomerular diseases (22,23,24,25,26,27,28,29,30,31,32,33,34), although in the United States and Canada, these percentages are generally lower (37,38,39,40,42). Still, IgA nephropathy has been found to be the most common primary glomerular disease in the United States among adults aged 20 to 39, accounting for 14% of renal biopsy diagnoses in this age group (41).
TABLE 12.2 Incidence of primary IgA nephropathy | ||||||||||||||||||||||||||||||||||||||||||||||||||||||||||||
|---|---|---|---|---|---|---|---|---|---|---|---|---|---|---|---|---|---|---|---|---|---|---|---|---|---|---|---|---|---|---|---|---|---|---|---|---|---|---|---|---|---|---|---|---|---|---|---|---|---|---|---|---|---|---|---|---|---|---|---|---|
| ||||||||||||||||||||||||||||||||||||||||||||||||||||||||||||
TABLE 12.3 Frequency of IgA nephropathy in different races in the U.S. renal biopsy series | |||||||||||||||||||||||||||||||||||||||||||
|---|---|---|---|---|---|---|---|---|---|---|---|---|---|---|---|---|---|---|---|---|---|---|---|---|---|---|---|---|---|---|---|---|---|---|---|---|---|---|---|---|---|---|---|
| |||||||||||||||||||||||||||||||||||||||||||
diseases in blacks, as compared with 13% of primary glomerular diseases in Indians (see Table 12.1). Among biopsies processed at the University of Chicago from 1980 to 1994, we also found a higher frequency of IgA nephropathy in specimens from Asian Americans than from Caucasians (see Table 12.3), although the frequency in the former group was only 12%, well below that reported in studies from Japan and China (see Table 12.1), consistent with the concept that race and differences in renal biopsy practice are both major contributors to the geographic variability seen in the incidence of IgA nephropathy. A high incidence of IgA nephropathy has also been reported in Native Americans from New Mexico (38), although its incidence among the Polynesian population of New Zealand is substantially lower than among New Zealanders of European descent (24) (see Tables 12.1 and 12.3).
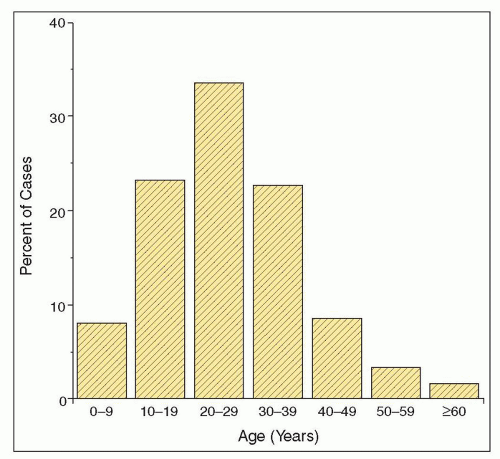
TABLE 12.4 Presenting clinical syndromes in children and adults with IgA nephropathy | ||||||||||||||||||||||||||||||||||||
|---|---|---|---|---|---|---|---|---|---|---|---|---|---|---|---|---|---|---|---|---|---|---|---|---|---|---|---|---|---|---|---|---|---|---|---|---|
| ||||||||||||||||||||||||||||||||||||
greater than 1+ on dipstick and fewer than 10% have proteinuria in the nephrotic range (≥3.5 g/1.73 m2/24 h) (15,31,58,59,60). Proteinuria of greater than 1 g/d or greater than 1+ by dipstick at the time of renal biopsy is also uncommon in most Japanese series (e.g., (17,61,62)), most likely reflecting the considerable fraction of IgA nephropathy patients identified through that country’s urinary screening program. By contrast, in most North American studies as well as in other studies focusing on patients with significant (but not severe) glomerular alterations on renal biopsy, the majority of patients have proteinuria of greater than 1 g/d (40,51,63,64,65), and in two large series from the United States, 47% and 48%, respectively, of patients with primary IgA nephropathy had proteinuria of ≥2 g/d (40,51). As is discussed below, a small number of patients will present with an overlap of IgA nephropathy and minimal change disease or perhaps more correctly minimal change disease with incidental mesangial IgA deposits. Identification of these patients is important as their proteinuria is steroid responsive and most have an excellent prognosis (66,67,68,69).
TABLE 12.5 Clinical and laboratory features at presentation or biopsy in patients with IgA nephropathy | ||||||||||||||||||||||||||||||||||||||||||||||||||||||||||||
|---|---|---|---|---|---|---|---|---|---|---|---|---|---|---|---|---|---|---|---|---|---|---|---|---|---|---|---|---|---|---|---|---|---|---|---|---|---|---|---|---|---|---|---|---|---|---|---|---|---|---|---|---|---|---|---|---|---|---|---|---|
| ||||||||||||||||||||||||||||||||||||||||||||||||||||||||||||
useful as a diagnostic marker for IgA nephropathy (49,78,79). Serum IgA levels also have no prognostic significance as a marker for disease severity or progression (80,81,82). Serum levels of IgA-fibronectin aggregates were initially reported to be elevated in 93% of patients with IgA nephropathy or Henoch-Schönlein nephritis, as compared with fewer than 20% of patients with other glomerular diseases (83). However, in a subsequent study with a greater number of patients involving a larger number of patients with IgA nephropathy or Henoch-Schönlein nephritis, only 38% of serum samples from these patients had elevated levels of IgA-fibronectin aggregates, although 48% of patients had an elevated level on at least one occasion (79). Serum levels of IgA-fibronectin aggregates clearly cannot be used as an alternative to a renal biopsy for the diagnosis of IgA nephropathy.
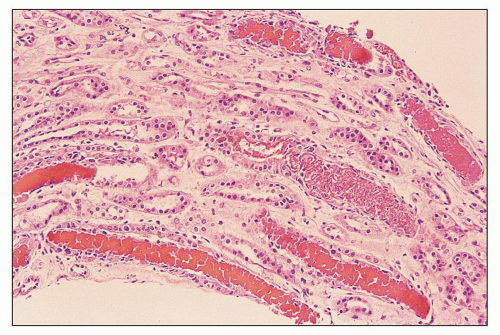 FIGURE 12.2 IgA nephropathy presenting with acute renal failure. Photomicrograph of the medulla shows collecting tubules packed with red blood cells, apparently producing urinary obstruction. (Hematoxylin-eosin [H&E] stain, magnification ×200.) |
TABLE 12.6 Statistical analysis of the predictive value, as risk factors for ESRF, of some clinical features in 23 studies selected from the literature | ||||||||||||||||||||||||||||||||||||||||||||||||||||||||||||||||||||||||||||||||||||||||||||||||||||||||||||||||||||||||||||||||||||||||||||||||||||||||||||||||||||||||||||||||||||||||||||||||||||||||||||||||||||||||||||||||||||||||||||||||||||||||||||||||||||||||||||||||||||||||||||||||||||||||||||||||||||||||||||||||||||||||||||||||||||||||||||||||||||||||||||||
|---|---|---|---|---|---|---|---|---|---|---|---|---|---|---|---|---|---|---|---|---|---|---|---|---|---|---|---|---|---|---|---|---|---|---|---|---|---|---|---|---|---|---|---|---|---|---|---|---|---|---|---|---|---|---|---|---|---|---|---|---|---|---|---|---|---|---|---|---|---|---|---|---|---|---|---|---|---|---|---|---|---|---|---|---|---|---|---|---|---|---|---|---|---|---|---|---|---|---|---|---|---|---|---|---|---|---|---|---|---|---|---|---|---|---|---|---|---|---|---|---|---|---|---|---|---|---|---|---|---|---|---|---|---|---|---|---|---|---|---|---|---|---|---|---|---|---|---|---|---|---|---|---|---|---|---|---|---|---|---|---|---|---|---|---|---|---|---|---|---|---|---|---|---|---|---|---|---|---|---|---|---|---|---|---|---|---|---|---|---|---|---|---|---|---|---|---|---|---|---|---|---|---|---|---|---|---|---|---|---|---|---|---|---|---|---|---|---|---|---|---|---|---|---|---|---|---|---|---|---|---|---|---|---|---|---|---|---|---|---|---|---|---|---|---|---|---|---|---|---|---|---|---|---|---|---|---|---|---|---|---|---|---|---|---|---|---|---|---|---|---|---|---|---|---|---|---|---|---|---|---|---|---|---|---|---|---|---|---|---|---|---|---|---|---|---|---|---|---|---|---|---|---|---|---|---|---|---|---|---|---|---|---|---|---|---|---|---|---|---|---|---|---|---|---|---|---|---|---|---|---|---|---|---|---|---|---|---|---|---|---|---|---|---|---|---|---|---|---|---|---|---|---|---|---|---|---|---|---|---|---|---|---|---|---|---|---|
| ||||||||||||||||||||||||||||||||||||||||||||||||||||||||||||||||||||||||||||||||||||||||||||||||||||||||||||||||||||||||||||||||||||||||||||||||||||||||||||||||||||||||||||||||||||||||||||||||||||||||||||||||||||||||||||||||||||||||||||||||||||||||||||||||||||||||||||||||||||||||||||||||||||||||||||||||||||||||||||||||||||||||||||||||||||||||||||||||||||||||||||||
the approach of this group from that used in the development of prior histologic classifications of IgA nephropathy (123,124):
The pathologists scored different histologic parameters from biopsies of 265 closely monitored patients with active (i.e., with proteinuria, without advanced chronic renal insufficiency) IgA nephropathy. The parameters for this scoring were agreed upon and criteria for different lesions (e.g., mesangial hypercellularity) defined at a meeting of the participating pathologists, and subsequently each biopsy was scored by a minimum of three pathologists and by four or five in 83% of cases.
The parameters scored by the pathologists included a comprehensive list of glomerular, tubulointerstitial, and vascular findings with no preconceived determination as to the relative importance of any of these. The inclusion of individual histologic parameters in the final classification was determined by three factors: reproducibility among the pathologists, independence from other parameters, and value as a predictor of clinical outcome.
The 265 cases included biopsies from 206 adults and 59 children and were from 17 different centers based in eight countries and four continents. Thus, the aim was to develop a classification that would be applicable worldwide. The participating nephrologists determined a minimum set of clinical data that had to be available for all patients included in the study. This included follow-up for a minimum of 3 years (and/or until an end point of ESRD or ≥50% decline in estimated GFR [eGFR]) with a sufficient number of determinations of eGFR during this interval to allow for determination of the slope of eGFR versus time, as a measure of the rate of renal functional decline.
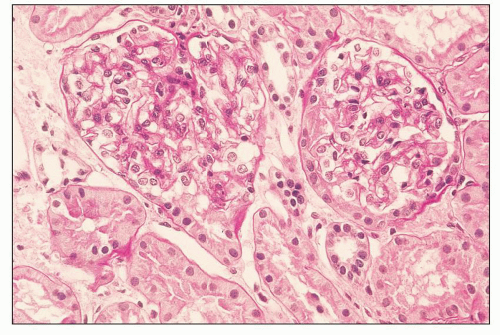 FIGURE 12.3 IgA nephropathy with minimal histologic lesion (Oxford Classification score M0 E0 S0 T0). The glomeruli are normocellular and histologically unremarkable. There is minimal TA, IF, or interstitial inflammation. (Periodic acid-Schiff [PAS] stain, ×400.) |
M0 or M1, indicating mesangial hypercellularity (≥4 cells in one or more mesangial areas) in ≤50% versus >50% of glomeruli
E0 or E1, indicating endocapillary hypercellularity in zero versus one or more glomeruli
S0 or S1, indicating segmental sclerosis in zero versus one or more glomeruli
T0, T1, or T2, indicating TA/IF in ≤25%, 26% to 50%, or >50% of renal cortex, respectively
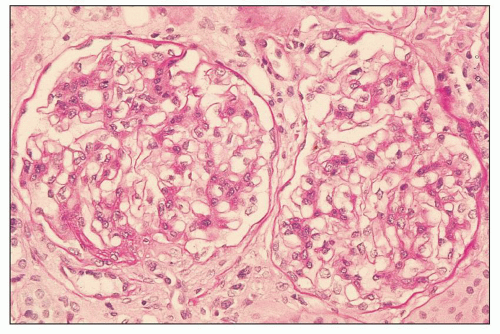 FIGURE 12.4 IgA nephropathy with mesangial proliferation (M1 E0 S0 T0). The glomeruli show a mild increase in mesangial matrix, and the glomerulus at left, which was representative of the majority of the glomeruli on this biopsy, shows a segmental increase in mesangial cellularity. (PAS, ×400.) |
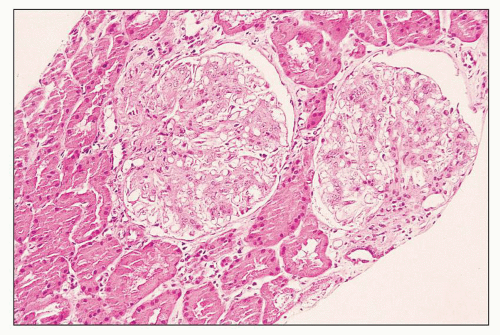 FIGURE 12.5 IgA nephropathy with diffuse mesangial proliferative glomerulonephritis (M1 E0 S0 T0). There is a diffuse increase in mesangial matrix and cellularity, without endocapillary proliferation, segmental glomerulosclerosis, crescent formation, or TA/IF. (PAS, ×200.) |
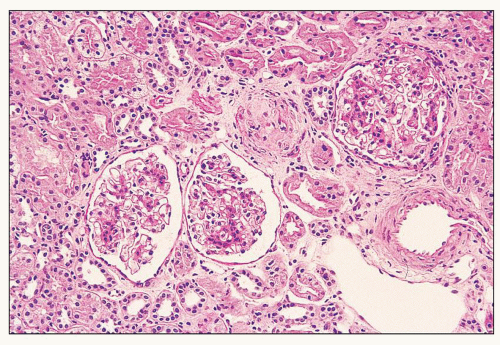 FIGURE 12.6 IgA nephropathy with diffuse mesangial proliferative glomerulonephritis (M1 E0 S0 T0). There is a diffuse increase in mesangial matrix and cellularity, without endocapillary proliferation or segmental glomerulosclerosis. There is mild chronic change, more than in Figure 12.5, but the degree of TA/IF is less than 25%. (PAS, ×200.) |
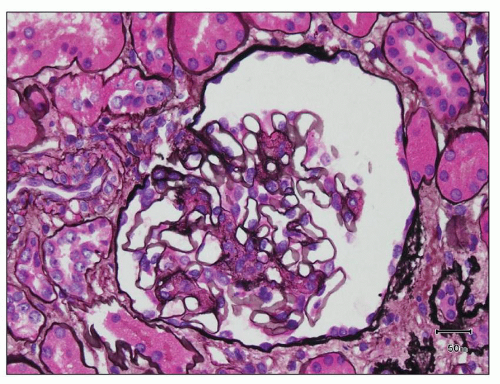 FIGURE 12.7 IgA nephropathy with mesangial proliferation (M1 E0 S0 T0). Note that expanded mesangial areas do not stain black with the methenamine silver stain, this staining is typical of immune complex deposits rather than mesangial matrix. EM (see Fig. 12.22) confirmed the presence of extensive mesangial deposits. (Jones methenamine silver stain, ×400.) |
purpura (125,126). As noted in Table 12.7, which summarizes results of 13 studies comprising over 2200 patients, over 40% of cases of IgA nephropathy contain mesangial deposits of IgG and over 50% contain mesangial deposits of IgM, although in each case, the overall intensity of staining for IgA was at least as great as that for either of the other immunoglobulins. IgA deposited in the glomeruli of patients with IgA nephropathy is predominantly of the IgA1 subclass. In different studies, IgA2 has been reported to be present (in lesser amount than IgA1) in between 0% and 53% of biopsies, although in the majority of studies, the presence of glomerular IgA2 is uncommon (128,133,134,135,136,137,138,139,140). Most studies indicate that the IgA present in the glomerular deposits is polymeric, based on the absence of secretory component and the presence of J chain within the deposits (134,135,138,141), as will be discussed in more detail below in the section dealing with the pathogenesis of IgA nephropathy.
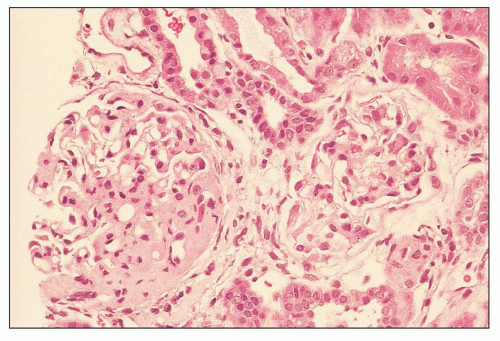 FIGURE 12.8 IgA nephropathy resembling focal segmental glomerulosclerosis (M0 E0 S1 T0). The glomerulus at left shows perihilar segmental sclerosis with associated hyalinosis as well as an increase in mesangial matrix; however, neither glomerulus shows mesangial or endocapillary hypercellularity. A small number of red blood cells are seen within a tubular lumen above the segmentally sclerotic glomerulus. (H&E, ×400.) |
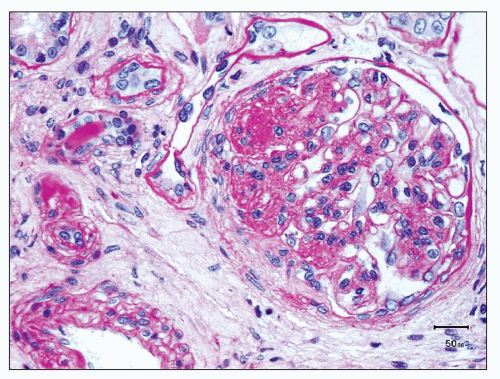 FIGURE 12.9 IgA nephropathy with mesangial hypercellularity and segmental glomerulosclerosis (M1 E0 S1 T0). The glomerulus shows an increase in mesangial cellularity and matrix, as well as segmental sclerosis with capsular adhesion. While a small number of double contours of the glomerular basement membrane are present, there is no definite endocapillary proliferation. (PAS, ×400.) |
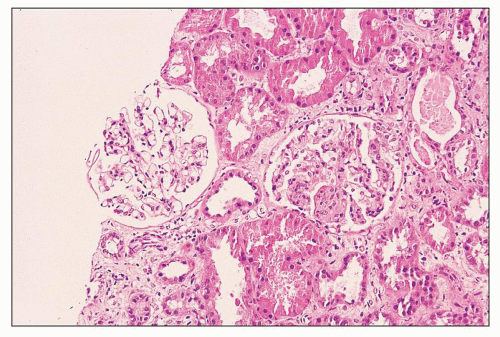 FIGURE 12.10 IgA nephropathy with focal endocapillary proliferation (M0 E1 S0 T0). The glomerulus at left is unremarkable; however, that at right shows segmental endocapillary hypercellularity, as well as a small cellular crescent between 1 and 2 o’clock. TA/IF is present, but overall, this was less than the 25% cutoff for T1 according to the Oxford Classification. (H&E, ×200.) |
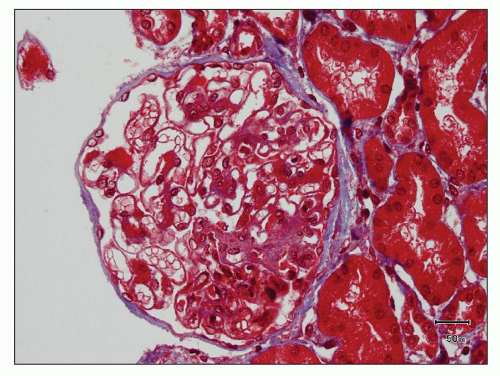 FIGURE 12.11 IgA nephropathy with endocapillary proliferation (M0 E1 S0 T0). There is segmental endocapillary proliferation (4 to 6 o’clock) but no mesangial hypercellularity. There are, however, mesangial immune complex deposits that stain red on this trichrome stain. (Masson trichrome stain, ×400.) |
of the classical complement pathway, namely, C1q and C4 (53,129,131,132,142), are absent in most cases of IgA nephropathy, although C4 has been reported in up to 30% of cases, more often those with deposits containing multiple immunoglobulins rather than IgA alone (143). However, in many if not most cases, this C4 deposition probably indicates activity of the lectin pathway of complement activation rather than that of the classical pathway (144). In the lectin pathway, C4 becomes activated independently of C1 following the binding of mannose-binding lectin to carbohydrate ligands (145). Properdin, a component of the alternative pathway, has been reported to be present in nearly all cases in some studies (132,143), although in less than 50% in others (129). Terminal components of complement C5, C6, and C9 as well as neoantigens of the C5b-9 membrane attack complex (MAC) have also been detected by immunofluorescence in glomeruli of patients with IgA nephropathy, and dual immunostaining studies have shown colocalization of MAC neoantigens and IgA (but interestingly not IgG or IgM) at identical sites in the mesangium and peripheral capillary walls (131).
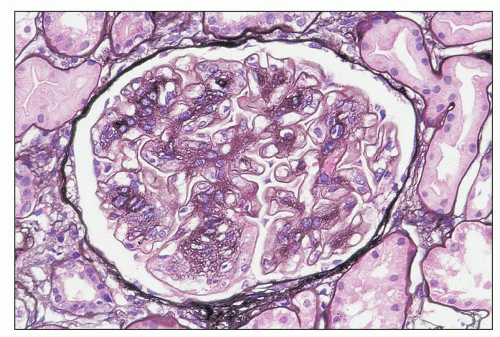 FIGURE 12.12 Mesangial and endocapillary proliferative IgA nephropathy (M1 E1 S0 T0) resembling membranoproliferative glomerulonephritis. There is an increase in silver-positive mesangial matrix, hyperlobulation, and mesangial and endocapillary hypercellularity. Several double contours of the glomerular basement membrane are apparent. (Jones methenamine silver, ×400.) |
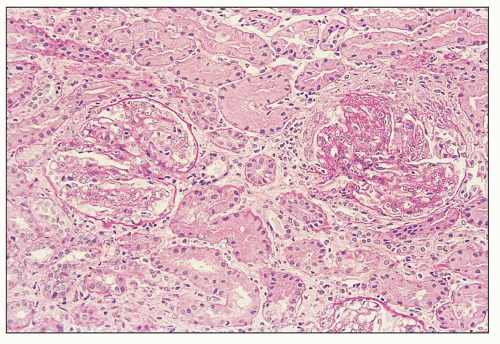 FIGURE 12.13 IgA nephropathy with diffuse mesangial and endocapillary hypercellularity; the glomerulus at right shows a segmental fibrocellular crescent with segmental sclerosis of the tuft adjacent to the crescent (M1 E1 S1 T0). There is less than 25% TA/IF. (PAS, ×200.) |
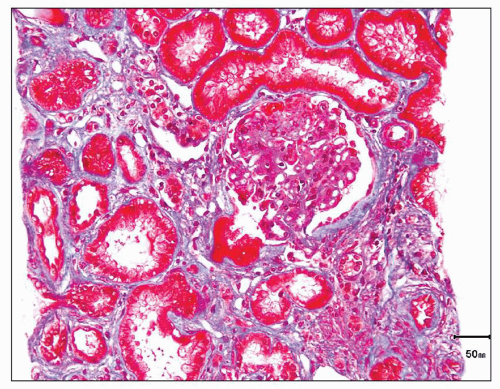 FIGURE 12.14 IgA nephropathy with mesangial hypercellularity, segmental glomerulosclerosis, and TA/IF (M1 E0 S1 T1). The glomerulus present shows segmental mesangial hypercellularity and segmental sclerosis. There is moderate TA/IF, overall estimated to involve greater than 25% of the renal cortical tissue present. (Masson trichrome stain, ×400.) |
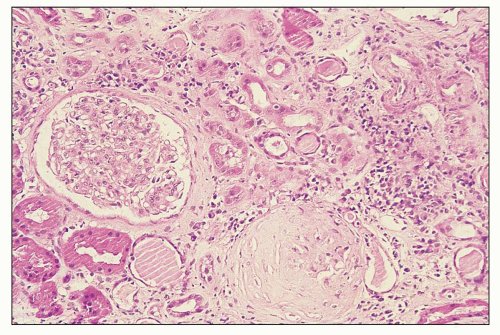 FIGURE 12.15 Advanced chronic IgA nephropathy with residual mesangial hypercellularity (M1 E0 S0 T2). There is TA/IF, with a nonspecific mononuclear cell inflammatory infiltrate in the sclerotic interstitium. Arterioles present (upper right) show hypertensive changes. One of the two glomeruli shown is globally sclerotic, while the other shows mild and segmental mesangial hypercellularity. (H&E, ×200.) |
45 biopsies (2%) showed kappa predominance; the remaining 15 (33%) cases showed equivalent staining for kappa and lambda. Seventeen (38%) of the biopsies showed staining for lambda in the absence of kappa (148). Smith (130) has noted similar findings in Native Americans and, to a lesser degree, Caucasians, from the Southwestern United States. Others, however, have found exclusively lambda staining less frequently, if at all. In 813 cases of primary IgA nephropathy, we have examined at three separate institutions, 11% showed glomerular staining for lambda alone, 1% for kappa alone, 86% for both kappa and lambda, and 2% for neither kappa nor lambda. Jennette (125) found glomerular staining for lambda alone in only 3% of cases, although the intensity of lambda staining exceeded that for kappa in an additional 64%. Suzuki et al. (139) found staining for both kappa and lambda in each of 191 cases examined, although they too commented that the intensity of staining for lambda was usually equal to or stronger than that for kappa.
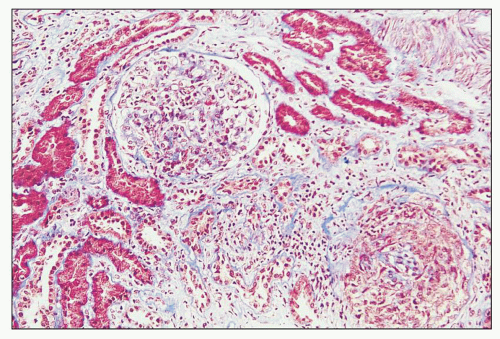 FIGURE 12.16 Severe chronic and active IgA nephropathy (M1 E1 S0 T2). As shown by the Masson trichrome stain, there are severe TA and IF, overall involving more than 50% of the cortical tissue present. There is also a persistent active glomerulonephritis with mesangial and endocapillary hypercellularity, and one glomerulus with a circumferential, largely cellular crescent (lower right). (Masson trichrome stain, ×200.) |
TABLE 12.7 Glomerular immunofluorescence/immunohistochemical findings in primary IgA nephropathy | ||||||||||||||||||||||||||||||||||||||||||||||||||||||||||||||||||||||||||||||||||||||||||||||||||||||||||||||||||||||||||||||||||
|---|---|---|---|---|---|---|---|---|---|---|---|---|---|---|---|---|---|---|---|---|---|---|---|---|---|---|---|---|---|---|---|---|---|---|---|---|---|---|---|---|---|---|---|---|---|---|---|---|---|---|---|---|---|---|---|---|---|---|---|---|---|---|---|---|---|---|---|---|---|---|---|---|---|---|---|---|---|---|---|---|---|---|---|---|---|---|---|---|---|---|---|---|---|---|---|---|---|---|---|---|---|---|---|---|---|---|---|---|---|---|---|---|---|---|---|---|---|---|---|---|---|---|---|---|---|---|---|---|---|---|
| ||||||||||||||||||||||||||||||||||||||||||||||||||||||||||||||||||||||||||||||||||||||||||||||||||||||||||||||||||||||||||||||||||
resorption droplets within tubular epithelial cells typically stain for IgA and serve as convenient internal controls for IgA immunofluorescence. IgA staining within arterioles and/or small interlobular arteries has been reported in approximately 5% of renal biopsies showing IgA nephropathy (128,151); however, the deposits typically stop abruptly at the glomerular hilum. Although the vascular deposits of IgA are granular and usually accompanied by deposits of C3, their presence does not correlate with specific histopathologic changes in the vessels or with a greater incidence of hypertension or renal insufficiency (151).
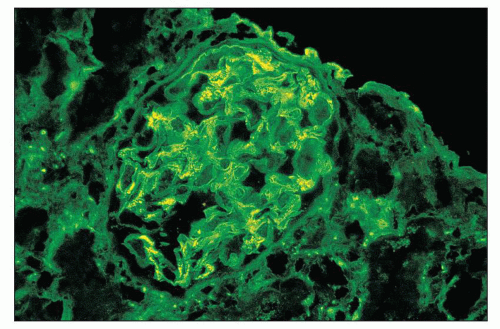 FIGURE 12.17 Glomerular fibrinogen deposition in IgA nephropathy. Immunofluorescence shows fairly global, predominantly granular mesangial staining for fibrinogen, with weaker pseudolinear staining in glomerular capillary walls. (Fluorescein isothiocyanate-conjugated [FITC] anti-human fibrinogen, ×400.) |
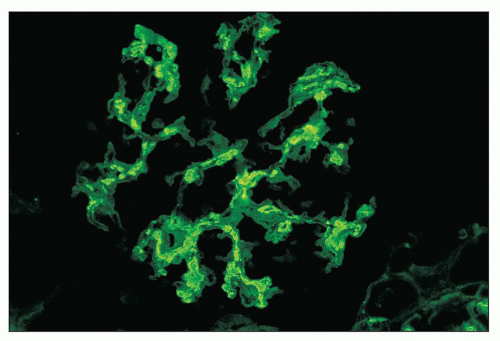 FIGURE 12.18 IgA nephropathy. Immunofluorescence shows global, granular to globular staining for IgA limited to the mesangium. (FITC antihuman IgA, ×400.) |
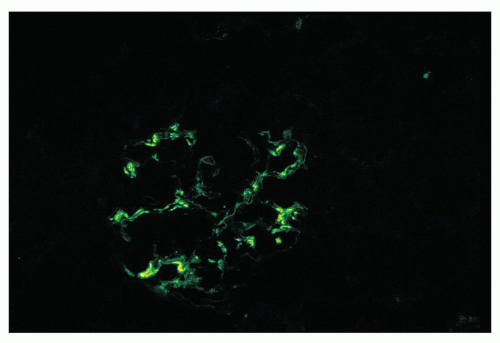 FIGURE 12.19 IgA nephropathy. Mesangial staining for IgA is much less intense than that in Figure 12.18 and not completely global. This biopsy was from a young adult male with a history of gross hematuria during an upper respiratory infection, persistent microscopic hematuria, very mild proteinuria, and normal renal function. Glomeruli were histologically unremarkable. Immunofluorescence showed only the modest mesangial staining for IgA and C3. Small mesangial electron-dense deposits were seen by EM, with no other deposits and no abnormalities of the glomerular basement membranes. He was diagnosed with mild IgA nephropathy (Oxford Classification M0 E0 S0 T0). (FITC anti-human IgA, ×400.) |
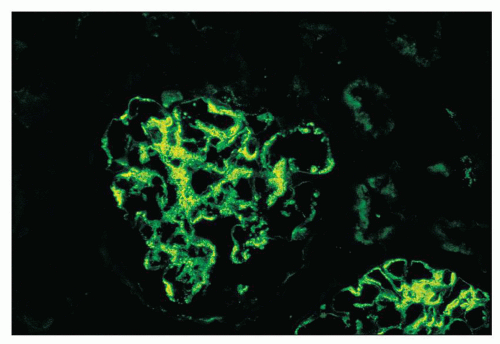 FIGURE 12.20 IgA nephropathy. There is granular staining for IgA in the mesangium and in some peripheral glomerular capillary walls. (FITC anti-human IgA, ×400.) |
lupus nephritis (see Differential Diagnosis, below). Still, there are a number of fairly characteristic ultrastructural features of IgA nephropathy, and some studies suggest that certain EM features may have prognostic significance.
TABLE 12.8 Ultrastructural location of glomerular immune complex deposits in primary IgA nephropathy and IgA vasculitis (Henoch-Schönlein purpura) nephritis | |||||||||||||||||||||||||||||||||
|---|---|---|---|---|---|---|---|---|---|---|---|---|---|---|---|---|---|---|---|---|---|---|---|---|---|---|---|---|---|---|---|---|---|
| |||||||||||||||||||||||||||||||||
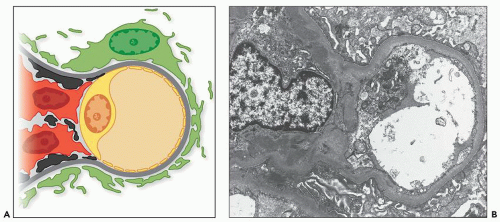 FIGURE 12.21 IgA nephropathy. A: Drawing of a glomerular capillary and adjacent mesangium showing mesangial immune deposits (black), especially immediately beneath the paramesangial basement membrane. B: Electron micrograph showing paramesangial electron-dense deposits within a mildly expanded mesangium. A small subendothelial deposit is also present (lower right portion of the capillary loop). Glomerular basement membranes are unremarkable, and the majority of podocyte foot processes appear intact. (Uranyl acetate and lead citrate stain, original magnification ×6300.) |
more segmental than in type I membranoproliferative glomerulonephritis (MPGN). Infrequently, there are large subendothelial deposits resembling those seen in lupus nephritis (Fig. 12.27). The presence of large, hump-like subepithelial deposits suggests the possibility of an IgA-dominant postinfectious glomerulonephritis rather than IgA nephropathy, as discussed below (see Differential Diagnosis).
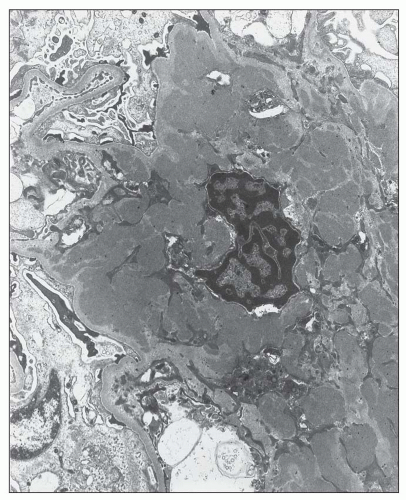 FIGURE 12.22 IgA nephropathy. A large amount of mesangial electron-dense deposit is present within the expanded mesangium. No subendothelial or subepithelial deposits are present, however. Light microscopy of this biopsy is shown in Figure 12.7. (Uranyl acetate and lead citrate, original magnification ×3800.) |
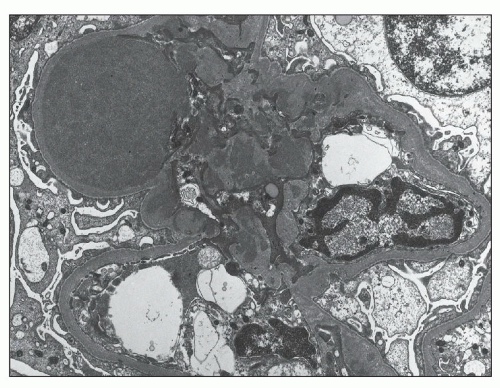 FIGURE 12.23 IgA nephropathy. There are prominent mesangial electron-dense deposits, including a large deposit (upper left) with associated bulging of the mesangium into the urinary space. Podocyte foot processes show a significant degree of effacement. (Uranyl acetate and lead citrate, original magnification ×5000.) |
human immunodeficiency virus (HIV)-associated lupus-like glomerulonephritis (175,176) may also exhibit strong glomerular IgA staining, but like lupus nephritis also show prominent C1q staining.
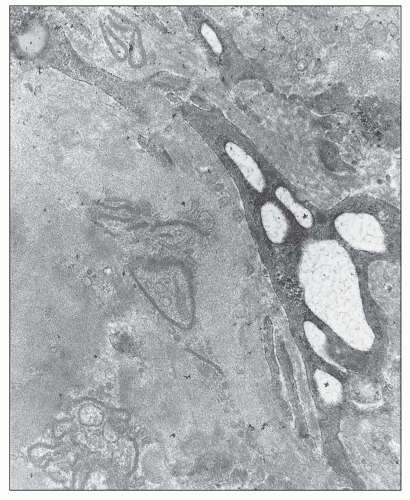 FIGURE 12.24 Chronic IgA nephropathy. This electron micrograph shows several largely resorbed mesangial deposits. The deposits contain electron-lucent areas, as well as microvesicular and membrane-like structures. (Uranyl acetate and lead citrate, original magnification ×17,000.) |
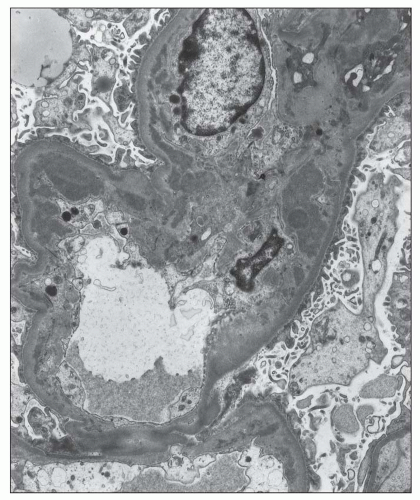 FIGURE 12.25 IgA nephropathy. There are mesangial electron-dense deposits that extend into the adjacent glomerular capillary as subendothelial deposits. (Uranyl acetate and lead citrate, original magnification ×3800.) |
with variable thickening of glomerular capillary loops histologically, often with basement membrane “spikes” evident on silver stains, granular immunostaining for IgG along glomerular capillary loops, and numerous subepithelial deposits by EM. In addition, there is an increase in mesangial matrix and an increase in mesangial cellularity, often mild and segmental, as well as mesangial deposits by EM corresponding to the mesangial immunostaining for IgA (187,188,189).
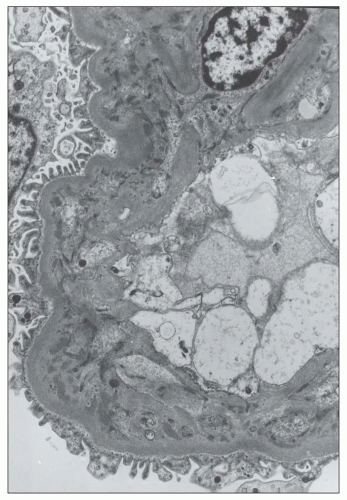 FIGURE 12.26 IgA nephropathy. Subendothelial electron-dense deposits associated with duplication of the glomerular basement membrane. (Uranyl acetate and lead citrate, original magnification ×5000.) |
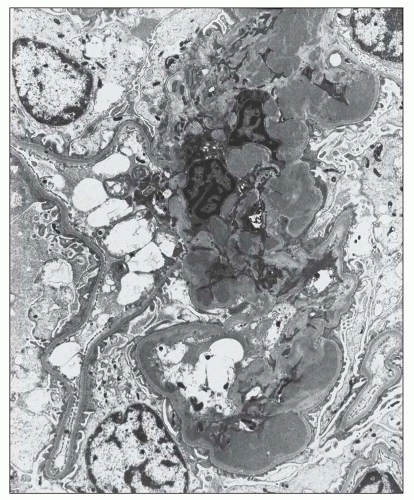 FIGURE 12.27 IgA nephropathy. There is a large amount of mesangial electron-dense deposit and a segmental, large subendothelial deposit resembling a “wire loop” of lupus nephritis. (Uranyl acetate and lead citrate, original magnification ×3000.) |
What are the properties of the IgA that is deposited in the glomeruli (and more specifically, the mesangium), and are there properties of this IgA that are unique to patients with IgA nephropathy?
What is/are the source(s) of the mesangial IgA?
What are the mechanisms involved in mesangial IgA deposition, and do specific properties of the IgA and/or the mesangium in patients with IgA nephropathy promote this deposition?
What are the events involved in the glomerular response to IgA deposition that lead to glomerulonephritis, and what role(s) do specific properties of the IgA and/or mesangium in patients with IgA nephropathy play in promoting these events?
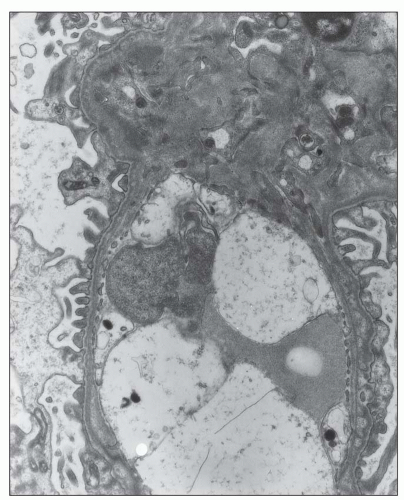 FIGURE 12.28 Glomerular basement membrane structural abnormalities in IgA nephropathy. This glomerular capillary shows both thinning (left) and splitting (right) of the GBM. Foot processes are effaced overlying the area of GBM splitting. Paramesangial electron-dense deposits are present. (Uranyl acetate and lead citrate, original magnification ×8000.) |
TABLE 12.9 Major differential diagnosis of dominant/codominant mesangial IgA deposits | ||||||||||||||||||||||||||||
|---|---|---|---|---|---|---|---|---|---|---|---|---|---|---|---|---|---|---|---|---|---|---|---|---|---|---|---|---|
| ||||||||||||||||||||||||||||
concentrations of serum IgA do not necessarily lead to mesangial IgA deposition, as evidenced by the lack of such deposits in most patients with IgA multiple myeloma (204,205). Indeed, the IgA in the serum of patients with IgA nephropathy shows a number of atypical features. First, the increase in serum IgA, when present, is accounted for by an increase in pIgA1, with levels of mIgA1 and of IgA2 being within the normal range (200,206). Second, there is an elevated ratio of lambda to kappa light chains in this pIgA1, particularly in patients with active disease (207,208). Third, there is altered O-glycosylation (galactosylation and sialylation) in the hinge region of this IgA1, as demonstrated both by altered lectin binding and mass spectroscopy, with no abnormalities of the N-linked sugars noted (209,210).
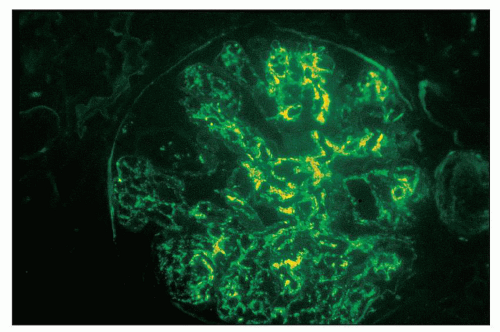 FIGURE 12.29 IgA-dominant postinfectious glomerulonephritis. Immunofluorescence for IgA shows staining in the mesangium and peripheral glomerular capillary walls, with a “starry sky” pattern and segmental distinct deposits corresponding to subepithelial “humps.” (FITC anti-human IgA, ×400.) |
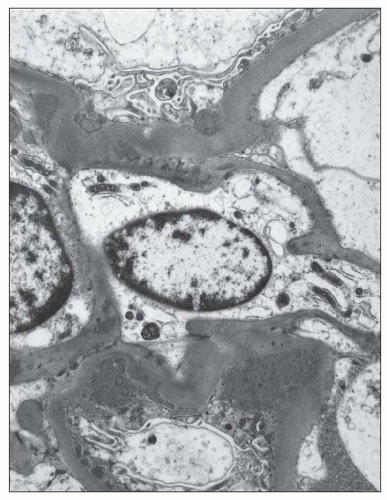 FIGURE 12.30 IgA-dominant postinfectious glomerulonephritis (resolving phase). Electron micrograph shows subepithelial deposits in the “notch” region underlying the mesangium (lower portion of figure) and occasional mesangial deposits. (Uranyl acetate and lead citrate, original magnification ×5000.) |
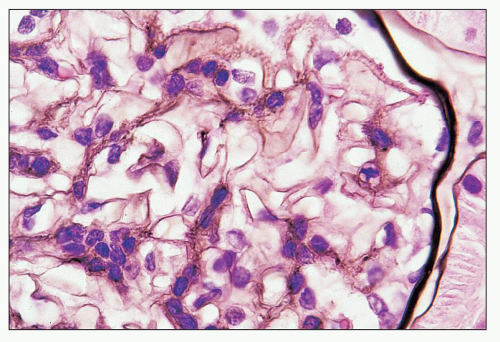 FIGURE 12.31 Superimposed membranous and IgA nephropathies. Methenamine silver stain shows glomerular basement membrane “spikes” typical of membranous nephropathy (best seen between 12 and 2 o’clock), with segmental mesangial hypercellularity (lower left). (Jones methenamine silver stain, ×1000.) |
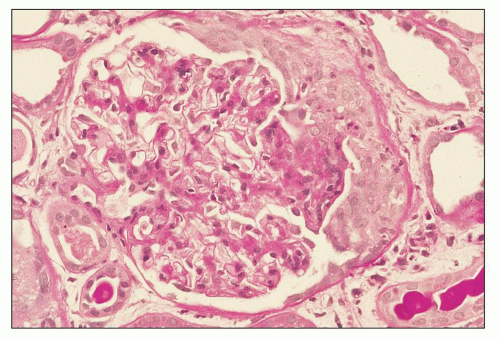 FIGURE 12.32 ANCA-associated crescentic glomerulonephritis with mesangial IgA. Portions of the glomerular tuft not directly adjacent to the hilum or to the crescent are not hypercellular. (PAS, ×400.) |
presence of J chain (134,135,138,141) (see Immunohistologic Findings). The intensity of immunostaining for lambda light chains also exceeds that for kappa in the majority of cases of IgA nephropathy (130,139,148,211). Furthermore, when the O-glycosylation of IgA1 eluted from kidneys (nephrectomy or autopsy specimens, or combined from a large number of biopsy specimens) with IgA nephropathy was studied using lectin binding and mass spectrometry, there was decreased galactosylation and sialylation in the hinge region that was even more pronounced than that seen in serum IgA1 from IgA nephropathy patients (212,213). These findings suggest that the most abnormally O-glycosylated pIgA1 molecules are those most likely to be deposited in the glomeruli, and indeed, fractions of IgA1 from IgA nephropathy patients enriched in molecules with underglycosylated hinge regions correspond to those fractions showing the greatest degree of glomerular accumulation in the perfused rat kidneys (214).
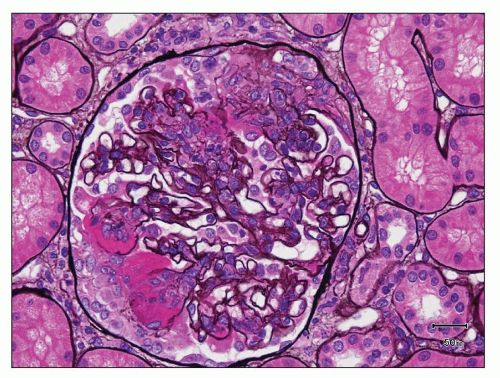 FIGURE 12.33 IgA nephropathy with fibrinoid necrosis and crescent formation. The methenamine silver stain shows fibroid necrosis with associated disruption of the glomerular basement membrane and associated early crescent formation, most evident in lower left quadrant of this glomerulus. In contrast to the case with ANCA-associated crescentic glomerulonephritis (see Fig. 12.32), the glomerular tuft shows segmental mesangial and endocapillary hypercellularity. (Jones methenamine silver, ×400.) |
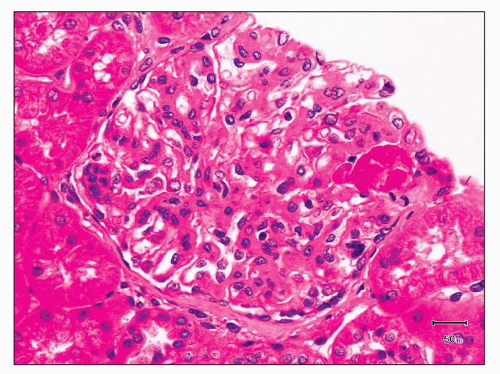 FIGURE 12.34 IgA nephropathy with segmental fibrinoid necrosis. In addition to the segmental necrotizing lesion, this glomerulus also shows mesangial hypercellularity and matrix expansion. (H&E, ×400.) |
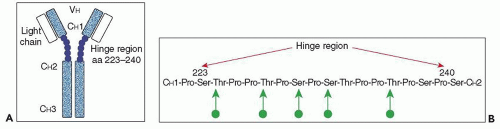 FIGURE 12.35 O-glycosylation of the hinge region of IgA1. A: Structure of monomeric IgA1. There are two α1 heavy chains and two κ or λ light chains. The heavy chains contain three constant region domains (CH1, CH2, and CH3) and a variable (VH) region; the 18-amino-acid hinge region is located between the CH1 and CH2 domains. B: Amino acid sequence of the hinge region, indicating those serine and threonine residues that have been shown to be O-glycosylated. (Modified from Barratt J, Feehally J, Smith AC. Pathogenesis of IgA nephropathy. Semin Nephrol 2004;24:197-217.) |
bone marrow, most likely underlie the presence of circulating, abnormally glycosylated pIgA1 that ultimately becomes deposited in the glomeruli (200,206,223,224,225,226,227). A major portion of this evidence can be summarized as follows:
Patients with IgA nephropathy have increased numbers of plasma cells containing pIgA and IgA1 in the bone marrow, and bone marrow cultures from these patients produce increased amounts of pIgA1 (as well as mIgA1) compared with age- and sex-matched controls (225,226,227).
By contrast, numbers of mucosal-associated plasma cells producing pIgA are not elevated, and in some instances have been found to be decreased, in patients with IgA nephropathy (228,229), and levels of IgA and of IgA1 are not increased in the saliva of patients with IgA nephropathy who have elevated serum IgA and IgA1 levels (206).
Patients with IgA nephropathy, unlike healthy controls, respond to intranasal antigen challenge with influenza virus with increased levels of IgA antibodies in the circulation (230), providing an explanation (in the form of abnormal handling of mucosal antigens and breakdown of oral tolerance) other than spillage of mucosal IgA into the circulation for the presence of IgA antibodies against food and other mucosal environmental antigens in the serum of patients with IgA nephropathy (220,221,222).
Related posts:
 Development of the Kidney
 Membranous Glomerulonephritis
 Renal Involvement in Polyarteritis Nodosa, Kawasaki Disease, Takayasu Arteritis, and Giant Cell Arteritis
 Pauci-Immune and Antineutrophil Cytoplasmic Autoantibody-Mediated Crescentic Glomerulonephritis and Vasculitis
 Renal Disease Caused by Hypertension
 Pyelonephritis and Other Direct Renal Infections, Reflux Nephropathy, Hydronephrosis, Hypercalcemia, and Nephrolithiasis
Stay updated, free articles. Join our Telegram channel

Full access? Get Clinical Tree


