Diabetic Nephropathy
Jean L. Olson
Zoltan G. Laszik
DIABETIC NEPHROPATHY
Diabetes mellitus (DM) is recognized in two forms, classified as type 1 and type 2 DM (1). Type 1 DM includes those cases that are primarily due to pancreatic β-cell destruction. The form named type 2 DM includes the most prevalent form of the disease, which results from insulin resistance with an insulin secretory defect. Type 1 DM accounts for 5% to 10% of people with DM, and type 2 DM affects approximately 90% of those with the disease (2). The prevalence of DM world-wide was estimated to be 2.8% in 2000 and is projected to increase to 4.4% by 2030 (3). The natural history, pathologic features, and pathogenesis of diabetic nephropathy are remarkably similar but not identical in patients with type 1 and type 2 DM. Therefore, throughout the chapter, we comment on these variations, when appropriate.
Diabetic nephropathy is a clinical syndrome characterized by persistent albuminuria (greater than 300 mg/24 hours) (also referred to as macroalbuminuria or proteinuria), a steady decline in glomerular filtration rate (GFR), and elevated blood pressure (4). Two thirds of patients with diabetic nephropathy develop renal failure requiring either dialysis or renal transplantation. Diabetic nephropathy is the most common cause of chronic renal failure in the United States and accounts for 43.9% of patients enrolled in long-term dialysis programs (5). Patients with nephropathy frequently develop other complications, in particular cardiovascular disease, including hypertension and stroke, resulting in increased risk of early mortality (6,7). In patients with type 1 DM, 40 years after onset of the disease, the mortality rate is 90% for those patients with nephropathy but only 30% for those patients without renal disease (7). End-stage renal disease (ESRD) in type 1 diabetics results in a 13-fold increase in the risk of death (8). Thus, renal complications of DM are important, and glomerulosclerosis and vascular disease are the most important causes of renal failure in the diabetic patient.
Frequency and Risk Factors
Incidence and Prevalence
Several studies from the 1980s showed a cumulative incidence of diabetic nephropathy of 25% to 40% after 25 years of type 1 DM with a declining trend in cumulative incidence compared to those patients diagnosed in the 1930s and in the 1950s (9,10,11). A study from Sweden published in 1994 reported a dramatic decline in the cumulative incidence of diabetic nephropathy in patients diagnosed before age 15 years (12). The investigators showed that the cumulative incidence of diabetic nephropathy after 25 years declined from 28% in those patients with an onset of type 1 DM between 1961 and 1965 compared with 8.9% in those patients with an onset between 1966 and 1970 and 5.8% in a cohort from 1971 to 1975. Most follow-up studies have confirmed the declining trend of incidence of diabetic nephropathy in patients with type 1 DM thought to be secondary to better control of hyperglycemia (13,14,15).
Older data showed a cumulative incidence of ESRD of 2% to 8% in patients with type 1 DM 20 years after the onset of DM and 15% to 17% after 30 years (16). A more recent study from Finland shows a decline in cumulative incidence of ESRD to 7.8% after 30 years (8). The peak annual incidence of developing proteinuria in type 1 DM is approximately 3% between 10 and 20 years of DM duration (9,17).
The prevalence of proteinuria in patients with type 1 DM is between 15% and 40% (9,13).
The prevalence of proteinuria in patients with type 1 DM is between 15% and 40% (9,13).
The prevalence and cumulative incidence of proteinuria (as a measure of diabetic nephropathy) in patients with type 2 DM are comparable but not identical with those of type 1 DM (18,19,20). Adler et al. (18) found that progression to microalbuminuria occurred at a rate of 2% per year from the diagnosis of type 2 DM with progression to macroalbuminuria from microalbuminuria occurring at a rate of 2.8% per year. The prevalence of microalbuminuria at 10 years was 24.9% and for macroalbuminuria was 5.3% in these patients in the United Kingdom. A more recent study in the United Kingdom has demonstrated a prevalence of chronic kidney disease (CKD) stages 3 to 5 ranging between 18% and 27.5% at 10 years after diagnosis (15). In contrast, the prevalence of macroalbuminuria in a study from India was 44% with a median follow-up of 11 years (20).
Duration of Disease
The incidence of diabetic glomerulosclerosis increases with the duration of DM. This correlation was shown most clearly by Andersen et al. (9) in a large cohort study from Steno Memorial Hospital. These authors studied 1475 patients with type 1 DM for ≥25 years or until death and found an increase in the annual incidence of renal disease through the first 16 years after diagnosis of DM with a decline in the number of patients developing renal lesions after that period. Only 4% of patients developed nephropathy after 35 years of DM. These findings have been confirmed in a study of more than 20,000 patients from Finland (8). Overt nephropathy caused by glomerulosclerosis first appears 10 to 15 years after the onset of type 1 DM and after 5 to 10 years in patients with type 2 DM (21). While diabetic nephropathy is rare before 10 years of DM duration in patients with type 1 DM, approximately 3% of patients with newly diagnosed type 2 DM have evidence of diabetic nephropathy (22). The biologic onset and duration of type 2 DM are often uncertain so that the course of diabetic nephropathy in this patient population is less well defined than in patients with type 1 DM. In addition, the more frequent comorbidities in patients with type 2 DM, such as hypertension and cardiovascular diseases, may alter the clinical presentation of nephropathy in patients with type 2 DM.
Gender
Racial and Ethnic Factors
Several distinct racial and ethnic groups have a greater incidence of type 2 DM than do other such groups. Nephropathy is also more common in the diabetic populations of various ethnic and racial groups. The prevalence of diabetic nephropathy is highest in Native Americans, followed by African Americans, Hispanics, and Caucasians (23,24,25). The Pima Indians of the Southwestern United States have the highest prevalence of type 2 DM (26). Fully half of all Pimas develop type 2 DM by the time they have reached 35 years of age (26). African Americans and Hispanic Americans also have a higher incidence both of DM and of the associated diabetic nephropathy (23,27). These differences in prevalence of diabetic nephropathy among ethnic groups are present after adjustment for other risk factors such as hypertension, socioeconomic status, age, and prevalence of DM within the population (27). In a study of patients with type 2 DM, de Zeeuw et al. (28) found a slightly increased risk for ESRD in Asians and Hispanics relative to the black and white populations examined. Multiple regression analysis demonstrated that baseline albuminuria was the best independent predictor of ESRD in all ethnicities studied.
Genetic Factors
Several lines of evidence support an important role for various genetic factors in the development of diabetic nephropathy. The fact that diabetic nephropathy develops only in a subset of patients with DM has long been interpreted as evidence pointing to genetic factors in its pathogenesis. Familial clustering of diabetic nephropathy in both type 1 and type 2 DM is another indication for probable genetic predisposition for the disease (17,29,30). Evidence for genetic predisposition for diabetic nephropathy is also present in patients with type 2 DM. Sib-pair linkage analysis in Pima Indians with type 2 DM identified strong linkage for diabetic nephropathy on chromosome 7q and also on chromosomes 3, 9, and 20 (31).
Three different approaches may be taken to identify potential genes. These include candidate genes, linkage analysis, and genome-wide association scans (GWAS) (32,33). The candidate gene approach assesses genetic variation by examining single nucleotide polymorphisms (SNPs) in genes that have a possible role in the pathogenesis of the trait being studied. Linkage analysis involves interrogation of hundreds of markers, usually microsatellite markers, which are spread evenly across the genome to identify regions that are coinherited with the trait of interest. Linkage analysis can be further refined in genome scan meta-analysis in which linkage data from independent studies are synthesized. GWAS analyzes large numbers of markers, usually SNPs, in DNA samples from many individuals in order to detect common genetic variations associated with the disease of interest. Results from these various forms of analysis will be considered in turn.
The candidate gene approach studies SNPs in genes involved in metabolic pathways that contribute to the pathogenesis of the changes seen in diabetic nephropathy. Examples for such candidate genes include those (a) mediating the synthesis and degradation of the glomerular capillary basement membrane and mesangial matrix components; (b) components of blood pressure regulation and the renin-angiotensin system (RAS); (c) various cytokines, growth factors, signaling molecules, and transcription factors; (d) advanced glycation processes; (e) activation of protein kinase C (PKC) isoforms; (f ) formation of reactive oxygen species (ROS); (g) increased activity of the aldose reductase (AR) pathway; and (h) genes mediating glucose metabolism and transport (33). Angiotensin-converting enzyme (ACE) plays an important role in the regulation of blood pressure and has a well-known insertion (I)/deletion (D) polymorphism that has been studied in many renal diseases. Persons with the II genotype have the lowest ACE concentrations, while those with the D allele have increased ACE levels (34). A recent large meta-analysis compared the I/D genotype of 26,580 persons with or without diabetic nephropathy and found an increased risk for that condition in the Asian subset with type 2 DM and the presence
of the D allele (35). A similar increased risk for ESRD due to diabetic nephropathy was found in a second meta-analysis in Asian patients with type 2 DM and the DD genotype (36). An early study analyzed 115 candidate genes using a transmission/disequilibrium test in patients with type 1 DM and identified 20 genes with polymorphism (37). However, in spite of a large number of studies that tested the association of candidate genes with diabetic nephropathy, only three analyses have found convincing candidate genes with replicate studies, including PKC-β (38), erythropoietin gene promoter (39), and endothelial nitric oxide synthase (40). However, other investigators (41) using a large case-control meta-analysis were unable to confirm an association of the erythropoietin gene promoter as well as several other previously published associations to diabetic nephropathy.
of the D allele (35). A similar increased risk for ESRD due to diabetic nephropathy was found in a second meta-analysis in Asian patients with type 2 DM and the DD genotype (36). An early study analyzed 115 candidate genes using a transmission/disequilibrium test in patients with type 1 DM and identified 20 genes with polymorphism (37). However, in spite of a large number of studies that tested the association of candidate genes with diabetic nephropathy, only three analyses have found convincing candidate genes with replicate studies, including PKC-β (38), erythropoietin gene promoter (39), and endothelial nitric oxide synthase (40). However, other investigators (41) using a large case-control meta-analysis were unable to confirm an association of the erythropoietin gene promoter as well as several other previously published associations to diabetic nephropathy.
The first linkage study was performed in Pima Indians and showed linkage of loci on chromosome 7 to diabetic nephropathy (31). Linkage studies in a Turkish kindred with diabetic nephropathy found a linkage peak on chromosome 18 (42). Later studies found a candidate gene in this locus, namely, carnosinase-1 (CNDP1) (43). Carnosine acts as an oxygen free radical scavenger and may interfere with the formation of advanced glycosylation end products (32). The Family Investigation of Nephropathy in Diabetes (FIND) study was a genome-wide linkage study of sibling pairs concordant or discordant for diabetic nephropathy in several different ethnic groups (44). This study then spawned additional analyses that confirmed earlier linkage peaks in various subpopulations (32,45,46,47). In general, these family-based linkage studies have lacked consistency and have not succeeded in identifying genetic loci in complex traits such as diabetic nephropathy.
In GWAS, the genome is scanned for SNPs in order to detect common variations for a particular disease. The technology has advanced so that it is now possible to scan up to 5 million SNPs (32). Once possible susceptibility loci are found, they must be replicated in other databases. The first GWAS on diabetic nephropathy was performed on a Japanese population and identified the engulfment and cell motility 1 gene (ELMO1) (48). A pooling approach was used in a GWAS of Pima Indians that found an association between the plasma cell variant translocation 1 locus and diabetic nephropathy (49). Several GWAS have been undertaken using the Genetics of Kidney in Diabetes (GoKinD) collection and have identified possible susceptibility loci (50,51). Additional studies in other ethnic groups have also found susceptibility loci (50,52,53,54). Selected loci are shown in Table 21.1 (50,55). Several investigators have performed meta-analyses of GWAS studies or have used imputation of SNPs in an attempt to find additional susceptibility loci (41,51,56). Sandholm et al. (56) found two SNPs associated with ESRD in type 1 diabetics with diabetic nephropathy. These SNPs were located in the AFF1 gene, which is involved in the transforming growth factor-β pathway and in an intergenic region on chromosome 15q26. These authors also demonstrated an association between diabetic nephropathy and an intronic SNP in the ERBB4 gene (56). Some studies using meta-analysis have failed to confirm previous genes (41). Bowden and Freedman (57) have suggested several explanations for seeming differences including the possibility that a particular gene may be important in one ethnic group and not in another. These studies are highly technical and currently provide locations of SNPs associated with either type 1 or type 2 diabetic nephropathy. Additional work will be required to determine the relevance of these SNPs to the pathogenesis of diabetic nephropathy.
TABLE 21.1 Selected possible susceptibility loci for diabetic nephropathy | ||||||||||||||||||||||||||||||||||||||||||||||||
|---|---|---|---|---|---|---|---|---|---|---|---|---|---|---|---|---|---|---|---|---|---|---|---|---|---|---|---|---|---|---|---|---|---|---|---|---|---|---|---|---|---|---|---|---|---|---|---|---|
| ||||||||||||||||||||||||||||||||||||||||||||||||
Epigenetic mechanisms are also now recognized as important risk factors in diabetic nephropathy. Epigenetics are heritable modifications that occur without changing the DNA structure (58). The epigenetic mechanisms that effect these modifications include DNA methylation, histone posttranslational modifications, small noncoding microRNAs, and long noncoding RNAs (58). Such mechanisms can affect transcriptional memory and regulate aspects of gene expression, including cellular response to environmental cues. The observation that leads to the recognition of a possible role for epigenetics in diabetic nephropathy was the identification of metabolic memory in clinical trials exploring the efficacy of strict glycemic control in modifying the course of this complication in patients with type 1 DM (59). Numerous such trials (reviewed by Tonna et al. (59)) demonstrated that the beneficial effects of strict metabolic control continued for years after the study period despite return of patients to conventional therapy. Benefits included reduced incidence of new cases of microalbuminuria, reduced risk of progression of renal disease, and a lower mean serum creatinine concentration in the intensive treatment group compared to the conventional treatment group. Similar effects have been observed in numerous studies in patients with type 2 DM (59). In one such study, patients were maintained for a period of 10 years on intensive control or conventional therapy and then returned to conventional therapy and followed for an additional 10 years (60). Despite similarities in hemoglobin A1c within 1 year of return to conventional therapy, the group with intensive therapy showed reduced risk for diabetic retinopathy and/or nephropathy of 25%, myocardial infarction of 15%, diabetes-related death of 17%, and any cause of death of 13% (60). The possible epigenetic mechanisms that explain this metabolic memory have not yet been elucidated. However, it has been shown that epigenetic histone posttranslational modifications may affect expression of nuclear factor (NF)-κB in endothelial cells and monocytes in hyperglycemic conditions (58). Additional evidence for a role for epigenetic factors in diabetic nephropathy is
provided in a study in which an inhibitor of histone deacetylase was administered to rats with streptozotocin (STZ)-induced DM (61). Kidney growth is one of the first changes seen in this model. The inhibitor reduced epithelial growth factor receptor mRNA and protein, resulting in decreased tubular proliferation. As we learn more about the epigenome, we will be able to determine the role of particular mechanisms.
provided in a study in which an inhibitor of histone deacetylase was administered to rats with streptozotocin (STZ)-induced DM (61). Kidney growth is one of the first changes seen in this model. The inhibitor reduced epithelial growth factor receptor mRNA and protein, resulting in decreased tubular proliferation. As we learn more about the epigenome, we will be able to determine the role of particular mechanisms.
Smoking
Cigarette smoking is a well-established independent risk factor for the development of the microvascular complications of DM. There are also data indicating that cigarette smoking contributes to the development of diabetic nephropathy. Cigarette smoking increases urinary albumin excretion (UAE) in patients with type 1 DM and also in type 2 DM (62,63). In addition, smoking cessation is associated with reduced UAE in patients with type 1 DM (64). Hua et al. (65) showed that nicotine exposure worsened the progression of diabetic nephropathy in mice. It is likely that smoking hastens progression via increase in oxidative stress (66,67).
Clinical Presentation
Clinical Stages
Mogensen et al. (68) described five clinical stages in the evolution of diabetic glomerulosclerosis in patients with type 1 DM. Stage I is characterized by the presence of both hyperfunction, as manifested by increased GFR, and hypertrophy, as recognized by enlargement of the kidneys affecting both glomeruli and tubules. Stage II develops silently over many years in some patients and is marked by the evolution of glomerular lesions in the absence of clinical evidence of renal disease. A correlation exists between elevation of glycosylated hemoglobin and increased GFR at this stage (69). Stage III marks incipient diabetic nephropathy. It is recognized by the occurrence of microalbuminuria, which is defined as ranging between 20 and 200 µg/min (30 to 300 mg/d) on repeated measurements (68). Renal function is preserved as determined by blood urea nitrogen (BUN) and serum creatinine. Increased blood pressure may be present at this stage, but it rarely occurs in patients with UAE less than 100 mg/d (70). Stage IV is characterized by the presence of overt diabetic nephropathy as clinically manifested by proteinuria greater than 300 mg/d and a declining GFR. Microscopic hematuria may be identified in 28% to 48% of patients with diabetic nephropathy (69). This stage is usually associated with rising systemic blood pressure and the presence of other diabetic complications. Development of overt nephropathy with albuminuria was once considered to be the “point of no return” with steady progression to ESRD. However, several studies in patients with type 1 DM have documented beneficial effects of glycemic control and antihypertensive treatment on the progression of diabetic nephropathy (71,72,73). Stage V is the appearance of ESRD in patients with diabetic nephropathy. More recent studies have demonstrated that the progression of renal disease through these stages may not be inexorable, but that microalbuminuria may regress as discussed in the next section (74). Some authors now suggest using the stages of CKD as defined by the National Kidney Foundation rather than the stages described above (15,75).
The clinical progression to diabetic glomerulosclerosis is not so clear-cut in type 2 DM, partly because of the difficulty of determination of the actual biologic onset of the diabetes itself. Stages I and II in patients with type 2 DM are similar to those seen in patients with type 1 DM (76). It is more difficult to determine the onset of stage III in a patient with type 2 DM. Microalbuminuria, the cardinal laboratory feature of stage III diabetic nephropathy, may be present at the time of diagnosis of DM in as many as 26% of patients (77); however, the microalbuminuria may reflect hypertension, nephrosclerosis, or other related conditions rather than diabetic renal disease.
Microalbuminuria and Risk for Diabetic Nephropathy
Approximately 70% of screened patients with type 1 and type 2 DM have normoalbuminuria (78). Microalbuminuria, defined as 30 to 299 mg/24 hours, a cutoff value adopted by the American Diabetes Association (79,80), has been widely regarded as the best available marker for risk of later development of diabetic nephropathy in both type 1 and type 2 diabetic patients (81,82,83,84). However, it is now well known that microalbuminuria does not indicate certain progression to diabetic nephropathy (74,85,86). Microalbuminuria is considered to be a promoter of renal functional deterioration, and a reduction of microalbuminuria or prevention of development of microalbuminuria is important in preserving renal function.
According to several studies, the prevalence of microalbuminuria is below 20% in patients with type 1 DM and, on average, slightly above 20% in patients with type 2 DM (22,26,68,82,87,88). The cumulative incidence of microalbuminuria in patients with type 1 DM was 12.6% over 7.3 years in the European Diabetes Prospective Complications Study Group (89) and approximately 33% in an 18-year follow-up study from Denmark (90). The rate of progression from microalbuminuria to proteinuria over 5 to 10 years in patients with type 1 DM is approximately 15% to 30% (86,91). The estimated incidence of progression from normoalbuminuria to microalbuminuria and subsequent proteinuria during a follow-up of 6 to 9 years in patients with type 2 DM is approximately 20% to 30% (91). A European study using data from greater than 5000 patients with type 2 DM found that progression from normoalbuminuria to microalbuminuria occurred at a rate of 2.0% per year and from microalbuminuria to proteinuria at 2.8% per year (18). It should be noted that such progression is not inevitable. Perkins et al. (74) studied 386 patients with type 1 DM and microalbuminuria persistent for 2 years with follow-up of 6 years. The cumulative incidence of increase to proteinuria was 19% over the 6 years of the study. Regression defined as halving of the microalbuminuria was frequent with a cumulative incidence of 59% (74). Independent predictors of regression included microalbuminuria for shorter interval, hemoglobin A1c less than 8%, systolic blood pressure less than 115 mm Hg, cholesterol less than 198 mg/dL, and triglyceride less than 145 mg/dL. The authors suggested that the microalbuminuria may indicate possible reversible forms of injury. Other investigators have also demonstrated the occurrence of regression of microalbuminuria. In a large European study, a regression rate of 50.6% has been demonstrated in type 1 diabetics with microalbuminuria after 7 years of follow-up (86). In the Steno-2 study, 46 (31%) out of 151 patients with type 2 DM and microalbuminuria reverted to normoalbuminuria during 7.8 years of follow-up (85). In the latter study, antihypertensive therapy and improved glycemic control were independent predictors for remission (85).
Additional studies examined other aspects of the relationship between microalbuminuria and the onset of diabetic nephropathy. In the first of these, Perkins et al. (92) studied 301 diabetic patients with normoalbuminuria and 267 patients with microalbuminuria over a period of 8 to 12 years. Using cystatin C as a measure of GFR, they defined early decline in renal function as a decrease of 3.3% per year. They found such decline in 9% of patients with normoalbuminuria, 16% of those with regression of microalbuminuria, 32% of those with stable microalbuminuria, and 68% of those with progression of microalbuminuria. Thus, microalbuminuria was associated with greater risk of renal decline. However, renal decline also occurred in the absence of microalbuminuria. The authors suggested that GFR should be followed in addition to albuminuria in patients with DM (92). This same group then examined 79 patients with type 1 DM with new onset of microalbuminuria over a period of 12 years (93). Twenty-three progressed to significant chronic renal disease (NKF stages 3, 4, or 5) during the interval of the study, but only 12 had proteinuria. The other 11 in this group had persistent microalbuminuria or even returned to normoalbuminuria. The risk of developing CKD was increased in the presence of proteinuria and elevated glycosylated hemoglobin, but proteinuria was not necessary. It should be noted that biopsies were not performed to determine the type of renal disease present. From this group of studies, the authors conclude that microalbuminuria does increase the risk of developing renal disease in diabetic patients, but it is insufficient to predict diabetic nephropathy or renal function decline. The latter may occur in the absence of proteinuria. Thus, they support the discovery of other biomarkers to aid in such prediction rather than continued reliance on microalbuminuria alone (93).
Biomarkers Other Than Microalbuminuria
With the recognition that microalbuminuria is not sufficient as a biomarker for the presence of diabetic nephropathy, a search for other possible biomarkers began. The first molecules considered were indicators of tubular injury such as neutrophil gelatinase-associated lipocalin (N-GAL) and kidney injury molecule-1 (KIM-1) (94). However, neither N-GAL nor KIM-1 has been shown to be a specific predictor for diabetic renal disease as adjustments for proteinuria negated associations that had been present (94). A third marker of tubulointerstitial injury, urinary liver-type fatty acid-binding protein (u-LFABP), is increased in diabetic patients prior to the onset of proteinuria (95). In this study of 165 patients with type 1 DM, the urinary levels of LFABP predicted the progression of diabetic nephropathy and all-cause mortality independent of UAE and other risk factors (95). However, additional studies are required to validate this result (94).
Investigators at the Joslin Clinic followed 410 patients with DM type 2 for 12 years having measured markers of systemic inflammation, endothelial dysfunction, and the tumor necrosis factor (TNF) pathway at entry (96). They found that circulating TNF receptors 1 and 2 predicted the occurrence of ESRD in this population. These were the only markers to associate with the risk for ESRD. TNFR1 surpassed all other clinical variables examined in the prediction of ESRD (96). In a companion article, the same group found that TNFR1 and TNFR2 predicted declines in renal function in patients with type 1 DM (97). Urinary levels of inflammatory cytokines have also been measured and may prove promising as biomarkers (94).
Urinary proteome analysis is a new technique that may allow detection of patients with diabetic nephropathy (98). In this study, the global protein content of 165 patients was determined by surface-enhanced laser desorption/ionization-time of flight/mass spectrometry and examined by classification and regression tree analysis. The study included normal controls and diabetic patients with normoalbuminuria, microalbuminuria, and biopsy-proven diabetic nephropathy or nondiabetic CKD. In addition, nondiabetic patients with biopsy-proven CKD were included. A specific proteomic signature identified patients with type 2 DM who had diabetic renal disease (98). The two most prominent predictive peaks in this analysis were identified as β2-microglobulin and ubiquitin (98). Of particular interest, it was noted that this analysis could differentiate between diabetic nephropathy and nondiabetic renal disease in diabetics. This technique has also been used by others, and various peptides and orosomucoids have been detected as potential biomarkers for diabetic renal disease (94).
Other potential molecules for study include extracellular matrix (ECM)-related proteins, oxidative stress markers, enzymes, advanced glycation end products (AGEs), podocyte markers, and pigment endothelium-derived factor (94). Validation of any of these potential markers will be required prior to use in the clinical setting. Moreover, as diabetic nephropathy is a complex disease with a multigenetic background as well as multifactorial pathogenesis, it is not likely that a single biomarker will be sufficient to predict disease or progression of the disease.
Pathologic Findings
The possible association of specific glomerular lesions with DM was first recognized by Kimmelstiel and Wilson in 1936 (99). They described a series of eight patients who, at autopsy, had a striking formation of nodules. Seven of these patients had diabetes, whereas the remaining patient was moribund without available clinical history. Edema and heavy proteinuria were present, accompanied by high blood pressure in some patients. At the same time, Murakami (100) in Japan described a similar histologic picture in a single patient. Additional studies since that time have described the histologic alterations that are characteristic of diabetic glomerulosclerosis and are accompanied by a stereotypical clinical course.
Gross Appearance
The kidney of the diabetic patient may be increased, decreased, or normal in size. At early stages, it is invariably increased, particularly in patients with hyperfiltration (68). When diabetic glomerulosclerosis progresses with scarring and loss of nephrons, one sees a reduction in the size of the kidney, but the end-stage kidney of the diabetic patient is frequently larger than the end-stage kidney seen in other conditions (Fig. 21.1). On the cut surface, preservation of normal architecture is noted. With proper lighting, one may be able to detect hypertrophied glomeruli within the cortex. Frequently, the arteries at the corticomedullary junction are prominent because thickening of their walls resulting from arteriosclerosis prevents their retraction into the parenchyma. The main renal artery and its branches may show atherosclerosis.
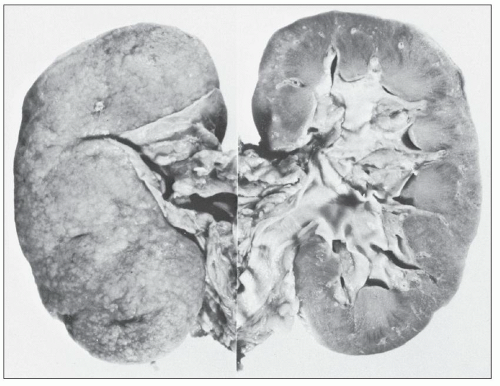 FIGURE 21.1 Kidney from a 48-year-old woman with diabetes of 13 years’ duration. Nodular glomerulosclerosis was diagnosed on biopsy after nephrotic syndrome 3 years before death from renal failure. Each kidney weighed 90 g. The subcapsular surface is granular, and the cut surface shows a slight reduction in cortical width. |
Light Microscopy
GLOMERULI
The glomeruli show a constellation of findings. The earliest change is diffuse uniform thickening of the capillary wall (Fig. 21.2) that may be difficult to detect on light microscopy. Additional alterations include a diffuse form with mesangial sclerosis, manifest as an increase in mesangial matrix, a nodular mesangial lesion sometimes combined with microaneurysms, exudative or hyalinosis lesions, and the capsular drop. At early stages, glomerular volume is enlarged 70% as compared with the glomeruli of nondiabetic subjects (101). Filtration surface area is increased by 80% in a similar comparison.
Diffuse Lesion The diffuse lesion consists of widespread increase in eosinophilic, periodic acid-Schiff (PAS)-positive material within the mesangium as first described by Spuhler and Zollinger (102). Hypercellularity is uncommon (103), although it may occur. Uniform increase in the thickness of the capillary walls may be seen (see Fig. 21.2) as early as 2 years after the onset of DM and may not be accompanied by clinical evidence of renal dysfunction (104,105). The mesangial alterations progress in severity (Fig. 21.3) usually but not always accompanied by concomitant capillary wall thickening, increasing with duration of disease (106). The combination of mesangial expansion and thickened glomerular basement membrane (GBM) results in decreasing the patency of the capillary lumina and decreased filtration surface area. Two populations of obsolete glomeruli are present in diabetic nephropathy. The most prevalent are enlarged solidified glomeruli due to the increase in mesangial matrix (Fig. 21.4). The other form is that typical of ischemic change without increased matrix and showing wrinkling of capillary loops (Fig. 21.5). This latter population is present due to the fact that arteriosclerosis contributes to the evolution of diabetic renal disease. The Bowman capsule may be thickened in the more advanced lesions.
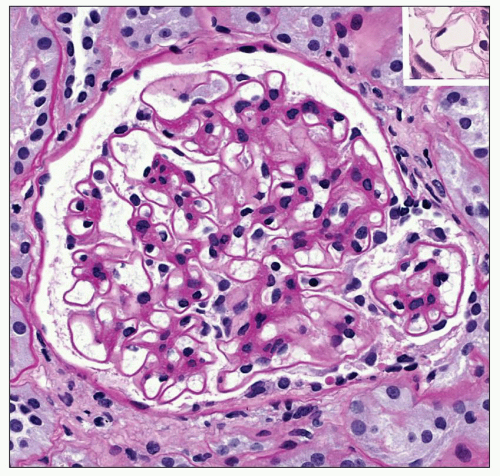 FIGURE 21.2 Glomerulus showing global uniform thickening of the capillary wall. Compare capillary wall thickness to inset at same magnification from patient with minimal change disease. Slight mesangial matrix increase is also present. (PAS, ×390; inset: H&E, ×390.) |
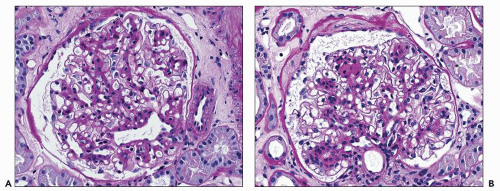 FIGURE 21.3 Glomeruli showing progression from mild mesangial matrix increase (A) to moderate increase in matrix with early nodule formation at 12 o’clock (B). (PAS, A: ×260, B: ×260.) |
Nodular Lesion The nodular lesion is the type of change first recognized by Kimmelstiel and Wilson (99). Typically, it is characterized by the accumulation of homogeneous eosinophilic material within the mesangium often appearing as a rounded accentuation of the mesangial expansion (Fig. 21.6). Formation of a Kimmelstiel-Wilson nodule is recognized when expansion of the mesangium attains a size at least one and one half times that of the normal mesangial stalk. As such, it should measure greater than 40 µm in diameter, but it may be as much as 100 µm (107). Such lesions are usually acellular, although nuclei may be arranged at the periphery. Bloodworth (107) noted at least one nodule in 25% of kidneys studied in 200 consecutive autopsies of patients with DM. Several lobules may be affected within any given glomerular tuft, and in this case, the nodules often vary in size (Fig. 21.7). On occasion, glomeruli may have a single large nodule. These variants tend to have a laminated appearance, particularly when viewed with silver or reticulin stains (Fig. 21.8); they may have a separate pathogenesis as discussed below. The number of glomeruli with nodules varies from case to case. The nodules are PAS positive, the smaller lesions staining more intensely than the larger ones. They stain green or blue with Masson trichrome, blue with Mallory stain, and black with silver stains. Falk et al. (108) reported an increase in mesangial staining for fibronectin, laminin, and types IV and V collagen in early and moderately
advanced mesangial lesions with an increase only of type V collagen in late nodules. Other investigators have demonstrated increases in collagen type 1 as well as the proteoglycans decorin and biglycan (109). More recently, aberrant laminins have been demonstrated in the matrix as the expansion progresses (110). These modifications in the composition and amount of mesangial matrix are due to both increased synthesis and decreased degradation as discussed in the “Pathogenesis” section (109).
advanced mesangial lesions with an increase only of type V collagen in late nodules. Other investigators have demonstrated increases in collagen type 1 as well as the proteoglycans decorin and biglycan (109). More recently, aberrant laminins have been demonstrated in the matrix as the expansion progresses (110). These modifications in the composition and amount of mesangial matrix are due to both increased synthesis and decreased degradation as discussed in the “Pathogenesis” section (109).
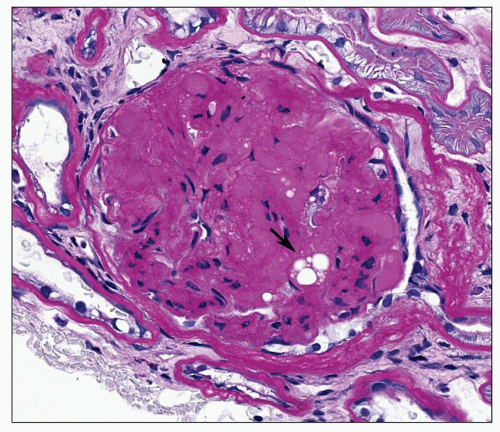 FIGURE 21.4 Solidified glomerulus filling the entire Bowman space. Note hyalinosis lesion with lipid droplets (arrow). (PAS, ×350.) |
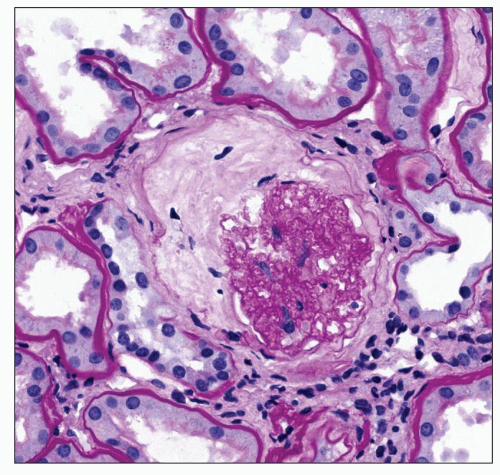 FIGURE 21.5 Ischemic change in the glomerulus, with collagen forming internal to the Bowman capsule. This change is commonly found when arterial disease is advanced. (PAS, ×380.) |
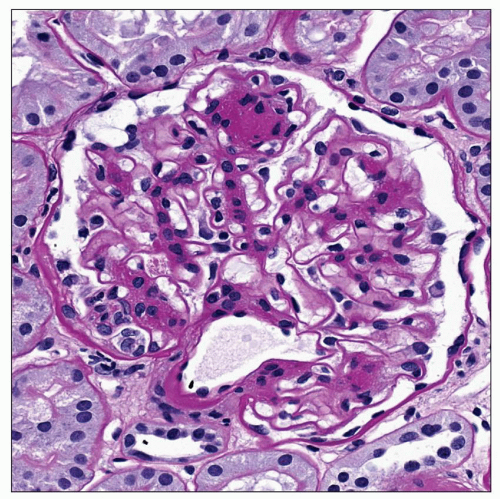 FIGURE 21.6 Glomerulus with a single well-developed Kimmelstiel-Wilson nodule at 12 o’clock. Also note uniform thickening of the GBM. (PAS, ×390.) |
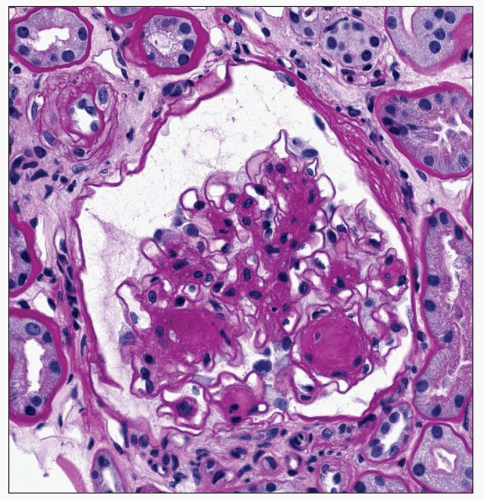 FIGURE 21.7 Glomerulus from a patient with well-developed nodular diabetic glomerulosclerosis. Several well-formed nodules with cells arranged around the periphery are present with smaller developing nodules present in other lobules. (PAS, ×350.) |
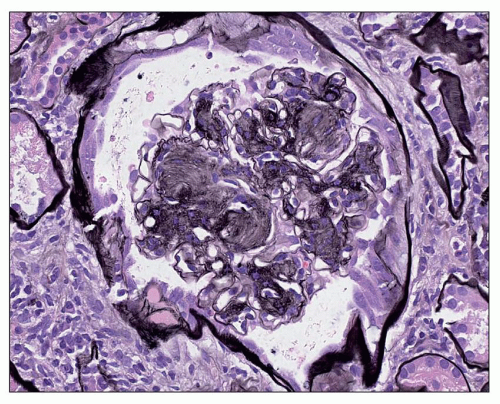 FIGURE 21.8 Glomerulus with multiple nodules with laminations. (Periodic acid-methenamine silver, ×260.) |
Two populations of nodular lesions exist. The smaller, more numerous nodules arise as continued mesangial expansion of the diffuse lesion (see Fig. 21.6) (106,107). However, the larger, often solitary, and laminated nodules may originate in relation to microaneurysms (107,111,112,113), which are defined in this context as cystic dilations of the capillary measuring greater than 35 µm in diameter (Fig. 21.9). Investigators have observed that the frequency of microaneurysms and large nodules is similar and that microaneurysms may precede the development of large nodules (107). Such microaneurysms may arise in association with mesangiolysis (107,112,113,114), and a
progression of changes has been described wherein the GBM is loosened from its anchoring points as it reflects back over the mesangium (114). This change is accompanied by disintegration of the mesangial matrix (Fig. 21.10), the appearance of fibrillar material, and increasing compaction of the mesangial material resulting in the formation of several layers and a large nodule (Fig. 21.11). Agents implicated in the development of microaneurysms include platelet factors, hemodynamic factors, and possible changes in elasticity of the GBM (107,112,113). Stout et al. (115) suggested a different pathogenetic mechanism for the Kimmelstiel-Wilson nodule. Focal mesangiolysis appears first and progresses from an edematous to a proliferative stage characterized by a loose but organized fibrillar matrix. As this matrix condenses, the lesion changes from focal nodular mesangial expansion to a simple Kimmelstiel-Wilson nodule. Repeated injury then results in a similar progression of changes and the eventual formation of the laminated lesion called the complicated nodule. Paueksakon et al. (112) found increased plasminogen activator inhibitor-1 (PAI-1) in such lesions, particularly those in which they found fragmented red blood cells, an indicator of microvascular injury. They suggested this repeated microvascular injury caused the mesangiolysis.
progression of changes has been described wherein the GBM is loosened from its anchoring points as it reflects back over the mesangium (114). This change is accompanied by disintegration of the mesangial matrix (Fig. 21.10), the appearance of fibrillar material, and increasing compaction of the mesangial material resulting in the formation of several layers and a large nodule (Fig. 21.11). Agents implicated in the development of microaneurysms include platelet factors, hemodynamic factors, and possible changes in elasticity of the GBM (107,112,113). Stout et al. (115) suggested a different pathogenetic mechanism for the Kimmelstiel-Wilson nodule. Focal mesangiolysis appears first and progresses from an edematous to a proliferative stage characterized by a loose but organized fibrillar matrix. As this matrix condenses, the lesion changes from focal nodular mesangial expansion to a simple Kimmelstiel-Wilson nodule. Repeated injury then results in a similar progression of changes and the eventual formation of the laminated lesion called the complicated nodule. Paueksakon et al. (112) found increased plasminogen activator inhibitor-1 (PAI-1) in such lesions, particularly those in which they found fragmented red blood cells, an indicator of microvascular injury. They suggested this repeated microvascular injury caused the mesangiolysis.
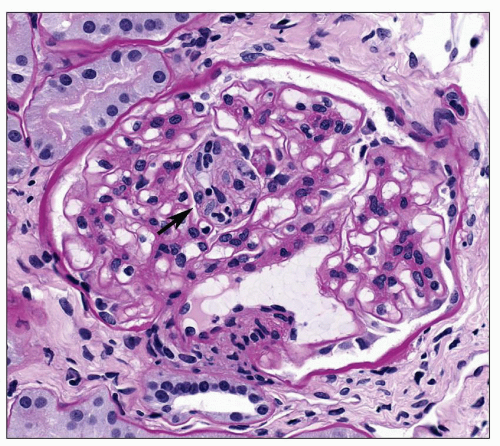 FIGURE 21.9 Glomerulus with a small microaneurysm in center containing blood elements (arrow) above hilar vessels. Capillary walls are thickened throughout the entire glomerulus. (PAS, ×330.) |
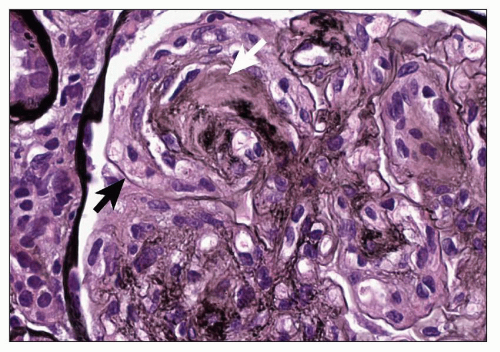 FIGURE 21.10 Glomerulus showing disintegration of the mesangial matrix (white arrow) and loss of anchoring points of the GBM (black arrow) from the mesangium. (Periodic acid-methenamine silver, ×450.) |
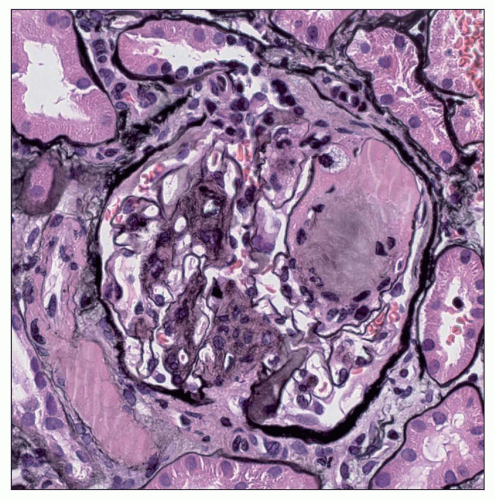 FIGURE 21.11 Portion of the glomerulus with a microaneurysm showing compaction of fibrillar material and mesangial matrix to form a large mesangial nodule. (Periodic acid-methenamine silver, ×400.) |
Considerable overlap of the diffuse and nodular lesion occurs. However, it is useful to identify the nodular lesion because it signifies a more severe pathologic form of diabetic nephropathy (112,115) and corresponds to the presence of clinical signs and symptoms. Moreover, the presence of mesangial nodules should always arouse suspicion of diabetes. Methods to differentiate other conditions with mesangial expansion are considered in the section on “Differential Diagnosis” below.
Podocyte Loss and Hyalinosis Lesion Reduction in the number of podocytes has been documented in patients with both type 1 and type 2 DM (116,117). This reduction in podocyte number is associated with increasing proteinuria (118). Podocyte loss is associated with apoptosis, which is increased with high glucose and may also be associated with decreased synthesis of integrins involved in attachment of the podocyte to the GBM (119,120). It has been further suggested that the loss of podocytes results in denudation of the GBM and may be an initiating factor in glomerulosclerosis (121).
The hyalinosis lesion, which is another name for the so-called exudative/insudative lesion or fibrin cap, is often present in diabetic nephropathy in areas of segmental sclerosis. The initial change characteristic of this lesion is the accumulation of hyaline eosinophilic homogeneous material between endothelial cells and the GBM of the capillary loops. As the lesion evolves, the material, which represents various plasma constituents, increases in amount and eventually occludes the capillary lumen. On occasion, lipid droplets and even lipid-laden macrophages may be present within the lesion (Fig. 21.12A). The epithelial cells overlying these lesions are frequently enlarged and may show vacuoles or protein droplets. Adhesions are often observed between the glomerular lobule containing such a lesion and the nearby Bowman capsule. The material within the capillary lumen stains intensely pink with PAS (Fig. 21.12B). Use of the methenamine silver stain with PAS and hematoxylin and eosin counterstains differentiates these lesions from nodules. The combination of PAS and eosin intensifies the staining of the hyalinosis lesion producing contrast with the silver-staining nodule (Fig. 21.12C). Furthermore, the silver stains the basement membrane and reveals the luminal location of the hyalinosis lesion.
This lesion is not specific for diabetic nephropathy, although it is seen in approximately 60% of diabetic kidneys (107). It is identical to the lesion characteristic of focal segmental glomerular sclerosis and may be seen nonspecifically in certain other glomerular diseases including various forms of glomerulonephritis and reflux nephropathy. The pathogenesis of the lesion is not well understood, although its early development has been associated with endothelial injury and possible hemodynamic alterations (122). Its prevalence in diabetic kidneys increases with the severity of the nephropathy and correlates with the degree of arteriosclerosis (123). Segmental glomerulosclerosis with the hyalinosis lesion and adhesion has been associated with proteinuria (124).
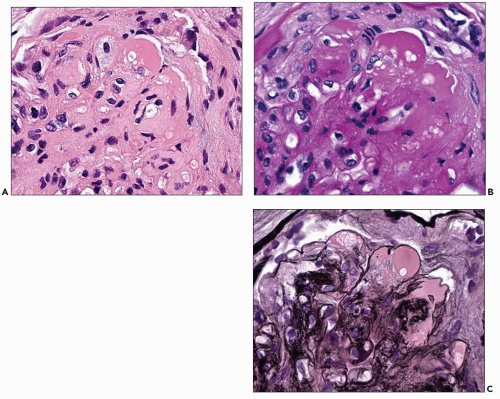 FIGURE 21.12 Consecutive sections using different stains of a portion of a glomerulus with well-developed hyalinosis (exudative) lesions. A: These eosinophilic areas, which sometimes contain lipid, appear in the concavities of capillaries. (H&E, ×510.) B: The lesions stain magenta in this photomicrograph and show a glassy appearance. (PAS, ×550.) C: This stain shows the GBM in black with the lesion staining pink clearly within the capillary lumen. (Periodic acid-methenamine silver, ×530.) |
The lesion called the capsular drop is identified as a round, eosinophilic accumulation of material between the basement membrane and parietal epithelial cells of the Bowman capsule (Fig. 21.13). It has the same staining qualities as the hyalinosis lesion. This unusual lesion is most frequently seen in diabetes although it may be seen in other conditions (125).
Miscellaneous Glomerular Changes One of the early physiologic changes in diabetics is the occurrence of glomerular hyperfiltration accompanied by glomerular hypertrophy. Some of the patients with hyperfiltration then proceed to develop the characteristic histologic changes of diabetic nephropathy described earlier, namely, increased mesangial matrix, the nodular lesion, increased thickness of the GBM, and the hyalinosis lesion. As these lesions evolve, the solidified glomeruli fail to undergo contraction, and the result is a population of large obsolescent glomeruli (see Fig. 21.4). A second population of smaller obsolescent glomeruli may also emerge in response to the vascular disease that is a frequent companion to the glomerular disease in diabetes. Thus, these smaller glomeruli are identical to those seen in ischemic renal disease in other conditions (see Fig. 21.5). Furthermore, they are present in a
distribution expected for vascular disease; that is, they occur in stripes perpendicular to the capsular surface within the distribution of the affected vessel (126,127).
distribution expected for vascular disease; that is, they occur in stripes perpendicular to the capsular surface within the distribution of the affected vessel (126,127).
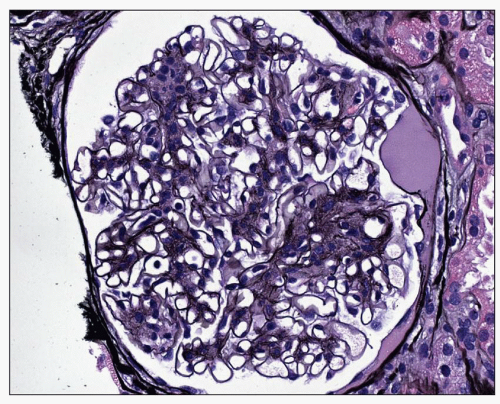 FIGURE 21.13 Glomerulus with capsular drop at 3 o’clock. (Periodic acid-methenamine silver, ×260.) |
Atubular glomeruli have also been seen in diabetic nephropathy (124,128). Atubular glomeruli are defined as those glomeruli that have open glomerular capillaries but have lost their connection to the proximal tubule and presumably do not produce filtrate (129). Accurate determination of these glomeruli requires serial sections. However, small glomeruli surrounded by tissue with marked tubular loss are likely to be atubular (Fig. 21.14). Najafian et al. (128) using the appropriate morphometric techniques found that 17% of glomeruli in diabetics were atubular and that an additional 51% were attached to atrophic tubules. They found that these glomeruli could account for much of the variation in GFR in diabetic patients. Furthermore, glomeruli with such glomerulotubular abnormalities were found in 77% of glomeruli in patients with proteinuria compared to only 4% of glomeruli in patients with microalbuminuria (124).
TUBULES
The tubules generally show changes that reflect the degree of glomerular alterations. Obsolescent glomeruli (of either variety) show atrophy of adjacent tubules with decreased size of epithelial cells and diminished luminal diameters. Similar changes are also seen in the tubules that belonged to now atubular glomeruli. Apoptosis has been detected in both proximal and distal tubules of the diabetic kidney (130) and represents a possible mechanism for the loss of the tubular cells. The tubular basement membrane is often thicker than expected for the degree of atrophy (Fig. 21.15). Occasionally, proximal tubular epithelial cells are finely vacuolated and contain lipid; this usually occurs in patients manifesting the nephrotic syndrome. The straight portion (S3) of the proximal tubules may show the glycogen-containing Armanni-Ebstein change (Fig. 21.16), but this is seen only rarely.
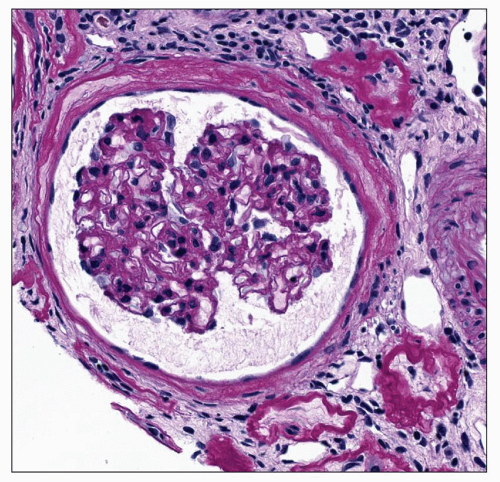 FIGURE 21.14 Glomerulus that has likely lost its connection to its proximal tubule, although serial sections would be needed to confirm this change. Note marked atrophy of surrounding tubules and wrinkling of glomerular capillary loops. (PAS, ×320.) |
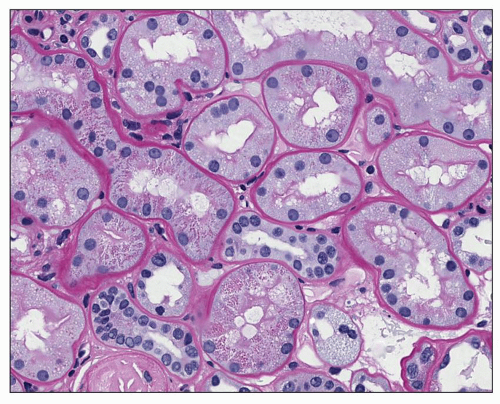 FIGURE 21.15 Light micrograph showing mild thickening of the tubular basement membrane in tubules with slight tubular injury. (PAS, ×320.) |
INTERSTITIUM
Interstitial fibrosis is common in the diabetic kidney and may be accompanied by chronic inflammatory infiltrates composed chiefly of T lymphocytes and macrophages (131,132,133) (Fig. 21.17A). A Th1 process has been implicated in type 1 DM (131). Eosinophils are also frequently noted within the interstitial infiltrate (Fig. 21.17B). In some cases, this represents a hypersensitivity-type reaction superimposed on the diabetic nephropathy, but this is not necessarily the case. Mast cells are increased in kidneys of patients with type 2 DM and renal disease (134). The number of mast cells was correlated
to the increase in interstitial volume as well as to decrease in estimated GFR (eGFR) (134). It is now considered that these inflammatory cells play an active role in the pathogenesis of the interstitial fibrosis. The increase in interstitial volume is due largely to increase in cells at early stages of diabetic nephropathy associated with only mild glomerular changes (135). Increases in collagen and other matrix components occur later in the disease (135). The presence of interstitial fibrosis, particularly when accompanied by inflammatory infiltrate, correlates inversely with renal survival (133,136). Lane et al. (137) demonstrated that mesangial expansion, arteriolar hyalinosis, global glomerular sclerosis, and interstitial expansion are interrelated. However, the progression in each compartment is not stereotypic for all patients. Thus, in some patients, the severity of interstitial disease may be greater than that of glomerular lesions, whereas in others, the reverse may be true.
to the increase in interstitial volume as well as to decrease in estimated GFR (eGFR) (134). It is now considered that these inflammatory cells play an active role in the pathogenesis of the interstitial fibrosis. The increase in interstitial volume is due largely to increase in cells at early stages of diabetic nephropathy associated with only mild glomerular changes (135). Increases in collagen and other matrix components occur later in the disease (135). The presence of interstitial fibrosis, particularly when accompanied by inflammatory infiltrate, correlates inversely with renal survival (133,136). Lane et al. (137) demonstrated that mesangial expansion, arteriolar hyalinosis, global glomerular sclerosis, and interstitial expansion are interrelated. However, the progression in each compartment is not stereotypic for all patients. Thus, in some patients, the severity of interstitial disease may be greater than that of glomerular lesions, whereas in others, the reverse may be true.
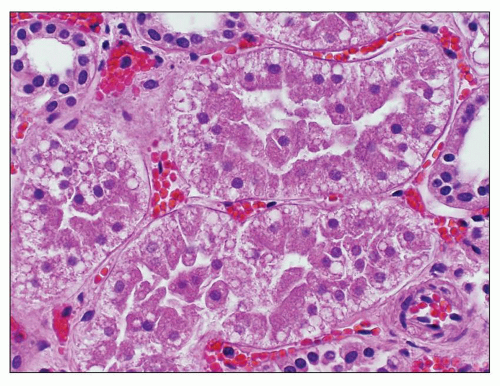 FIGURE 21.16 Light micrograph showing tubules with Armanni-Ebstein lesion characterized by a subnuclear vacuole representing glycogen. (H&E, ×380.) (Courtesy of Dr. Melvin Schwartz.) |
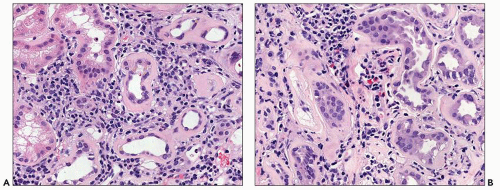 FIGURE 21.17 Light micrographs of typical patterns of interstitial inflammation in diabetic nephropathy. A: Dense inflammation is composed chiefly of lymphocytes and macrophages with rare plasma cells. Note the variable thickening of the tubular basement membrane surrounding damaged tubules. (H&E, ×320.) B: Cluster of eosinophils is found within an area of interstitial inflammation and damaged tubules. More plasma cells are also seen within this focus. (H&E, ×320.) |
BLOOD VESSELS
Both arteries and arterioles invariably show the typical changes of arteriosclerosis and arteriolosclerosis, respectively. In arteries, this type of injury is manifested by varying degrees of intimal thickening accompanied by reduplication of elastic lamina. Hyaline arteriolosclerosis is a frequent and early manifestation of diabetic renal disease and is more pronounced in diabetes than in other diseases of the kidney. It is characterized by often striking hyaline deposition in arterioles (Fig. 21.18), and both afferent and efferent limbs may be affected. Østerby et al. (138) noted increase in vascular disease associated with more severe glomerular damage. These investigators assessed the ratio of matrix to media in arterioles from diabetic patients with and without microalbuminuria (138,139) and found that this ratio was increased in patients with microalbuminuria. This finding suggested that arteriolar matrix accumulation may be similar to increased matrix elsewhere in diabetes and can occur early in the course of the disease. Furthermore, this change progresses with the duration of disease (138). Three-dimensional analysis of the vascular pole of the glomerulus demonstrated new vessel formation with anastomoses between glomerular capillaries near the hilus and peritubular capillaries (140). The presence of intrarenal microaneurysms in arterioles has been documented using microangiography (111).
Immunofluorescence Microscopy
Immunofluorescence techniques have been used in several studies. The typical finding is the occurrence of linear staining along the glomerular capillary walls with immunoglobulin G (IgG) (Fig. 21.19) (141,142,143,144). The intensity of the staining
varies among individual patients and does not correspond to the severity of the glomerular lesions (144). Linear staining of capillary walls has also been reported with IgM, the third component of complement (C3), fibrinogen, and albumin (141,144). Staining of the mesangium and Kimmelstiel-Wilson nodules is rarer and usually shows fainter staining than that reported for capillary walls (141,144).
varies among individual patients and does not correspond to the severity of the glomerular lesions (144). Linear staining of capillary walls has also been reported with IgM, the third component of complement (C3), fibrinogen, and albumin (141,144). Staining of the mesangium and Kimmelstiel-Wilson nodules is rarer and usually shows fainter staining than that reported for capillary walls (141,144).
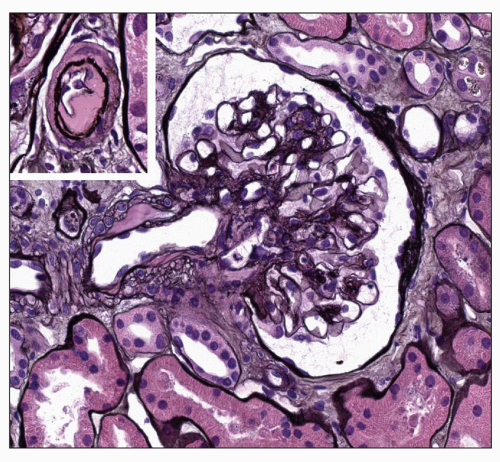 FIGURE 21.18 Hyaline arteriolosclerosis affecting the afferent arteriole in a patient with diabetes. The glomerulus shows diffuse mild mesangial expansion. The inset demonstrates a cross-section of a similar lesion. (Periodic acid-methenamine silver, ×300; inset: ×430.) |
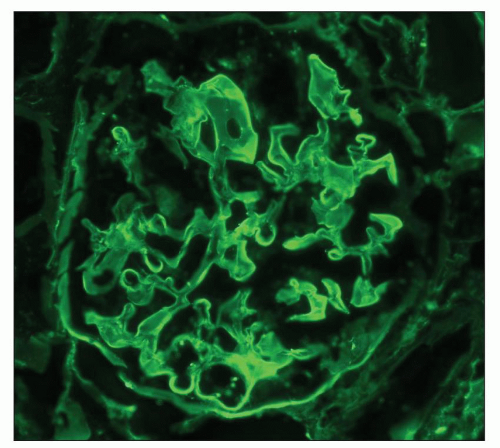 FIGURE 21.19 Immunofluorescence micrograph of a glomerulus with a diabetic nodule at 6 o’clock using antiserum to IgG. One sees positive linear staining along capillary walls. (×320.) |
Hyalinosis lesions usually stain brightly with IgM and C3, as they do in the identical lesions found in focal segmental glomerular sclerosis, pyelonephritis, and elsewhere. IgM and C3 are also present in arteriolar hyalin in vessels showing hypertensive changes. Hyalinosis lesions may also contain fibrinogen and lipoprotein (142) or fibrinogen, complement, β-lipoprotein, and small amounts of IgG (143).
Linear staining for IgG and albumin has also been reported along the tubular basement membranes and Bowman capsule in patients with advanced diabetic glomerulosclerosis (145) (Fig. 21.20). The staining was thought to reflect structural changes in the renal extracellular membranes, which permit entrapment of serum proteins, possibly as a result of changes in permeability. It is now believed that advanced glycosylation end products may bind to the basement membranes and change their properties (146).
Electron Microscopy
In the capillary wall, morphologic changes are present in all three layers, GBM, visceral epithelium, and the endothelium. These will be discussed in turn. Most authors agree that increase in the thickness of the GBM is the earliest change (105,147,148) (Fig. 21.21). Huang (149), using guanidine treatment, showed that the increase in basement membrane thickness was due to increased amounts of material from the epithelial rather than from the endothelial cells. The isolated finding of the thickened GBM is a possible manifestation of prediabetes as demonstrated in one study in 23 patients who presented with proteinuria greater than 0.5 g/d sometimes accompanied by hematuria but without clinical evidence of diabetes (150). Two years later, seven patients remained normoglycemic, six had fasting blood glucose between 110 and 125 mg/dL, three had impaired glucose tolerance, and seven had become diabetic (150). As duration of diabetes increases, greater variability in thickness of the GBM is observed (151,152), but interindividual variation and interglomerular variation contribute to the large standard deviations (105). Vogler et al. (152) studied 15 patients with type 1 diabetes and found areas of attenuation of the GBM in six patients. In part, this change is related to the thinner GBM in microaneurysms (Fig. 21.22). Østerby and Nyberg (151) observed similar basement membrane thinning in severely affected diabetic kidneys. In such cases, the GBM measured as little as 100 nm and comprised 1% to 5% of the total capillary length in individual glomerulus. Changes in the biochemical composition of the GBM have been reported by various investigators. Spiro (153) first recorded an increase in hydroxylation of lysine and in the number of disaccharide units. Additional work from his laboratory has shown decreased heparan sulfate and laminin (154). Other authors, using immunohistochemical localization techniques, detected a change in charge density resulting from alteration in the location of the heparan sulfate rather than an absolute decrease in the amount (155,156). Kim et al. (157) showed a change in the chains of collagen type IV in the GBM.
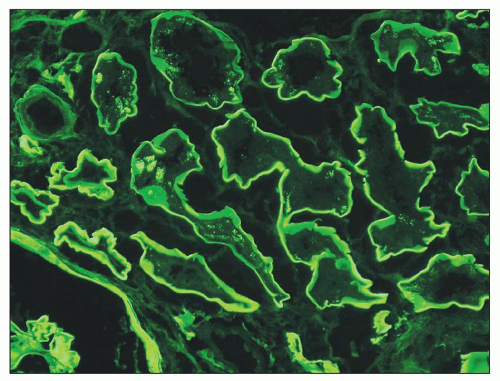 FIGURE 21.20 Immunofluorescence micrograph showing linear staining for albumin along the tubular basement membrane. (×400.) |
Changes in the foot processes of visceral epithelial cells are variable. At times, they remain discrete, whereas other cases have differing degrees of effacement (101,105,107,148,151,152). Østerby et al. (151) measured a mean width of the foot process of 352 nm in diabetics as compared with a mean width of 224 nm in nondiabetic control patients. Widening of foot processes appears with the onset of microalbuminuria (158). Pagtalunan et al. (117) in a study of Pima Indians did not document widened foot processes until the stage of clinical nephropathy. Furthermore, these investigators were the first to note absolute loss in the number of visceral epithelial cells during clinical
nephropathy concurrent with mesangial expansion. Podocyte depletion has been confirmed in patients with either type 1 or type 2 DM by other investigators (116,118,159,160). Toyoda et al. (161) studied foot process detachment in patients with type 1 DM and found that 22% of GBM was not covered by intact foot processes in diabetic patients with proteinuria as compared to 11% in such patients with microalbuminuria and 4% of diabetics with normoalbuminuria. Weil et al. (159,160) using a more conservative technique found a smaller percentage of foot process detachment in type 2 diabetic patients, but the differences were significant between patients with proteinuria (1.48% detachment) and those with normoalbuminuria (0.41% detachment) or microalbuminuria (0.37% detachment). Such foot process detachment has been associated with glomerular sclerosis in a number of different glomerular lesions and may be important in the progression of diabetic nephropathy as well (161). Furthermore, the visceral epithelial cells play an important role in maintaining endothelial cells so that loss of podocytes may influence these cells as discussed below.
nephropathy concurrent with mesangial expansion. Podocyte depletion has been confirmed in patients with either type 1 or type 2 DM by other investigators (116,118,159,160). Toyoda et al. (161) studied foot process detachment in patients with type 1 DM and found that 22% of GBM was not covered by intact foot processes in diabetic patients with proteinuria as compared to 11% in such patients with microalbuminuria and 4% of diabetics with normoalbuminuria. Weil et al. (159,160) using a more conservative technique found a smaller percentage of foot process detachment in type 2 diabetic patients, but the differences were significant between patients with proteinuria (1.48% detachment) and those with normoalbuminuria (0.41% detachment) or microalbuminuria (0.37% detachment). Such foot process detachment has been associated with glomerular sclerosis in a number of different glomerular lesions and may be important in the progression of diabetic nephropathy as well (161). Furthermore, the visceral epithelial cells play an important role in maintaining endothelial cells so that loss of podocytes may influence these cells as discussed below.
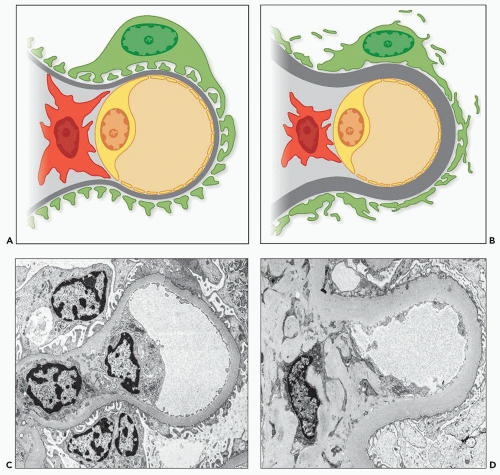 FIGURE 21.21 A: Drawing of normal capillary. B: Drawing of capillary with diabetic changes. C: EM of normal capillary. D: EM of capillary with diabetic changes. |
Endothelial cell changes have been largely overlooked in diabetic nephropathy until recently although endothelial dysfunction has been documented for years. Reduction in endothelial fenestration was first documented in the rat with alloxan-induced diabetes in 1980 (162). Similar studies were not undertaken in human patients with diabetes for more than
25 years. Toyoda et al. (161) in a study of patients with type 1 DM found that the fractional surface of fenestrated endothelium was reduced from 41% in controls to 25% in patients with proteinuria. Patients with normoalbuminuria or microalbuminuria showed 32% fractional surface of fenestrated endothelium. Weil et al. (159) found similar results in patients with type 2 DM. We now recognize that vascular endothelial growth factor (VEGF) secreted by the podocyte has an important role in control of endothelial structure (163). However, Weil’s study did not find any difference in the degree of fenestration near areas of foot process detachment (159). Satchell suggests several possible explanations, including the finding that actual detachment of foot processes was quite rare (164). Furthermore, he suggests that other factors such as the endothelial glycocalyx may play a role in glomerular permeability in this setting (164,165).
25 years. Toyoda et al. (161) in a study of patients with type 1 DM found that the fractional surface of fenestrated endothelium was reduced from 41% in controls to 25% in patients with proteinuria. Patients with normoalbuminuria or microalbuminuria showed 32% fractional surface of fenestrated endothelium. Weil et al. (159) found similar results in patients with type 2 DM. We now recognize that vascular endothelial growth factor (VEGF) secreted by the podocyte has an important role in control of endothelial structure (163). However, Weil’s study did not find any difference in the degree of fenestration near areas of foot process detachment (159). Satchell suggests several possible explanations, including the finding that actual detachment of foot processes was quite rare (164). Furthermore, he suggests that other factors such as the endothelial glycocalyx may play a role in glomerular permeability in this setting (164,165).
 FIGURE 21.22 Electron micrograph of a portion of a glomerulus showing marked attenuation of the basement membrane in a loop to the right with an abrupt transition as it reflects over the mesangium. This thinning of the GBM is associated with the formation of microaneurysms. (Uranyl acetate and lead citrate, ×9700.) |
The hyalinosis lesion occurs within capillary loops and appears on electron microscopy as an accumulation of homogeneous electron-dense material between the endothelial cell and the GBM. As more material collects, it fills the capillary lumen (Fig. 21.23). In obsolescent glomeruli, remains of the hyalinosis lesions formed earlier persist as denser areas within increased matrix and the GBM. Similar material may also be present within the mesangium (107,166). One must distinguish such hyalinosis accumulations from immune deposits, although this distinction may be difficult. This material is identical to that seen in the subintima of arterioles with hyaline arteriolosclerosis. Furthermore, the capsular drop is made up of similar material lying between the Bowman capsule and the parietal epithelium.
Mesangial widening and nodules are due to increased synthesis of mesangial matrix (149) and decreased degradation secondary to cross-linking of glycosylated collagens (167,168) (Fig. 21.24). Additional factors are considered in the section
on pathogenesis. Dachs et al. (169) noted that the first change consisted of widening of the usually delicate strands of mesangial matrix with increase of the numbers of mesangial cells. The number of mesangial cells and cellular processes may be slightly increased within the expanded mesangial matrix. These observations have been confirmed by morphometric analysis. Steffes et al. (170) showed increase in volume fraction of mesangial matrix per glomerulus and in mesangial cells per glomerulus in patients with type 1 diabetes compared with controls. The volume fraction of mesangium increases over the duration of the diabetes (147). Cell debris manifested as small calcific deposits, remnants of cell membranes, and scattered organelles are often present (166). On occasion, dense collections of fibrils measuring between 10 and 25 nm are present in the mesangium (171,172) (Fig. 21.25). The presence of such diabetic fibrillosis does not affect the course or prognosis (171,173). The fibrils can be distinguished from amyloid by their lack of staining by Congo red (172). Mesangiolysis has been described in association with the formation of microaneurysms (111,114). Some nodules develop loosening of the matrix, resulting in detachment of endothelial cells and loss of the anchoring points of the GBM to the mesangium (166). These alterations are thought to precede the exaggerated mesangial expansion of the single large nodules with laminated texture that are associated with microaneurysms (113).
on pathogenesis. Dachs et al. (169) noted that the first change consisted of widening of the usually delicate strands of mesangial matrix with increase of the numbers of mesangial cells. The number of mesangial cells and cellular processes may be slightly increased within the expanded mesangial matrix. These observations have been confirmed by morphometric analysis. Steffes et al. (170) showed increase in volume fraction of mesangial matrix per glomerulus and in mesangial cells per glomerulus in patients with type 1 diabetes compared with controls. The volume fraction of mesangium increases over the duration of the diabetes (147). Cell debris manifested as small calcific deposits, remnants of cell membranes, and scattered organelles are often present (166). On occasion, dense collections of fibrils measuring between 10 and 25 nm are present in the mesangium (171,172) (Fig. 21.25). The presence of such diabetic fibrillosis does not affect the course or prognosis (171,173). The fibrils can be distinguished from amyloid by their lack of staining by Congo red (172). Mesangiolysis has been described in association with the formation of microaneurysms (111,114). Some nodules develop loosening of the matrix, resulting in detachment of endothelial cells and loss of the anchoring points of the GBM to the mesangium (166). These alterations are thought to precede the exaggerated mesangial expansion of the single large nodules with laminated texture that are associated with microaneurysms (113).
 FIGURE 21.23 Electron micrograph of a portion of a glomerulus showing a hyalinosis lesion in a capillary loop and marked foot process effacement. (Uranyl acetate and lead citrate, ×4700.) |
 FIGURE 21.24 Electron micrograph of a Kimmelstiel-Wilson nodule showing increased matrix and relationship to capillary loops with thickened GBM and effacement of foot processes. (Uranyl acetate and lead citrate, ×3000.) |
The major component of the increased matrix is type IV collagen (155,156,174). Other components that are increased include type V and VI collagen, laminin, and fibronectin (175). Suzuki et al. (175) examined glomerular and interstitial expression of the mRNAs of metalloproteinase-3, tissue inhibitor of metalloproteinase-1, and type IV collagen in diabetic nephropathy. Expression of integrins is increased in all cell types in diabetic patients with moderate increase in the mesangial matrix (176). As the mesangial matrix increases to severe degrees, the expression of integrins increases in parallel in mesangial cells, whereas it remains the same in epithelial cells with decreased expression in endothelial cells.
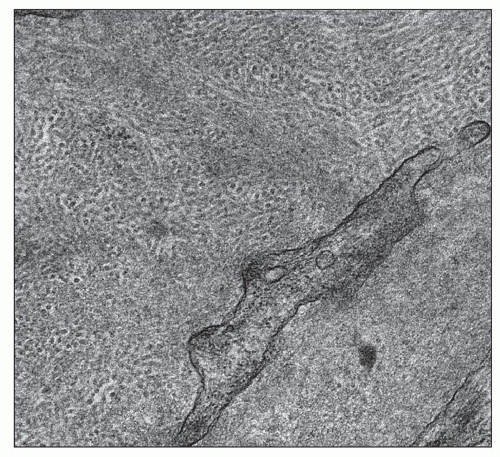 FIGURE 21.25 Electron micrograph showing typical appearance of diabetic fibrillosis characterized by densely packed collection of microfibrils. (Uranyl acetate and lead citrate, ×47,100.) |
Diabetic Nephropathy in Type 2 Diabetes Mellitus
The early studies in the morphologic changes in diabetic nephropathy were performed in patients with type 1 or in mixed populations. As the prevalence of type 2 diabetes has increased, more studies have been performed utilizing renal biopsies from patients with type 2 DM allowing the determination of any differences from the kidneys of patients with type 1 DM. In general, these studies showed many similarities with regard to the basic lesions of diabetic nephropathy, that is, diabetic nephropathy is characterized by increased GBM thickness, diffuse mesangial sclerosis with nodule formation, hyalinosis, microaneurysms, and hyaline arteriolosclerosis in both types of diabetes (177,178,179,180,181,182,183,184,185). However, several authors have suggested that the renal disease of patients with type 2 diabetes is more heterogeneous due to additional comorbidities such as cardiovascular disease, hypertension, aging, and other diseases (179,180,181,182,184,186). These investigators agree that many of these patients have typical diabetic lesions usually associated with other complications such as retinopathy. However, a subpopulation show only nondiabetic glomerular disease or alterations associated with vascular disease such as more severe interstitial fibrosis, glomerulosclerosis without prominent mesangial expansion, and arterio- and arteriolosclerosis (180,181,184).
Most patients with type 2 DM and renal disease show changes consistent with diabetic nephropathy with or without concurrent vascular disease (182,184,187). Schwartz et al. (184) examined 34 renal biopsies from patients with type 2 DM with proteinuria, renal insufficiency, and hypertension. Two had nondiabetic renal disease (one with IgA nephropathy,
the other membranous glomerulonephritis). Seventeen patients had typical nodular disease with Kimmelstiel-Wilson nodules, more marked GBM thickening, and more pronounced hyaline arteriolosclerosis. The remaining 15 patients had diffuse mesangial sclerosis consistent with diabetic nephropathy but did not have nodules. Mazzucco et al. (182) examined 393 renal biopsies from patients with type 2 DM in a multicenter study. They defined four classes of histologic findings. Class 1 was defined as typical diabetic nephropathy and was present in 40% of the biopsies. Within this group, 13% had predominantly nodular change, 34% had no nodules, and 53% showed a mixed nodular and diffuse pattern of mesangial expansion. Class 2 was characterized by ischemic changes with collapsed sclerotic glomeruli, tubular atrophy, and arterio- and arteriolosclerosis and was seen in 15% of the biopsies. Diabetic changes were not present in these cases. Class 3 was defined by the presence of another glomerular disease and was observed in 45% of the biopsies. Within this group, the glomerular disease was superimposed on diabetic changes in 38% of cases (class 3a). The remaining 62% did not have typical diabetic renal disease (class 3b).
the other membranous glomerulonephritis). Seventeen patients had typical nodular disease with Kimmelstiel-Wilson nodules, more marked GBM thickening, and more pronounced hyaline arteriolosclerosis. The remaining 15 patients had diffuse mesangial sclerosis consistent with diabetic nephropathy but did not have nodules. Mazzucco et al. (182) examined 393 renal biopsies from patients with type 2 DM in a multicenter study. They defined four classes of histologic findings. Class 1 was defined as typical diabetic nephropathy and was present in 40% of the biopsies. Within this group, 13% had predominantly nodular change, 34% had no nodules, and 53% showed a mixed nodular and diffuse pattern of mesangial expansion. Class 2 was characterized by ischemic changes with collapsed sclerotic glomeruli, tubular atrophy, and arterio- and arteriolosclerosis and was seen in 15% of the biopsies. Diabetic changes were not present in these cases. Class 3 was defined by the presence of another glomerular disease and was observed in 45% of the biopsies. Within this group, the glomerular disease was superimposed on diabetic changes in 38% of cases (class 3a). The remaining 62% did not have typical diabetic renal disease (class 3b).
The standard criteria used to determine the need for renal biopsy in patients with DM and evidence for renal disease include normal funduscopic findings, hematuria (without urologic etiology), rapid onset of acute renal insufficiency, and/or nephrotic syndrome within a short duration of the diabetes or in the presence of normal hemoglobin A1c. The study by Mazzucco et al. (182) cited above also examined the effects of using different criteria to determine need for biopsy. Approximately half of the biopsies were performed only if a disease other than diabetes was suspected. The other half was performed for proteinuria greater than 0.5 g/d with or without hematuria and/or altered renal function. The data from the group using more restricted criteria showed 29% with diabetic nephropathy only, 15% with vascular changes, and 56% for those with nonglomerular disease with or without diabetic changes. The results in the group using an unrestricted policy were 52%, 16%, and 32%, respectively, demonstrating a reversal of the diabetic versus nondiabetic disease with similar degree of vascular disease (182). In a recent Chinese study, more strict criteria were used for renal biopsy in type 2 diabetics resulting in 93.5% of patients with nondiabetic renal disease (186). A total of 18.5% of the patients had diabetic changes with or without other alterations.
Two groups of investigators have examined the role of the renal biopsy in predicting outcome in type 2 DM. Ruggenenti et al. (188) used the same three classes as defined above and devised a renal tissue injury score based on damage to all four compartments. They found that a combination of proteinuria and this injury index predicted progression to ESRD. Patients with proteinuria ≤2 g/24 hours or greater than 2 g/24 hours and a renal injury index less than seven never progressed to ESRD. However, all patients with proteinuria greater than 2 g/24 hours and an injury index of greater than 13 progressed to ESRD over a median of 1.6 years. Mazzucco et al. (189) using a similar renal injury index found comparable results.
Classification
A classification scheme has been developed recently, which may be applied to diabetic nephropathy in both types 1 and 2 DM (190). This consensus classification uses only glomerular lesions in order to make it easy to use and reproducible. Four classes are defined, one of which is subdivided. Class I shows mild or nonspecific changes with GBM thickening proven by electron microscopy. GBM thickening is defined as greater than 395 nm in females and greater than 430 nm in males older than 9 years of age when directly measuring the GBM (191). The definition of thickened GBM is 471 nm for women and 521 nm for men using the orthogonal intercept method (192). Class II shows mesangial expansion defined as greater than the width of two mesangial nuclei in two lobules in greater than 25% of glomeruli. This class is further subdivided into mild (less than the diameter of a capillary lumen) and severe (greater than the diameter of a capillary lumen). Class III is defined by the presence of at least one Kimmelstiel-Wilson nodule and less than 50% globally sclerotic glomeruli. Class IV demonstrates global sclerosis in greater than 50% of glomeruli in combination with lesions from the other three classes.
This proposed classification requires validation and evaluation to determine its usefulness. Two studies have applied it to biopsies from patients with type 2 DM (193,194). Oh et al. (193) examined 126 renal biopsies from patients with type 2 DM and proteinuria greater than 1 g/d, renal involvement without retinopathy, renal involvement within 5 years of diagnosis, or unexplained hematuria or azotemia. They split the biopsies into three groups with pure diabetic nephropathy (n = 50), nondiabetic renal disease (n = 65), and mixed (n = 11) and further analyzed the pure diabetic nephropathy group using the classification described above (190). They also used semiquantitative assessment of glomerular size, mesangial proliferation, mesangial matrix, interstitial fibrosis, arteriolar hyalinosis, and arteriosclerosis. At the end of a 5-year follow-up period, ESRD was present in no patients with class I or IIA changes, in 41.7% with class IIB, in 44.4% with class III, and 61.7% with class IV (193). The classification did correlate to urine protein to creatinine ratio and eGFR at the time of biopsy; however, this was due to the strong correlation to class IV to these factors as no differences were present with classes II and III. In fact, class IIb and class III showed similar clinical and pathologic features. Okada et al. (194) studied 69 patients with pure diabetic nephropathy and a mean follow-up of 59 months (range 6 to 180 months). They used the classification described above (190) for glomerular lesions and also assessed interstitial fibrosis and tubular atrophy (IFTA), interstitial inflammation, arteriolar hyalinosis, and arteriosclerosis (194). Using multivariate analysis, these authors found that IFTA were the only significant predictor of renal survival and not classification by glomerular lesions (194). Furthermore, no difference was found in the renal prognosis in a comparison between class IIA and IIB with class III.
Fioretto and Mauer (195) suggest that this classification is not yet ready for clinical use but that it does represent a first step in developing a useful scheme. They point out that its use in type 2 diabetes may not be possible for all cases in view of the variety of glomerular lesions seen in the biopsies from this population. This idea is supported by the fact that the papers cited above used the classification in type 2 diabetics but only evaluated biopsies with pure diabetic nephropathy, avoiding the issue of mixed lesions (193,194). Fioretto and Mauer suggest that addition of an evaluation of arteriolar hyalinosis might be useful as a means of distinguishing global glomerulosclerosis due to diabetes from that due to other forms of renal diseases first described by Harris et al. (196). They are also concerned about the use of mild increases in GBM thickness as a
defining feature of diabetic nephropathy and the use of a single Kimmelstiel-Wilson nodule to indicate a more severe lesion as such nodules may be present in the absence of clinical evidence of renal disease (195).
defining feature of diabetic nephropathy and the use of a single Kimmelstiel-Wilson nodule to indicate a more severe lesion as such nodules may be present in the absence of clinical evidence of renal disease (195).
Etiology and Pathogenesis
Hyperglycemia plays a central role in the pathogenesis of diabetic nephropathy by activating similar intracellular signaling events in all four compartments of the kidney. The initial manifestations of diabetic renal involvement can be ascribed to glomerular capillary dysfunction with hyperfiltration and microalbuminuria followed by development of further structural and functional abnormalities affecting the glomerular, tubulointerstitial, and vascular compartments. The cellular events induced by high glucose ambience include increased flux of polyols and hexoseamines, generation of AGEs and ROS, and activation of the PKC, transforming growth factor-β-Smadmitogenactivated protein kinase (TGF-β-Smad-MAPK), and Janus kinase-signal transducer and activator of transcription (JAK-STAT) pathways and of the G protein signaling pathway. These abnormalities along with aberrant expression of cyclin kinases, ECM proteins, metalloproteinases, and their inhibitors result in altered cell cycle and growth and subsequent accumulation of ECM proteins, a characteristic morphologic feature of diabetic nephropathy in humans. In addition to the biochemical events, mechanical injury mediated by increased glomerular intracapillary pressure due to impaired autoregulation of the local intrarenal renin-angiotensin-aldosterone system can further potentiate the injury. The following section integrates the foregoing physiologic and pathologic features of diabetic nephropathy with these factors to explain our current understanding of the pathogenesis more fully.
Hemodynamic Changes and Hyperfiltration
The prevalence of hyperfiltration in type 1 diabetes varies from less than 25% to more than 75%, while the corresponding figures for type 2 diabetes are significantly lower, ranging between 0% and more than 40% (197). Several factors, both biologic and methodologic, may contribute to the wide variation in hyperfiltration prevalence. That the GFR is increased early in the course of DM was first shown by Stalder and Schmidt in 1959 (198) and later confirmed by several studies. In 1971, Mogensen (199) showed a 40% increase in the GFR in 11 patients with new-onset diabetes when compared with age-matched controls. Insulin therapy tended to return these elevations in the GFR to normal. The four factors regulating GFR are renal plasma flow, oncotic pressure, transcapillary hydraulic pressure, and the glomerular ultrafiltration coefficient (Kf). There is compelling evidence indicating that hyperfiltration in diabetic patients is mediated by increases in glomerular plasma flow, transcapillary hydraulic pressure, and the glomerular Kf, which is the product of filtration surface area and glomerular capillary hydraulic permeability (200). A correlation exists between the degree of increase in the GFR and the filtration surface area of the glomeruli in diabetic patients (201). Increased glomerular intracapillary pressure may potentially accelerate the renovascular complications of diabetes via cross-talk between hemodynamic and metabolic factors in the diabetic environment (202).
Evidence that hyperfiltration is an important risk factor for subsequent increase in UAE and later development of diabetic nephropathy in patients with type 1 diabetes has been shown in several studies (203,204,205,206). Yip et al. (205) compared 25 patients with type 1 diabetes and hyperfiltration with a second group with a normal GFR for 10 years. The two groups had similar initial levels of blood pressure, UAE, and glycosylated hemoglobin. UAE at the end of the study was higher in the group with hyperfiltration, and it was an independent predictor of blood pressure at the end of the study. Rudberg et al. (206), in a study of adolescents with type 1 diabetes, showed similar results in which metabolic control of blood glucose was the most important factor in initiation of renal injury, followed by clinical duration of diabetes. In addition, systemic blood pressure was more important in progression than in the initiation of diabetic nephropathy. A meta-analysis of 10 type 1 diabetes studies concluded that the presence of hyperfiltration at baseline more than doubled the risk of developing micro- or macroalbuminuria at follow-up (207). However, two additional single-center studies addressing the relationship of hyperperfusion and albuminuria have arrived at different conclusions. The first study of 2318 adults with type 1 diabetes (208) showed no significant differences between the eGFR in patients with type 1 diabetes and normoalbuminuria from those expected in the general population. Furthermore, type 1 diabetic patients with a higher eGFR were also no more likely to develop microalbuminuria over a median of 5.2 years of follow-up than those with normal eGFR. Similarly, a second study of 426 normoalbuminuric patients with a follow-up of 5, 10, and 15 years reported that the risk of progression to microalbuminuria was not increased by hyperfiltration (209).
As mentioned earlier, the prevalence of glomerular hyperfiltration in patients with type 2 diabetes also varies widely (210,211,212,213,214,215,216,217), and its prognostic significance is not well defined (212,215,217,218). In studies of the natural history of diabetic nephropathy among the Pima Indians with type 2 diabetes, GFRs at baseline among those with normal glucose tolerance, impaired glucose tolerance, newly diagnosed diabetes, and diabetes of more than 5 years’ duration with microalbuminuria or macroalbuminuria were 123, 135, 143, 155, and 124 mL/min, respectively (215). During 4 years of follow-up, the GFR increased by 18% in the patients who initially had newly diagnosed diabetes; the rate declined by 3% in those with microalbuminuria at baseline and by 35% in those with macroalbuminuria. The authors concluded that GFR is elevated at the onset of type 2 diabetes, remains elevated while normal albumin excretion or microalbuminuria persists, and declines after the development of macroalbuminuria. Vedel et al. (212) studied the GFR in both normoalbuminuric (n = 39) and microalbuminuric (n = 158) patients with type 2 diabetes. The GFR in patients without microalbuminuria did not differ from that in controls. However, hyperfiltration defined as greater than 2 standard deviations above the mean GFR was identified in 37% of patients with microalbuminuria. Multiple regression analysis demonstrated correlations between the GFR and glycosylated hemoglobin, urinary sodium excretion, age, and known duration of diabetes in these patients. The authors of this study concluded that in patients with type 2 diabetes, glomerular hyperfiltration is a putative risk factor for progression. A recent study also showed that elevated GFR in patients with type 2 diabetes predicts its subsequent decline, which may occur without worsening of albuminuria (216). In contrast, another recent study by Magri and Fava (217) found
no association between hyperfiltration and albuminuria in patients with type 2 diabetes during the early stages of diabetic nephropathy. This study also showed that the decline of GFR and albuminuria followed a parallel course during the later stages of the disease raising the possibility that they share common pathophysiologic mechanisms. The beneficial effects of good metabolic control to reduce GFR toward normal levels within days to weeks have also been shown in several studies in both type 1 and type 2 diabetes (199,219). Some data seem to indicate strict control of blood glucose levels inhibits the progression of albuminuria; however, it does not offer any difference in clinical kidney disease outcome (220,221,222).
no association between hyperfiltration and albuminuria in patients with type 2 diabetes during the early stages of diabetic nephropathy. This study also showed that the decline of GFR and albuminuria followed a parallel course during the later stages of the disease raising the possibility that they share common pathophysiologic mechanisms. The beneficial effects of good metabolic control to reduce GFR toward normal levels within days to weeks have also been shown in several studies in both type 1 and type 2 diabetes (199,219). Some data seem to indicate strict control of blood glucose levels inhibits the progression of albuminuria; however, it does not offer any difference in clinical kidney disease outcome (220,221,222).
Although several studies support the notion of glomerular hyperfiltration being a potentially significant contributor to the pathogenesis and progression of diabetic nephropathy, some studies clearly indicate that hyperfiltration alone is not sufficient for the evolution of diabetic nephropathy. Schmitz et al. (223) examined kidney function in 29 patients with a single kidney. The three patients with type 1 diabetes had had a single kidney for 18 to 30 years. Two of the three patients had elevation in both the GFR and kidney size, but none had UAE greater than 20 mg/d. All three had normal blood pressure and serum creatinine levels. Thus, these three patients showed no ill effect from prolonged hyperfiltration, a finding suggesting that other factors must be present to produce glomerulosclerosis. Hyperfiltration is also influenced by protein intake, and restricting dietary protein has been shown to reduce glomerular hyperfiltration. Zeller et al. (224) found that dietary protein and phosphorus restriction resulted in a slowing of progression of renal disease independent of blood pressure and glycemic control that was comparable in the two experimental groups. However, whether amelioration of hyperfiltration in patients with early diabetic nephropathy is renoprotective is still uncertain (218).
The molecular mechanisms leading to hyperfiltration are complex, and many factors seem to have influence on its development. The concept of local intrarenal hypertension (i.e., intraglomerular hypertension) as a potential cause for hyperfiltration arose from micropuncture studies in diabetic rats (202). These rats disclosed intraglomerular hypertension despite having normal systemic blood pressure suggestive of impaired autoregulation due to differential dilation of the afferent and efferent arterioles (200). Such impaired autoregulation might be triggered by activation of the RAS with local production of angiotensin II (225). In support of this notion is the ability of mesangial cells as well as podocytes not only to synthesize angiotensin II but to express its receptors, which sets the stage for the regional activation of RAS (226,227). This may explain the success of inhibition of ACE in the treatment of diabetic nephropathy. Increased production of angiotensin II due to dysregulation of the regional RAS may also account for the hyperplasia and hypertrophy during the early and late stages of diabetic nephropathy via the up-regulation of various growth factors and cytokines such as TGF-β, connective tissue growth factor (CTGF), interleukin-6, monocyte chemoattractant protein-1 (MCP-1), and vascular endothelial growth factor-A (VEGF-A) (200,225). Hyperglycemia and increased production of ROS in the diabetic milieu could instigate regional RAS activation by up-regulating angiotensinogen and renin production in the mesangial cells (228,229,230). Sustained-stretch stress on the glomerular capillaries as well as mesangial cells due to increased intracapillary pressure caused by efferent arteriolar vasospasm may activate various signaling pathways with subsequent rise in blood pressure, mesangial cellular proliferation, ECM production, and decreased expression of the ECMdegrading enzymes (231,232,233,234). Mechanical stretch responses in the mesangial cells include induced expression of TGF-β and its receptor, activation of PKC and p38/MAPK, induction of MCP-1 with up-regulation of intercellular adhesion molecule-1, and the generation of ROS (235,236). Glomerular capillary stretch stress also induces VEGF-A expression by the podocytes (121,237), leading to down-regulation of α3β1 integrin and nephrin with detachment from the underlying basement membrane and ensuing proteinuria (121,238,239).
There is also evidence indicating that insulin-like growth factor (IGF-I) plays an important role in the early renal growth in diabetes (240,241,242,243) and that hyperfiltration may, at least in part, be mediated by IGF-I (244). Growth hormone and glucagon, both with well-known influence on GFR, are increased in diabetic patients (245,246). Reduction of serum glucose levels is accompanied by diminished levels of glucagon and growth hormone with continuous infusion of insulin by pump. These reductions are correlated with decrease in the GFR (247). The GFR is also affected by parathyroid hormone, vasopressin, eicosanoids, and angiotensin II (248,249). Esmatjes et al. (250) compared the GFR and urinary prostaglandin excretion in 21 patients with recent-onset type 1 diabetes and 15 controls. These investigators confirmed the findings of earlier studies of increased GFR and renal plasma flow. When they administered lysine acetylsalicylate, a prostaglandin synthetase inhibitor, they found a reduction in both the GFR and renal plasma flow that did not occur in the control group. These investigators suggested that this finding supported the idea that the increase in the GFR often seen in diabetic patients is due at least in part to mediation by prostaglandins. A specific role of cyclooxygenase (COX)-2 in glomerular hyperfiltration has also been demonstrated. A study by Cherney et al. (251) evaluated the effects of COX-2 inhibition on renal function in normotensive and normoalbuminuric patients with uncomplicated type 1 diabetes. In patients with hyperfiltration, COX-2 inhibition partially blunted the hyperfiltration, while patients with normal GFR exhibited an increase in GFR under these conditions. These findings were interpreted as an indication that hyperfiltration and normofiltration are distinct physiologic states. Another study by the same group of investigators showed that the dependence on vasodilator prostaglandins in type 1 diabetes is greater in women than in men (252). This finding is consistent with recent evidence that sex hormones may contribute to the pathogenesis of diabetic nephropathy (253). Other substances that have been implicated in increasing GFR in diabetes include kinins (254), atrial natriuretic peptide, hyperglycemia, and other factors in the abnormal metabolic environment (211). Nugent et al. (255) showed a loss of autoregulation in response to endothelin in diabetic patients. This alteration could make these patients more susceptible to hyperfiltration in response to alterations in glomerular hemodynamics.
Glomerular hypertrophy and hyperfiltration have also been observed in STZ-induced diabetes in experimental animals along with glomerular hyperperfusion, increased glomerular capillary hydrostatic pressure, unchanged systemic oncotic pressure, and unchanged or slightly elevated ultrafiltration coefficient (Kf) (256,257,258). Rats made diabetic with STZ
and partially treated with insulin to maintain moderate levels of hyperglycemia develop increased whole-kidney and single-nephron GFR (256). The increment in single-nephron GFR is due to increases in transcapillary hydraulic pressure difference and initial glomerular plasma flow rate (256). When glomerular pressure is lowered by the use of ACE inhibitors, glomerular injury is decreased in this model (259,260), a finding suggesting a role for increased glomerular pressure in this form of injury. ACE inhibitors also reduce the morphologic alterations seen in this model (261). Treatment with insulin normalized glomerular pressure and renal hypertrophy (262,263). However, Bank et al. (264) showed that increased glomerular pressure alone is not sufficient to cause glomerular lesions in diabetic rats. Some of the glomerular hemodynamic changes have been attributed to the effects of diabetes on afferent arteriolar resistance resulting in vasodilation. However, the precise mechanisms for the changes in glomerular hemodynamics remain undefined. Reports on nitric oxide (NO) as a potential mediator of vasodilation and hyperfiltration in diabetes are conflicting (265,266,267). Additional suggested mechanisms include increase in glomerular synthesis of prostaglandins (268,269), alterations in the intrarenal renin-angiotensin axis (270), changes in the polyol pathway (271), diminished bioavailability of proinsulin connecting peptide (C-peptide) (272), open KATP channels affecting preglomerular microvascular smooth muscle function (273), altered tubuloglomerular feedback (274,275), and increased production of IGF-1 (258). Hypertrophy and hyperfiltration are reduced in STZ-induced diabetes via modulation of IGF-1 bioactivity by inhibiting nitric oxide synthase supporting the role of IGF-1 mediating hyperfiltration (258). Some data also suggest that these events might be further modulated by proinflammatory mediators and cytokines (276).
and partially treated with insulin to maintain moderate levels of hyperglycemia develop increased whole-kidney and single-nephron GFR (256). The increment in single-nephron GFR is due to increases in transcapillary hydraulic pressure difference and initial glomerular plasma flow rate (256). When glomerular pressure is lowered by the use of ACE inhibitors, glomerular injury is decreased in this model (259,260), a finding suggesting a role for increased glomerular pressure in this form of injury. ACE inhibitors also reduce the morphologic alterations seen in this model (261). Treatment with insulin normalized glomerular pressure and renal hypertrophy (262,263). However, Bank et al. (264) showed that increased glomerular pressure alone is not sufficient to cause glomerular lesions in diabetic rats. Some of the glomerular hemodynamic changes have been attributed to the effects of diabetes on afferent arteriolar resistance resulting in vasodilation. However, the precise mechanisms for the changes in glomerular hemodynamics remain undefined. Reports on nitric oxide (NO) as a potential mediator of vasodilation and hyperfiltration in diabetes are conflicting (265,266,267). Additional suggested mechanisms include increase in glomerular synthesis of prostaglandins (268,269), alterations in the intrarenal renin-angiotensin axis (270), changes in the polyol pathway (271), diminished bioavailability of proinsulin connecting peptide (C-peptide) (272), open KATP channels affecting preglomerular microvascular smooth muscle function (273), altered tubuloglomerular feedback (274,275), and increased production of IGF-1 (258). Hypertrophy and hyperfiltration are reduced in STZ-induced diabetes via modulation of IGF-1 bioactivity by inhibiting nitric oxide synthase supporting the role of IGF-1 mediating hyperfiltration (258). Some data also suggest that these events might be further modulated by proinflammatory mediators and cytokines (276).
Related posts:
 Development of the Kidney
 Membranous Glomerulonephritis
 IgA Nephropathy and IgA Vasculitis (Henoch-Schönlein Purpura) Nephritis
 Renal Involvement in Polyarteritis Nodosa, Kawasaki Disease, Takayasu Arteritis, and Giant Cell Arteritis
 Glomerular Diseases With Organized Deposits
 Pyelonephritis and Other Direct Renal Infections, Reflux Nephropathy, Hydronephrosis, Hypercalcemia, and Nephrolithiasis
Stay updated, free articles. Join our Telegram channel

Full access? Get Clinical Tree


