Peritoneal Dialysis


Peritoneal Dialysis


Seth Furgeson

Rajnish Mehrotra

John M. Burkart

Isaac Teitelbaum


Since the first description of continuous ambulatory peritoneal dialysis (CAPD) in 1976, peritoneal dialysis (PD) has become the dominant modality for home dialysis across the globe. Over the last decade, the patterns of utilization rates for PD have changed. Although the proportion of end-stage renal disease (ESRD) patients treated with PD remains low in many Western countries, as well as developing countries in the Middle East and South Asia, the utilization rates are increasing in several Eastern European, South Pacific, and East Asian countries.1,2 In the United States, the percentage of dialysis patients on PD has decreased over the past decade with a slight increase in 2008; during that year, fewer than 7% of dialysis patients received PD.3 Lack of adequate patient and physician education regarding PD likely contributes to this pattern of underutilization.4 Given the absence of a randomized, controlled clinical trial comparing PD and conventional hemodialysis (HD), observational studies comparing incident PD and HD patients provide the best comparisons of the two modalities. Based on these studies, a few key observations can be made. First, patients commencing treatment with PD are younger and have a lower comorbidity burden than those that are treated with HD.5 Second, there appears to be a modality by time interaction, such that patients commencing PD have a higher probability of survival during the first 2 to 3 years of renal replacement therapy when compared to HD patients; this advantage diminishes over time.6,7,8 Third, the relative outcomes of patients treated by HD or PD seem to be modified by their age and diabetic status and the presence or absence of comorbidities. Thus, among individuals with no baseline comorbidity, treatment with PD appears to be associated with a survival advantage among nondiabetic patients (all age groups) and young diabetic patients (age <45 years).9,10 It remains unclear if these differences in survival reflect a “modality effect” or are due to selection bias undescribed by known comorbidities. Nonetheless, PD treatment is used by thousands of patients around the world and appears poised to remain an important modality for renal replacement therapy. Furthermore, virtually all studies of contemporary cohorts of dialysis patients have demonstrated a similar overall survival from different parts of the world with different levels of PD utilization.6,9,11,12

Space precludes us from describing an extensive physiologic basis for PD. We discuss the current major issues of concern for PD in this chapter—the definition of “adequate” therapy and the control or management of therapy-related complications.


PERITONEAL DIALYSIS MODALITIES

PD may be performed manually and/or with the assistance of an automated device, commonly referred to as a “cycler.” Similarly, PD therapy may be either continuous or intermittent. In most patients, selection of the PD modality hinges upon which therapy better suits the patient’s lifestyle. However, in the absence of residual renal function, it is probably always desirable to use a continuous therapy.


Peritoneal Dialysis Techniques: Continuous Therapies


Continuous Ambulatory Peritoneal Dialysis

Until recently, CAPD was the most commonly used form of PD. Since its original description, there have been few changes in the basic therapy, although there have been many changes in the connection devices or “connectology” used to make the exchange. CAPD is a manual therapy and usually uses less dialysate than automated PD. The usual dialysis prescription for patients on this technique is four exchanges per day using 2.0 to 2.5 L of dialysate. However, in many developing countries, patients are treated using three exchanges with lower fill volumes with similar results. The equivalent results despite a lower dialysate use may, in part, be secondary to smaller body size in these countries.


Continuous-Cycling Peritoneal Dialysis

The utilization of automated peritoneal dialysis (APD), of which continuous-cycling peritoneal dialysis (CCPD) is the most common, is rapidly increasing in many parts of the world, like the United States.3 Most often, patients
undergoing CCPD use an automated cycler to perform exchanges while they sleep with a subsequent “last fill” and single daytime dwell until the following evening; therefore, this is a continuous therapy. Some patients also require a daytime exchange, either to maximize solute clearances or to enhance fluid removal. Although it may be done manually, this exchange is more commonly performed using the cycler as a “docking” station for drain of the last fill instilled in the morning and subsequent instillation of fresh dialysis fluid. APD performed in this fashion is commonly referred to as CCPD with a midday exchange or as “high-dose” CCPD (a misnomer, as the volume of fluid used may well be less than that used by another patient performing “low” dose CCPD).


Peritoneal Dialysis Techniques: Intermittent Therapies

Because intermittent therapies typically use multiple short dwells, they tend to be automated, although they can be done manually. Intermittent PD (IPD) therapies are best suited for patients who are found to be high transporters based on the peritoneal equilibration test (PET). However, they should rarely be used once the patient loses residual renal function. These therapies also may be transiently indicated during peritonitis for some patients experiencing problems with ultrafiltration, or if PD therapy needs to be initiated within 2 weeks of implantation of the PD catheter (early “break-in”).


Intermittent Peritoneal Dialysis

By definition, IPD implies that therapy periods alternate with periods when the peritoneum has been drained (“dry abdomen”). As classically performed the patient uses multiple short-dwell exchanges three or four times a week. Techniques include manual IPD, cycler IPD, reverse osmosis machine IPD, intermittent reciprocating dialysis with an extracorporeal reconstituting circuit, and others. In recognition of the importance of small and possibly middle-molecule clearances, IPD is now rarely used.

Nonetheless, classic IPD therapies continue to have their uses. Cycler IPD has been used in areas where technical, social, and economic limitations restrict the use of CAPD. Cycler IPD has been used immediately after abdominal surgery, for elderly patients, patients with refractory heart failure, or for those who are on CAPD and have developed hernias or leaks.13


Nightly Intermittent Peritoneal Dialysis

Nightly IPD (NIPD) utilizes a cycler overnight with a subsequent dry day. It is best employed by patients who still have residual renal function regardless of their transport type. Daytime ambulatory peritoneal dialysis (DAPD) is based on the same concept as NIPD, but DAPD is a manual technique, and the patient typically has a “dry time” during the night. The lower the peritoneal membrane transfer rates, the lower the 8-hour NIPD or DAPD clearances, and, in some patients, time spent on NIPD or DAPD has to be prolonged by 10% to 40% to achieve minimal target clearances.16,17 Like IPD, NIPD can be used for management of patients with heart failure, as transient therapy for postoperative patients, or patients treated with CAPD or CCPD, who have developed hernias or leaks,18 or for women with rectal or vaginal prolapse.


Tidal Peritoneal Dialysis

Tidal peritoneal dialysis (TPD) is best performed nightly by the use of an automated cycler. It involves the maintenance of an intraperitoneal reservoir of dialysate, which is achieved by incomplete drainage of the fluid at the end of each dwell. Additional amounts of fluid are instilled with each exchange to maintain an optimal intraperitoneal volume. By maintaining an intraperitoneal reservoir of dialysate, it is assumed that tidal dialysis may maintain more continuous contact of dialysate with the peritoneal membrane. Furthermore, the more rapid cycling of dialysis may increase mixing and prevent formation of stagnant intraperitoneal fluid layers. Although preliminary studies suggested that small solute clearances are augmented14,15 subsequent studies have failed to confirm the ability of TPD to enhance clearances.16,17,18 TPD is useful, however, for patients who have pain with either infusion or draining; the reservoir of dialysate minimizes pain during drainage and upon instillation of fresh dialysate.19 In prescribing tidal peritoneal dialysis, variables to be chosen include reserve volume, tidal outflow volume, tidal replacement volume, flow rates, and frequency of the exchanges. Although TPD may have clinical benefits, the treatment cost will be increased due to the additional dialysate fluid.


DEFINING ADEQUACY OF DIALYSIS USING SMALL SOLUTE CLEARANCES


Minimal Versus Optimal Dialysis

The native kidneys perform excretory and endocrine functions and are pivotal in the maintenance of euvolemia. The loss of these functions in patients with progressive renal failure results in numerous metabolic and vascular abnormalities. In order to return the individual to complete health, some of the goals of optimal renal replacement therapy are summarized in Table 83.1. The concept of “optimal” renal replacement therapy, as applied to dialytic therapies, entails that the amount of dialysis delivered is not the rate-limiting step that determines patient outcome. In other words, an “optimal” dialysis prescription eliminates uremia as a potential variable, allows patients to achieve euvolemia, and maximizes quality of life. Given the continuing high risk for morbidity and mortality and poor rehabilitation among the ESRD population, it is clear that the current renal replacement therapies are far from achieving the goal of “optimal” therapy.20 One of the reasons for this may be that, for a large number of solutes, the dialytic clearances typically replace <10% of the native renal excretory function (Table 83.2).21 Based on these considerations and the current state of knowledge relating small solute clearances to outcome, it is more reasonable to define clearance goals of dialytic therapy in terms of “minimal acceptable,” rather than “optimal,” dialysis.


TABLE 83.1 Goals of End-Stage Renal Disease Replacement Therapy


Improve duration and quality of life


Reverse uremic signs and symptoms


Control acid-base abnormalities


Improve dyslipidemia and cardiovascular risk


Stabilize nutritional status


Remove small and middle sized uremic toxins


Improve abnormalities in mineral and bone metabolism


Minimize patient inconvenience factors


Control blood pressure and maintain euvolemia


TABLE 83.2 Solute Removal by Dialysis and the Natural Kidney


Solute Clearance


Natural Kidney


HD Low Flux


HD High Flux


CAPD


Urea (L/wk)


750


130


130


70


Vitamin B12 (L/wk)


1,200


30


60


40


Inulin (L/wk)


1,200


10


40


20


B2-microglobulin (mg/wk)


1,000


0


300


250


HD, hemodialysis; CAPD, continuous ambulatory peritoneal dialysis.


Modified from Keshaviah P. Adequacy of CAPD: a quantitative approach. Kidney Int Suppl. 1992;38:S160.


After the widespread introduction of hemodialysis, studies of patients undergoing HD attempted to define a “dose” of hemodialysis sufficient to prevent malnutrition, uremia, and premature death. Based on the initial results and subsequent reanalysis of the National Cooperative Dialysis Study, the concept of urea kinetic modeling was developed to monitor the dose of HD.22,23 Shortly thereafter, the concept of monitoring the dose of dialysis using urea (and, subsequently, creatinine) kinetic modeling was extended to patients undergoing PD. Thus, over the last two decades, the adequacy of dialysis dose has been based on an assessment of achieved clearances of small solutes.

However, as is clear from Table 83.2, small-solute clearance is substantially lower for PD than HD. Yet, as discussed in the preceding section, the overall outcome is similar between HD and PD patients. It is also clear from Table 83.2 that solute clearances in CAPD exceed those of standard HD for all but the small-molecular-weight solutes. Is the reason that survival rates on CAPD and HD are similar because of comparable “middle-molecule” clearance? Should middle-molecule clearance be measured as the “PD yardstick?” At this time, there are no interventional studies to support such a change in the “PD yardstick.” However, it is important to note that strategies that maximize small-solute clearances do not necessarily enhance the clearance of larger-molecular-weight toxins as clearance of the latter is time-dependent (Fig. 83.1).24


Small-Solute Clearances and Mortality

Dialysis dose among patients undergoing PD had historically been measured using both urea and creatinine clearances; however, as renal creatinine clearance in ESRD patients is largely a function of creatinine secretion, urea clearance alone is now more commonly used. Because the urea clearance is expressed as a sum of renal and peritoneal clearance, studies evaluating mortality risk and dialysis dose must clearly differentiate between renal and peritoneal Kt/V. Most large, observational studies examining mortality demonstrated that although renal urea clearance is strongly associated with a variety of patient outcomes, peritoneal clearances within the range achieved in clinical practice is substantially less so.25,26,27,28,29,30,31,32,33,34,35 Furthermore, two randomized, controlled, clinical trials36,37 have now provided the final confirmatory evidence that increases in peritoneal
clearance, within the range achieved in clinical practice, do not result in significant improvement in patient morbidity or mortality (Table 83.3).52,53 This accumulating body of data should not be taken to mean that peritoneal clearances are biologically irrelevant or that providing peritoneal clearances do not have a survival benefit—an anuric patient would die in the absence of peritoneal clearances. However, these data clearly suggest that within the range of clearances currently achieved in clinical practice, higher peritoneal clearances are unlikely to result in significant improvement in patient survival.


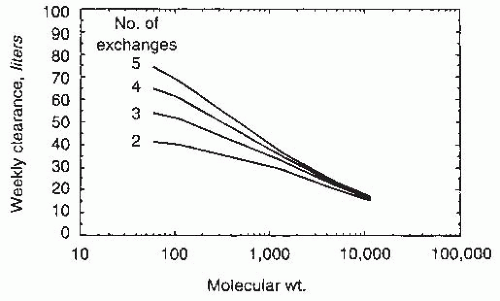
FIGURE 83.1 The influence of the number of exchanges on the weekly solute clearance for solutes with a range of molecular weights derived from a computerized model of peritoneal transport. (From Keshaviah P. Adequacy of CAPD: a quantitative approach. Kidney Int Suppl. 1992;38:S160, with permission.)


Small-Solute Clearances and Morbidity

ESRD patients suffer considerable morbidity, have impairments in the quality of life, and patients treated with PD continue to have a high rate of transfer off the therapy (“technique failure”). In observational studies, it appears that a low level of small solute clearance is associated with morbid outcome.28,30,35 Two of the three randomized, controlled trials were unable to demonstrate any beneficial effect of increasing peritoneal clearances on the risk for hospitalization or the number of hospital days or technique survival (Table 83.3).36,37 In the study by Mak et al., the intervention group had a higher hospitalization rate at the time of entry into the study when compared to the control group. Upon follow-up over 12 months, the hospitalization rate remained unchanged in the intervention group but increased in the control group, such that there were no significant differences in the hospitalization rates between the two groups over the study period.38

Furthermore, observational studies have been unable to demonstrate any relationship between small-solute clearances and the quality of life of PD patients.39,40 These findings have now been confirmed by ADEMEX—a randomized, controlled, clinical trial.41

Thus, the existing body of evidence suggests that within the range of clearances currently achieved in clinical practice, higher peritoneal clearances are unlikely to result in significant improvements in hospitalization rate, technique failure, or quality of life of PD patients.


Small-Solute Clearances, Nutritional Status, and Patient Outcome

Due to the high prevalence of protein-energy wasting (PEW) in PD patients and the deleterious long-term consequences of wasting, the impact of small solute clearance on the nutritional status of PD patients has been an actively studied area. As with HD patients, in PD patients there are multiple, imperfect clinical measures of PEW as well as difficult-toobtain research techniques. Importantly, there is poor correlation amongst the different measurements.42,43,44 Low serum albumin and prealbumin levels, poor subjective global assessment (SGA), low fat-free edema-free mass, low dietary protein intake, and diminished hand grip strength are associated with higher morbidity and mortality.42,43,45,46,47,48,49 Notwithstanding the evidence that the etiology of nutritional decline among ESRD patients is multifactorial (including an important role of inflammation), inadequate dietary intakes are probably important and independent contributors to the high prevalence of PEW among the dialysis population.50 It follows, then, that if enhancing the dose of dialysis can result in an increase in dietary intakes, the higher dose would have the potential of improving their nutritional status; this, in turn, would be expected to have a salutary effect on patient outcome.

Based on multiple, small studies, there is evidence that increasing dialysis dose can improve nutritional status. Studies that show a relationship between Kt/Vurea and nPNA (normalized protein equivalent of nitrogen appearance) are problematic since both equations share common variables.51,52 However, enhanced solute removal has been associated with improvement in other nutritional parameters: protein intake (as measured by dietary records,53,54 mid-arm circumference and weight gain,55 SGA,53 and albumin56). Given data that a factor in uremic serum can induce anorexia in rats, it is plausible that dialytic removal of such a factor would increase appetite.57 However, notwithstanding the increase in dietary protein intake, recent randomized controlled trials have been unable to demonstrate an improvement in nutritional status with increasing peritoneal clearances (Table 83.3).37,38


Minimal Total Solute Clearance Goals

Several organizations around the world have developed clinical practice guidelines to define the target level of small-solute clearances required to optimize the health of patients undergoing PD. As would be expected, these guidelines have evolved with our understanding (as discussed previously), particularly with the availability of the results of two large randomized controlled clinical trials.37,38 The updated guidelines by organizations in United States, Canada, and Europe are summarized in Table 83.4.58,59,60,61,62 When compared to guidelines published earlier, the current recommendations differ in several important respects. First, most of the guidelines recommend only one measure of adequacy to define the minimum dose of dialysis (Kt/Vurea). Early studies, including the CANUSA study, suggested that patient outcome was more dependent upon total (renal + peritoneal) creatinine clearances rather than total urea clearances.63 However, the contribution of renal creatinine clearance to total (renal + peritoneal) creatinine clearances is substantially greater than of native renal urea clearances. Because creatinine is secreted and urea is reabsorbed by renal tubules, renal creatinine clearance is always higher than renal urea clearance; on the other hand, peritoneal clearances are dependent on the molecular weight of the solute in question. Thus, creatinine clearance (molecular weight, 113) is always lower than peritoneal urea clearance (molecular weight, 60). Consequently, the expected weekly creatinine clearance is different in a patient who is just starting PD with a residual renal Kt/Vurea of 2.0 per week than in an anuric patient with a peritoneal Kt/Vurea of 2.0 per week. Thus, although both markers of solute clearance may be predictors of outcome, the target or goal for creatinine clearance may have to change over time as residual renal function decreases and is replaced by peritoneal clearance.
On the other hand, it appears from outcome studies that the Kt/Vurea target may not need to change. Furthermore, it is now recognized that the stronger relationship of creatinine clearances to patient outcome was a result of the effect of the confounding effect of residual renal function. There is no evidence that peritoneal creatinine clearances are superior in predicting outcome, when compared to peritoneal urea clearance. In light of these considerations, the various expert groups recommend the use of Kt/Vurea alone to determine the dose of dialysis (Table 83.4). Second, the targets for Kt/Vurea have been changed, such that Kt/Vurea of 1.7 at all times is now considered to be the minimum dose necessary needed for patient well-being. Based on the results of the two recent randomized controlled trials, it is also recognized that some patients may require a higher dose of dialysis to manage uremic symptoms or to achieve euvolemia.36,37 Third, except in the CARI guidelines, there are no differences in the definition of minimum dose of dialysis based upon the patients’ transport type (see below). Fourth, some expert groups (Europe and Australia) have defined the adequacy of dialysis based only on peritoneal clearances, whereas others (Canada and the United States) define it based upon total clearances. Fifth, the targets are the same, irrespective of PD modality (CAPD or APD). Finally, volume control is recognized as an additional dimension to define adequate dialysis (see below).


TABLE 83.3 Summary of Randomized, Controlled Clinical Trials That Have Evaluated the Effect of Increasing Dialytic Clearances on Outcome among Patients Undergoing Peritoneal Dialysis


Mean Achieved Clearancesb


Author


Patient Number


Follow-up (months)


Patient Typea


Peritoneal Kt/Vurea


Total Kt/ Vurea


Peritoneal CrCl


Total CrCl


Key Results


Mak38


66


12


I


1.56 1.92


1.92 2.02


1.67 54.6


54.6 61.9


Higher clearances associated with higher dietary protein intakes. No effect of increased clearances on serum albumin, hospitalization rates, or infectious complications


Paniagua36,41


965


22


I + P


1.62 2.13


1.80 2.27


46.1 56.9


54.1 62.9


No effect of increased clearances on patient or technique survival, serum albumin, hospitalizations, infectious complications, or quality of life. More patients in the control group died from congestive heart failure or uremia/ hyperkalemia/acidosis.


Lo37


320


24


Ic


1.5-1.7 1.7-.0 >2.0


No effect of increased clearances on patient survival, nutritional status, or hospitalizations. Higher incidence of anemia and higher Epo requirements in the group with the lowest clearances.


a Patient type: I, incident; P, prevalent; I + P, incident and prevalent.

b For each study, the first line refers to the clearances in the control group and the second line refers to the clearances in the intervention group.

c Only those incident patients with renal Kt/Vurea <1.0 were eligible to participate.


CrCl, creatinine clearance.


TABLE 83.4 Targets for Small Solute Clearances Recommended by Various Organizations for Patients Undergoing Chronic Peritoneal Dialysis


Committee


Nature of Clearances


Kt/V


Creatinine Clearance


United States—NKF-K/DOQIa


Renal + peritoneal


1.7


European Best Practice Guidelines


Peritoneal


1.7


Canadian Society of Nephrology


Renal + peritoneal


1.7a


International Society of Peritoneal Dialysis


Renal + peritoneal


1.7


CARI (Australia)


Renal


>1.6


> 60 L/week (high and high-average transporters)


> 50 L/week (low and low-average transporters)


a For patients with residual renal function >4 mL/min, a peritoneal Kt/V between 1.0 and 1.7 is recommended.


NKF-K/DOQI, National Kidney Foundation’s Kidney Disease Outcome Quality Initiative.


MONITORING AND ADJUSTING SMALL-SOLUTE CLEARANCES


Determination of Peritoneal Transport

In its function as a dialysis membrane, the peritoneum performs two important processes: diffusion (movement of solute down a concentration gradient) and convection (movement of solute along with water, ultrafiltration [UF]). There is interpatient variation in peritoneal membrane transport characteristics. A variety of methods have been suggested, standardized, and studied to assess the peritoneal membrane function (Table 83.5).64,65,66,67,68 The most precise method to evaluate diffusive function of the peritoneum is to determine the mass transfer area coefficients (MTAC) of solutes like creatinine.69 These define transport independent of ultrafiltration (convection-related solute removal) and, consequently, are not influenced by dwell volume or glucose concentration. In order to determine the MTAC, additional laboratory measurements and computer models are necessary, but, once these are obtained, MTAC can be used easily in the clinical setting.67,69,70

However, of these various assessments of membrane transport characteristics, the peritoneal equilibration test (PET) is the most widely used.65 All patients commencing PD therapy should undergo a PET. The first PET should be performed after at least 4 weeks of commencing peritoneal dialysis therapy.71 Although some centers choose to repeat a PET only if clinically indicated, others perform the test periodically to monitor peritoneal membrane function.

In order to enhance the reproducibility of the test, several steps of the PET are standardized: (1) long (8 to 12 hours) preceding exchange; (2) drain the preceding exchange as completely as possible over 20 minutes; (3) infuse 2 L of 2.5% dextrose dialysate over 10 minutes (time 0); (4) take samples of dialysate of times 0, 120, and 240 minutes; (5) in order to take samples, 200 mL of dialysate is drained into a bag, 10 mL is drawn for testing, and 190 mL is reinfused; (6) a blood sample is taken at 120 minutes; and (7) the dialysate is drained completely at 240 minutes and the drain volume is measured. Dialysate and serum urea, glucose, and creatinine
are measured. For each dwell time (0, 120, and 240 minutes), dialysate to plasma ratios (D/P) of creatinine and urea are determined, as is the ratio of glucose at the drain time (120 and 240 minutes) to the initial dialysate glucose concentration (D/ D0). These results are plotted against time and compared to known standard curves (Fig. 83.2). Based on the values of D/P creatinine or D/D0 glucose, patients are classified into one of four categories: low, low average, high average, and high transporters. It should be noted that there is a significant discordance between the categorization of patients’ transport type, based upon whether D/P creatinine or D/D0 glucose is used (Fig. 83.3).72 Studies suggest that abbreviating the preceding exchange to 2 to 3 hours does not significantly influence the values of D/P creatinine or D/D0 glucose; thus, patients being treated with APD do not have to change their treatment schedule on the day prior to the PET.73,74


TABLE 83.5 Tests to Evaluate Peritoneal Membrane Function


Test


Parameter Used to Evaluate Solute Removal Function


Parameter Used to Evaluate Fluid Removal Function


Peritoneal equilibration test (4-hour)


D/P creatinine, D/Do glucose


Drain volume


Dialysis adequacy and transport test (24-hour)


D/P creatinine


Drain volume


Standard peritoneal analysis


MTAC creatinine


Drain volume, D/P sodium, and others


Personal dialysis capacity


Area parameter


Ultrafiltration coefficient


Apex


Purification phosphate time


Apex time


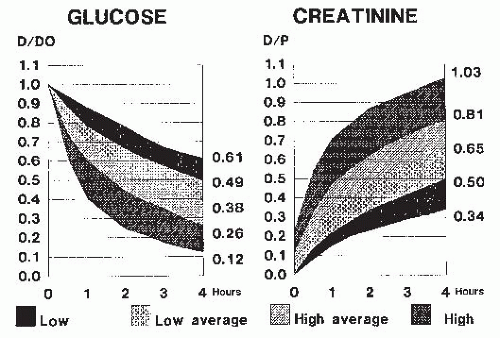
FIGURE 83.2 Dialysate to plasma ratios (D/P) for creatinine and drain time to initial dialysis concentration (D/D0) ratios for glucose, generated from standard peritoneal equilibration testing. (From Twardowski ZJ. Clinical value of standardized equilibrium tests in CAPD patients. Blood Purif. 1989;7:95, with permission.)

As more has become known about ultrafiltration and water transport across the peritoneal membrane, it has been recommended that a 4.25% dextrose PET be used to characterize the ultrafiltration capacity of the peritoneum, including aquaporin-mediated water transport and solute transport.75 The 4.25% PET has been compared to the 2.5% PET in a cohort of chronic PD patients and no clinically relevant difference in classifying the patients into different transport types was noted, suggesting that the 4.25% PET may be as clinically useful in prescription management as is the 2.5% PET.76 The 4.25% PET has the added advantage of directly assessing the adequacy of ultrafiltration as well; ultrafiltration is defined as failure of a 4-hour dwell with 4.25% dextrose to yield at least 400 mL of net ultrafiltration.75


Clinical Relevance of Characterizing Peritoneal Membrane Function

The PET is used specifically to characterize the patient’s peritoneal membrane transport properties. Knowledge of the peritoneal transport allows a physician to choose an appropriate prescription for a patient; this is particularly useful when using computerized, kinetic modeling for prescription management.

In general, rapid transporters of creatinine and urea also tend to be rapid absorbers of dialysate glucose (high D/P creatinine and low D/D0 glucose). Therefore, although the D/P creatinine ratios for a 4-hour dwell tend to be close to 1, drain volumes tend to be small. Rapid transporters maximize their D/P ratios and intraperitoneal volumes early during the dwell. Once the osmotic gradient dissipates, UF ceases, followed thereafter by net fluid reabsorption. With standard CAPD, these patients may have drain volumes that are actually less than instilled volumes. Short dwell times often are needed to optimize clearance.77

On the other hand, in slow transporters, peak UF occurs late during the dwell, and net UF can be obtained even after prolonged dwells because glucose absorption is slow (low
D/P creatinine and high D/D0 glucose). The D/P ratios for creatinine and urea increase almost linearly during the dwell. For these patients, dwell time is the crucial determinant of overall clearance. They do best with continuous therapies, such as standard CAPD or CCPD. Notwithstanding these considerations, the vast majority of patients have an “average” transport type and they can be successfully treated with either PD modality. Two recent, large studies have demonstrated that there is not a difference in mortality among patients treated with CAPD or APD.78,79 Furthermore, either PD modality (CAPD or CCPD) can be successfully adapted to even patients at the extreme of transport type (rapid or slow).


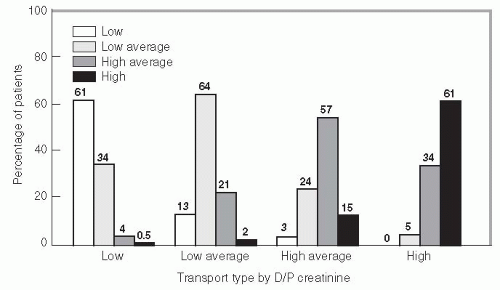
FIGURE 83.3 Discordance between categorization of patients’ transport type by D/P creatinine or D/D0 glucose. Thus, of the patients categorized low transporter by D/P creatinine, 61% of them will be classified as a low transporter by D/D0 glucose; of the patients classified as low average transporter, 64% will be classified as low average transporter by D/D0 glucose; of the patients classified as high average transporter, 57% will be classified as high average transporter by D/D0 glucose; and of the patients classified as high transporter by D/P creatinine, 61% will be classified as high transporter by D/D0 glucose. (Modified from Mujais S, Vonesh E. Profiling of peritoneal ultrafiltration. Kidney Int Suppl. 2002;81:S17, with permission.)

The original studies of the PET demonstrated associations between clinical variables and transport status.65 Diabetes has been commonly linked to high transport status.80 More recent, larger studies have not demonstrated a firm association with many clinical variables (e.g., diabetes, inflammation, and volume status) and transport status.81,82,83 Accordingly, peritoneal membrane function can only be determined by an actual, standardized measurement rather than predicting transport rate from clinical variables. Furthermore, the PET cannot be used as a substitute to measure the dose of dialysis. Although it is possible to estimate daily clearances from PET studies, these estimates can significantly over- or underestimate actual daily clearances.84

The PET also provides useful prognostic information for patients treated with CAPD. Brimble et al. performed a meta-analysis of studies examining the consequences of high transport status.85 Twenty studies representing distinct populations throughout the world were included in the analysis. Increases in D/P Cr were associated with higher mortality risk and treatment failure. Due to rapid dissipation of an osmotic gradient for ultrafiltration, high transporters on CAPD would be expected to more commonly have volume overload. Indeed, within the meta-analysis, the association between high transport and mortality was much diminished in CCPD patients and other data demonstrate that once patients with high transport status transfer to HD, mortality rates equalize.86 Thus, the present state of knowledge would suggest a careful evaluation and aggressive management of nutritional and volume status and comorbidities among individuals with a higher transport type.


Measurements to Monitor Dialysis Dose

It is recommended that monitoring should include both dialysis dose and nutritional parameters because outcomes correlate with both. In light of emerging data favoring urea clearances over creatinine clearances, however, the consensus of the various expert groups seems to be to use only urea kinetics to monitor the dose of PD (Fig. 83.4). The only major difference appears to be with regard to defining the clearance targets based upon peritoneal or total (renal + peritoneal) Kt/Vurea. This is an important consideration since, for a 70-kg man, each 1 mL per minute of renal urea clearance adds approximately 0.25 to the total weekly Kt/Vurea.

Collections of dialysate and urine over 24 hours are relatively easy to obtain and can provide most of the clinically relevant data one needs to individualize a patient’s prescription and monitor progress. These collections also can be used to calculate PNA, fat-free, edema-free mass (FFEFM), and other variables. The data obtained from 24-hour collections is complementary to that obtained from PET and are routinely used together for developing a patient’s dialysis prescription and problem solving.


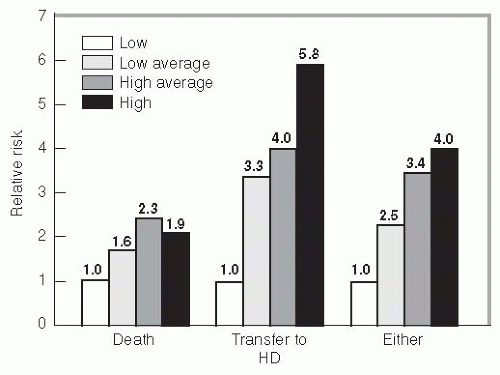
FIGURE 83.4 Relationship between transport type and patient outcome. With increasing permeability of the peritoneum, as defined by the peritoneal equilibration test, there is an increasing risk for death and/or technique failure. (Modified from Churchill DN, Thorpe KE, Nolph KD, et al. Increased peritoneal transport is associated with poor patient and technique survival on continuous ambulatory peritoneal dialysis. J Am Soc Nephrol. 1998;9:1285.)


Calculation of Dialysis Dose

To individualize dialysis dose and make comparisons of dose between patients, the solute clearances are typically normalized. If urea kinetics (Kt/V) are used, the sum of the daily dialysate and residual renal urea clearances are then divided by the volume of distribution for urea (V).29 The urea V can be estimated to be 60% (males) or 55% (females) of the patient’s weight in kilograms. More accurate estimations of V can be obtained using standardized nomograms, such as Watson87 or Hume and Weyers.88


TABLE 83.6 Commonly Used Formulas for Protein Nitrogen Appearance


PNA= 10.76 (Gun + 1.46)91


PNA = 9.35 Gun + 0.294 V + protein losses90


PNA = 6.25 (UNloss + 1.81 + 0.031 × body weight)94


PNA = 6.25 × N loss92


PNA (g/24 h) = 15.1 + (6.95 × urea nitrogen appearance in g/24 h) + dialysate and urine protein in g/24 h (Bergstrom)a


In the absence of direct measurement of urinary and dialysate protein losses, this following less accurate formula may be used:


PNA (g/24 hours) = 20.1 + (7.50 × urea nitrogen appearance in g/24 h (Bergstrom)


a Bergstrom J, Heimburger O, Lindholm B. Calculation of the protein equivalent of total nitrogen appearance from urea appearance, which formulas should be used? Perit Dial Int 1998;18:467. (Modified from Keshaviah P, Nolph K. Protein catabolic rate calculations in CAPD patients. Trans Am Soc Artif Intern Org. 1991;37:M400.)


PNA, protein nitrogen appearance; Gun, urea nitrogen generation rate; V, volume of urea distribution; UNloss, urea nitrogen loss; N, nitrogen.


Calculation of the urea volume of distribution (V) is complicated by numerous pitfalls.89 Weight has a different effect on normalization for men or women and, therefore, will affect Kt/V measurements. These differences are most marked when a patient’s weight differs significantly from the norm in patients with the same height and frame size. The actual V is different in a patient with the same body weight if the increase in body weight from desirable is owing to overhydration or increase in adipose tissue. The same is true if loss of weight is due to protein energy wasting (PEW) versus amputation.


Calculation of Dietary Protein Intake

Dietary protein intake can be directly measured in metabolic wards, by dietary histories, or food recall records. An advantage of using food records is that they also evaluate total energy intake. Unfortunately, food records are time consuming and difficult to obtain because they require trained dietitians. Therefore, most reports relating dialysis dose to protein intake use estimations, based on urinary and dialysate nitrogen appearances and expressed as the protein equivalent of nitrogen appearance (PNA).90 The most commonly used formulas to estimate PNA are summarized in Table 83.6. 91,92,93,94


The total PNA is then divided by the patient’s body weight to determine the “normalized” PNA (nPNA), expressed in grams per kilogram of body weight per day. This term does not take into account differences in frame size and fat-free, edema-free mass (FFEFM). If a patient is markedly obese, the aforementioned calculations give a falsely low nPNA for the patient’s actual FFEFM. Conversely, if a patient has PEW and has a less than expected FFEFM, these equations yield a falsely elevated nPNA. Various attempts to avoid this problem have been investigated, but corrections have not been standardized. One modification uses actual measurements of V or data from nomograms that more accurately estimate V. This V is then “normalized” by dividing it by 0.58 kg per L to determine normalized body weight. The PNA is then divided by normalized body weight to get nPNA. An extension of these principles is utilized to determine FFEFM from creatinine kinetics.95 Finally, there is early evidence that bioimpedance measurements can assist with identifying both the “dry weight” and relative contribution of muscle mass, adipose mass, and fluid.96


Adjusting Dialysis Dose and Recognizing Pitfalls in Prescribing Peritoneal Dialysis

The initial PD prescription should be based upon a knowledge of the patient’s transport type (determined using a PET), body size, and presence or absence of residual renal function. This can be done by using published algorithms (e.g., K/DOQI guidelines, data from EAPOS) or using computerized kinetic modeling.97,98 The clearances achieved with the initial prescription should be confirmed with 24-hour collections of urine and dialysate. If the patient is not at goal, the prescription should be adjusted. This adjustment can also be done either empirically or using computerized kinetic modeling programs. There are two general changes that can be made to maximize clearances in an individual patient—either increase the drain volume or increase the D/P ratio in the dialysate effluent. Increasing the instilled volume increases the total drain volume and thus, the convective clearance. By altering dwell time, one can change both the D/P ratio at the end of prescribed dwell and the drain volume. The strategies to maximize the drain volume in patients undergoing PD are summarized in Table 83.7.4,73,99,100,101,102,103,104 If a patient does not have a continuously wet abdomen, providing 24-hour dialysis should be the first step to enhance clearances. In a patient with a continuously wet abdomen, increasing the dwell volume should be the first step to enhance clearances. Most patients are able to tolerate the increased fill volumes without any discomfort and, if blinded to the fill volume, many are unable to correctly identify the amount of fluid instilled.105,106 In order to improve tolerance, the fill volumes may be increased when the patient is lying supine (i.e., for the nighttime exchanges). Furthermore, cycler therapy allows increases in fill volumes in increments of 100 mL and improves tolerance of increasing the volume of instilled dialysate.


TABLE 83.7 Strategies to Enhance the Peritoneal Small Solute Clearances


Only gold members can continue reading. Log In or Register to continue

Stay updated, free articles. Join our Telegram channel

May 29, 2016 | Posted by in NEPHROLOGY | Comments Off on Peritoneal Dialysis

Full access? Get Clinical Tree

Get Clinical Tree app for offline access

Continuous Ambulatory Peritoneal Dialysis


Automated Peritoneal Dialysis


Daytime exchanges


Daytime exchanges


Increase dwell volume100


Add daytime dwell (if dry day)