Computed Tomography and Magnetic Resonance Imaging
Kyongtae T. Bae
Sonal Krishan
Cross-sectional imaging is essential for the diagnosis and clinical management of a number of renal pathologies. Although ultrasound (US) represents a first-line imaging modality in the assessment of the kidney because of its cost effectiveness, portability, and availability, the images are highly operator dependent and are limited in anatomic coverage as compared to computed tomography (CT) scans and magnetic resonance imaging (MRI). CT scans and MRIs offer images of superb anatomic detail and permit the accurate and noninvasive assessment of a wide range of renal and urologic pathologies including: congenital anomalies, obstructive disease, inflammatory lesions, vascular insufficiency, benign and malignant tumors, and trauma. Although CT scans remain far more commonly used in clinical settings, the role of MRI is growing because of its superior intrinsic tissue contrast and the absence of radiation exposure. Additionally, MRIs can be used as the problem-solving modality when US or CT findings are nondiagnostic.
TECHNICAL CONSIDERATIONS FOR COMPUTED TOMOGRAPHY SCANS AND MAGNETIC RESONANCE IMAGING
Principles of Computed Tomography Scans
Similar to conventional X-ray radiographic images, the physical basis for a CT scan is the attenuation of X-ray photons passing through the body. The basic hardware of a CT scanner system consists of an X-ray gantry (which supports a rotating X-ray tube and a set of X-ray detectors); a patient table that moves in and out of the gantry; and a computer system integrated with the gantry, data-storage hardware, and image-display console. A precisely collimated narrow X-ray beam (a fan-shaped beam) is generated, then transmitted through the patient’s body and received and identified by the detectors on the opposite side of the gantry. The use of a rotating X-ray beam and detector arrays permits the detection and measurement of the X-rays attenuated by tissues from many different projections. It is from these measurements that the CT images are mathematically reconstructed.1 The CT scan is operated at various user-selectable voltages (e.g., 80, 100, 120, 140 kVp) and currents (milliampere second [mAs]) that closely determine radiation dose and image quality.
Computed Tomography Attenuation or Computed Tomography Number (Hounsfield unit)
The spatial resolution of a CT image typically achieves 0.3 to 0.5 mm with an imaging matrix size of 512 × 512 pixels. Each pixel (picture element) value of a CT image represents the tissues’ X-ray attenuation coefficient at that pixel, which is expressed in Hounsfield units (HU). The data size of each pixel is typically 2 bytes. Because a CT image consists of 512 × 512 pixels, the data size of a CT image is approximately 0.5 MB (512 × 512 × 2). The attenuation value assigned to each pixel is based on a reference scale in which — 1,000 HU is the value assigned to air and 0 HU is assigned to water.2 Fat is typically — 30 HU or less, whereas calcification, bone, and iodinated contrast are usually greater than 100 HU. User selection of the number of shades of gray (window width) in the image and the central hue of gray (window level) permits the modification of displayed image contrast. By adjusting the window width and level, the image can be optimized for evaluating a wide range of tissues with varying attenuations. For example, bone and a contrast-filled bladder are typically presented as bright (high attenuation) structures, whereas the lungs are typically presented as dark (low attenuation) structures. Subtle structures such as a solid tumor within a normal parenchyma may be displayed more conspicuously in a specifically designed window setting (e.g., liver window).
Computed Tomography Technical Advances
CT technology has advanced from the traditional single-row detector array to a multiple-row detector array. Multidetector-row CT (MDCT) scans, which are now the standard method for performing CT examinations, allow multiple channels of data to be acquired simultaneously. As a result, MDCT scans covers a large volume of area in a short scan time with thinner slices and an improved spatial resolution along the patient’s craniocaudal axis. Presently, 64- detector MDCT systems are most commonly in use; however, the 320-detector MDCT has been recently introduced into clinical practice. Using MDCT, the entire abdomen can be imaged in a few seconds. MDCT scans offer a greater speed of acquisition and higher resolution images than single-detector CT scans and thus greatly facilitate multiplanar imaging and three-dimensional (3D) reconstruction (Fig. 11.1).
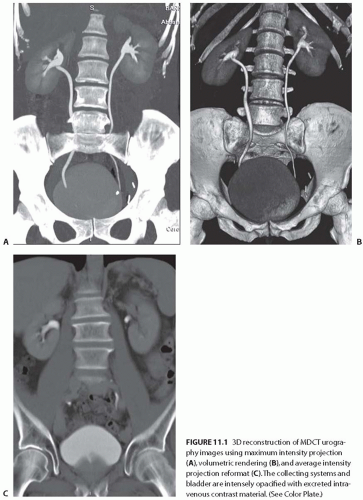 FIGURE 11.1 3D reconstruction of MDCT urography images using maximum intensity projection (A), volumetric rendering (B), and average intensity projection reformat (C). The collecting systems and bladder are intensely opacified with excreted intravenous contrast material. (See Color Plate.) |
The technical advances of MDCT scans have allowed highly technical and challenging clinical applications, such as CT angiography (CTA), to be practiced routinely. MDCT scans have essentially replaced the conventional catheterbased diagnostic renal angiography. In many institutions, MDCT urography is performed in place of the conventional intravenous urography.3,4,5 MDCT renal imaging is widely used as the “one-stop shop” single imaging modality for the evaluation and surgical planning of many clinical conditions involving the kidney and urinary tract. In addition, the application of 3D techniques to CT scans allows for the accurate depiction of tumor depth, location, relationship of the tumor to adjacent structures, and the delineation of renal vascular anatomy as well as aid in preoperative planning (Fig. 11.2).
Recently, dual-energy MDCT scans were introduced, allowing the simultaneous acquisition of low- and high-voltage CT images during the same scanning phase. This technique has the potential to better characterize renal stone compositions and renal lesions through the assessment of their distinct CT attenuation profiles, thereby providing potentially improved physiologic and molecular information.6
Use of Contrast Media in Computed Tomography Scans
A CT evaluation of renal anatomy and pathology often requires the intravenous injection of iodinated contrast media. Intravenous contrast enhancement is useful for the depiction of small lesions by increasing their conspicuity, for the demonstration of vascular anatomy and vessel patency, and for the characterization of lesions through their patterns of contrast enhancement. On the other hand, an unenhanced CT scan is better suited to detect renal or urinary calcifications and intrarenal or perirenal hemorrhage because CT images obtained after the administration of contrast media may mask these abnormalities.7,8,9 Unenhanced CT scans are also recommended for the quantification of tumor contrast enhancement on the postcontrast scans and for patients with poor renal function.
The commercially available radiographic contrast agents are tri-iodinated derivatives of benzoic acid. All currently available intravenous (IV) contrast media are excreted by the kidney through glomerular filtration, with no significant tubular excretion or resorption.10,11 It is prudent that the physician inquire about the patient’s history, particularly regarding the renal function and any history of allergies to the contrast material. A history of asthma and severe allergies increases the risk of subsequent reaction to contrast agent injection by a small percentage. The administration of corticosteroids, with or without antihistamines, 12 hours before a contrast injection to reduce the occurrence of adverse reactions in allergic patients has been well documented. Oral contrast is less critical in urologic imaging than in gastrointestinal imaging. In fact, the use of oral contrast media may be counterproductive for the evaluation of renal calculi or CTA.
A contrast-enhanced CT scan is typically performed with 100 to 150 mL of 300 to 370 mg per milliliter of contrast medium injected at 2 to 3 mL per second. The amount of contrast medium is adjusted for the patient’s size, clinical indications, and the CT scanner type. For CTA, fast injection rates (4 to 5 mL per second) are recommended. CT scan delays are determined by fixed delay or bolus tracking techniques.12
After the administration of an IV contrast agent, contrast-enhanced CT scans can be acquired at different contrast enhancement phases: early arterial, corticomedullary, nephrographic, and excretory phases (in the order of increasing CT scan delays) (Fig. 11.3). Although the kidney is normally imaged in routine abdominal CT scans at a single (nephrographic) phase of contrast enhancement, dedicated renal imaging protocols consist of scanning of the kidney at multiphases of contrast enhancement. Imaging phases must be selected in accordance with clinical indications because it is important to minimize the number of scanning phases to reduce the radiation exposure for a patient.
The early arterial phase begins with the arrival of the contrast medium in the renal artery and ends prior to the occurrence of intense renal venous return. This phase is primarily useful in arterial CTA (i.e., surgical planning and renal artery stenosis evaluation) and is very limited for the diagnostic imaging of the kidney and urinary tract. The corticomedullary phase of the kidney corresponds to an intense enhancement of the renal cortex prior to a substantial enhancement in the medulla. The depiction of a hypervascular renal mass and renal artery anatomy is maximized during the corticomedullary phase. The nephrographic phase of the kidney corresponds to homogeneous enhancement throughout the renal parenchyma with a loss of corticomedullary differentiation. The depiction of renal lesions in the cortex or medulla is maximized during this phase. The degree of contrast enhancement in a renal mass is evaluated by noting the difference in the CT scan attenuation of the mass between this phase and in the unenhanced CT images. The onset of the excretory or urographic phase is about 2 minutes after the start of contrast medium injection. Maximal opacification of the renal calyces, pelvises, and ureters occurs later, about 5 to 10 minutes after the injection of the contrast medium. This is the best enhancement phase for the assessment of (benign and malignant) conditions affecting the urinary tract.
Magnetic Resonance Imaging Principles
An MRI scan begins with placing the patient in the central bore of an electromagnet, which generates a static magnetic field. Nuclei with odd numbers of protons or neutrons (of which hydrogen is the most abundant in biologic tissue) align themselves with their magnetic moments, either parallel or antiparallel to the external field. A net magnetization vector lies in a direction parallel to the static magnetic field of the magnet bore of the MRI (called the z-axis by convention). A radio frequency (RF) transmission coil transmits RF pulses through the patient and energizes the protons in the z-axis. When the RF pulse is turned off, the protons give off
the energy (relaxation) that was imparted to them by the RF pulse.13,14 This emitted energy is received by a receiver RF coil, and it is from this energy that the MR image is created. MRI pulse sequences determine the patterns of repetitive RF pulsations and the sampling of MR signals emitted during the intervals between RF pulses. Each MR sequence takes advantage of the intrinsic property of the body’s tissues to absorb and release this energy. How this energy is imparted through the physics of the pulse sequences and whether energy is released quickly or slowly determines the weighting of an image. In general, an image is either T1 or T2 weighted. An MRI possesses exquisite contrast resolution, even without the use of IV contrast. On T1-weighted images, the fluid is generally dark (also called low signal) and on T2-weighted images, the fluid is bright (also called high signal).13,14
the energy (relaxation) that was imparted to them by the RF pulse.13,14 This emitted energy is received by a receiver RF coil, and it is from this energy that the MR image is created. MRI pulse sequences determine the patterns of repetitive RF pulsations and the sampling of MR signals emitted during the intervals between RF pulses. Each MR sequence takes advantage of the intrinsic property of the body’s tissues to absorb and release this energy. How this energy is imparted through the physics of the pulse sequences and whether energy is released quickly or slowly determines the weighting of an image. In general, an image is either T1 or T2 weighted. An MRI possesses exquisite contrast resolution, even without the use of IV contrast. On T1-weighted images, the fluid is generally dark (also called low signal) and on T2-weighted images, the fluid is bright (also called high signal).13,14
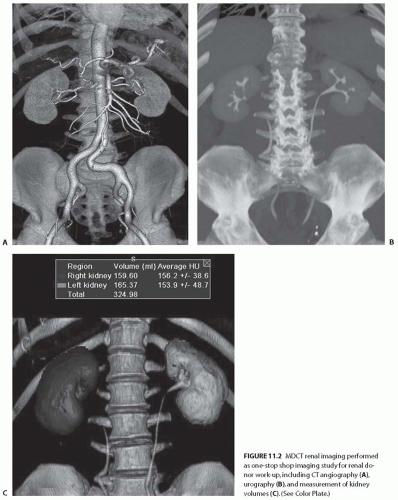 FIGURE 11.2 MDCT renal imaging performed as one-stop shop imaging study for renal donor work-up, including CT angiography (A), urography (B), and measurement of kidney volumes (C). (See Color Plate.) |
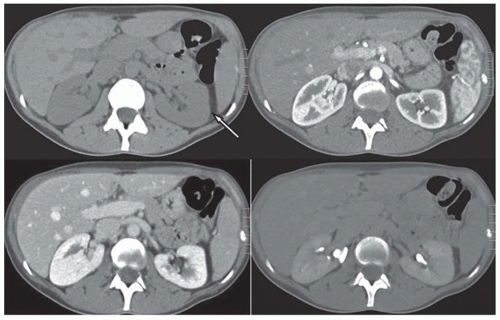 FIGURE 11.3 CT images of normal kidneys obtained without intravenous contrast (left upper), at corticomedullary phase with contrast (right upper), nephrographic phase (left lower), and delayed excretory phase (right lower). The arrow points to the peri-renal fat. |
In order to map the anatomic distribution of different tissue signals, magnetic field gradients are established within the MR scanner along the x-, y-, and z-axes. Because the protons’ resonance frequency depends on the magnetic field strength, controlled applications of magnetic field gradients induce protons to precess at different frequencies and phases according to their spatial distributions. The pattern of a received signal from a selected tissue volume can be converted to an image in which digital information related to protons’ spatial distribution is reconstructed into images displayed over a gray scale.13,14 Unlike CT attenuation values (HU), MR signal intensities are not directly specific to tissue compositions. Therefore, MR signal intensities between tissues are frequently compared in relative scales, such as a ratio to reference signal intensity.
Technical Advances in Magnetic Resonance Imaging
Because the respiratory motion of the kidney may significantly decrease the image quality, it is critical to perform an MRI scan with fast sequences within a breath hold. A variety of fast T1-weighted and T2-weighted sequences are available with the development of advanced coil and parallel imaging techniques to improve both temporal and spatial resolutions of an MRI. An MR angiography (MRA) is routinely performed when a diagnostic evaluation of the renal vasculature is requested. Although noncontrast sequences are available for an MRA, the dominant technique is the 3D gadolinium-enhanced MRA. For an evaluation of the urinary tract, an MR urography (MRU) has been developed. An MRU may be performed on T2-weighted sequences, exploiting the
long T2 of urine without gadolinium or on T1-weighted sequences after the administration of gadolinium contrast during the excretory phase.
long T2 of urine without gadolinium or on T1-weighted sequences after the administration of gadolinium contrast during the excretory phase.
Recent advances have resulted in new MR techniques for evaluating renal function such as perfusion, diffusion, oxygenation, and sodium concentration. A functional MRI of the kidney has not yet found broad clinical application, but it has great potential. Through the ongoing development of functional MRI techniques, we may expect an increasing role for functional MRIs in the management of patients with renal disease.9,15,16
The Use of Contrast Media in Magnetic Resonance Imaging
Gadolinium chelates are almost exclusively used for IV contrast materials for MRIs. Gadolinium agents have been shown to produce comparably lower incidences of allergic reactions than the iodinated contrast agents used in CT scans. The gadolinium compounds are filtered at the glomerulus and are neither reabsorbed nor secreted. They parallel iodinated contrast material in their pattern of initial intravascular and subsequent extracellular space distribution and in their pattern of excretion. Gadolinium-based contrast agents demonstrate a similar pattern of contrast enhancement as iodinebased agents (see Fig 11.4).17,18
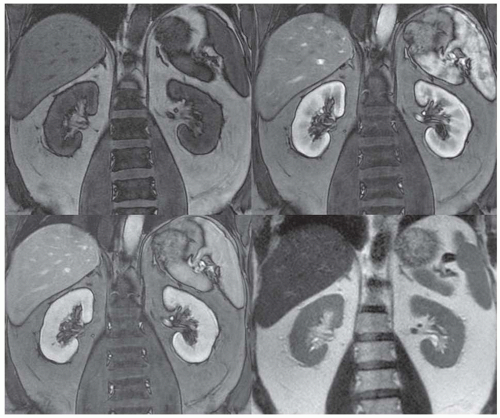 FIGURE 11.4 MR images of normal kidneys: T1-weighted without intravenous contrast (left upper), contrast-enhanced T1-weighted at corticomedullary phase (right upper), contrast-enhanced T1-weighted at nephrographic phase (left lower), and T2-weighted (right lower). |
For many years, gadolinium-based contrast-enhanced MRIs were believed to be safer and they were the preferred method of contrast (instead of iodine-based contrast material) for patients with renal impairments. However, since early 2006, evidence has been mounting that some gadoliniumbased contrast agents may potentially cause the fibrosing sclerodermalike condition called nephrogenic systemic
fibrosis (NSF) in patients with renal failure.19,20,21 Patients at the highest risk of NSF include: (1) patients who have severe acute or chronic renal impairment with glomerular filtration rates (GFR) < 30 mL per min/1.73m2; (2) patients on dialysis (hemo or peritoneal); and (3) patients with reduced renal function awaiting liver transplantation. The recognition of this adverse reaction to gadolinium-based agents in renal-impaired patients emphasizes the need for an appropriate clinical indication for gadolinium-enhanced MRIs in this patient population. If an MRI is clearly indicated, the lowest dose of the agent that leaves the smallest amount of gadolinium in the body must be used and, in certain cases, immediate dialysis after the administration is recommended.19,20,21
fibrosis (NSF) in patients with renal failure.19,20,21 Patients at the highest risk of NSF include: (1) patients who have severe acute or chronic renal impairment with glomerular filtration rates (GFR) < 30 mL per min/1.73m2; (2) patients on dialysis (hemo or peritoneal); and (3) patients with reduced renal function awaiting liver transplantation. The recognition of this adverse reaction to gadolinium-based agents in renal-impaired patients emphasizes the need for an appropriate clinical indication for gadolinium-enhanced MRIs in this patient population. If an MRI is clearly indicated, the lowest dose of the agent that leaves the smallest amount of gadolinium in the body must be used and, in certain cases, immediate dialysis after the administration is recommended.19,20,21
MAGNETIC RESONANCE IMAGING VERSUS COMPUTED TOMOGRAPHY SCANS
CT scans and MRIs complement each other in providing diagnostic information for the detection and characterization of renal pathologies. Because CT scans are faster and easier to perform, it is more commonly used in the evaluation of renal and perirenal disease. The MRI remains primarily a problem solving modality adjunct to a CT scan or is used when a CT scan is contraindicated. The CT scan is superior for the reliable detection of calcified structures, whereas an MRI provides superb intrinsic tissue-contrast resolution and multiplanar imaging, which is particularly useful for the evaluation of renal vasculature.
If nephron sparing surgery is contemplated, an MRI is better able to differentiate a tumor from perinephric fat, the renal sinus, and the collecting system, thus helping the urologist decide if a partial nephrectomy is feasible. Staging renal lesions is more complete with an MRI than a CT scan, particularly when determining renal vein and inferior vena cava (IVC) involvement.22,23 Patients who have genetic anomalies resulting in an increased risk for renal cell carcinoma (RCC) (e.g., von Hippel-Lindau), and those with conditions that produce other renal lesions that may mimic RCC (e.g., tuberous sclerosis), can be followed safely with a yearly MRI. This follow-up regimen will protect these high-risk patients from recurrent exposure to ionizing radiation from CT scans, with no loss in the ability to detect or characterize renal lesions.24,25,26,27,28,29,30,31,32,33,34,35,36,37 Conversely, patients who are critically ill (e.g., intensive care unit patients) and those who have difficulty with the breath-holding requirements are not ideal candidates for renal MRIs. Patients unable to cooperate for other reasons (e.g., dementia, chronic obstructive pulmonary disease, morbidly obese) are also unsuitable for MRIs. Scanning these patients often results in a poor quality examination that may not be interpretable. Patients who have ferromagnetic implants (some neurovascular aneurysm clips, cochlear implants, pacemakers, defibrillators) are also contraindicated for MRIs. Furthermore, patients with claustrophobia may not be able to undergo MRIs.24,25,26,27,28,29,30,31,32,33,34,35,36,37
NORMAL ANATOMY
The kidneys lie within the retroperitoneum that is in turn divided by facial planes into three compartments centering the kidneys: the perirenal, the anterior pararenal, and the posterior pararenal spaces. The kidneys, the perirenal fat, and the adrenal gland are in the perirenal space enclosed by the anterior (Gerota) and posterior (Zuckerkandl) layers of the renal fascia. The perirenal space also includes the renal and adrenal vessels, the aorta, the inferior vena cava, and the perivascular lymph nodes. The kidneys lie lateral to and roughly parallel with the lateral border of the psoas muscle. The renal fossa is bounded medially by the psoas muscle, posteriorly by the quadratus lumborum muscle, laterally by the transversus abdominis muscles, and superiorly by the diaphragm. Anteromedially, the kidneys are covered by peritoneum; posteriorly, the 12th rib crosses the left kidney at a 45-degree angle, with approximately one-third or more of the left kidney superior to the inferior margin of the thoracic cage.38,39,40,41,42 A fibrous envelope called the renal capsule covers the kidney and is firmly adherent to the renal substance. A potential space exists between the kidney and its capsule, which in abnormal situations (such as trauma and infection) may contain blood, pus, or urine.38,39,40,41,42
The renal sinus contains fat and fibrous tissue, renal vessels, nerves, and lymphatics. The sinus extends around the renal pelvis, the infundibula, and the calyces and is continuous with the perinephric fat. The renal arteries arise from the aorta and enter the renal hila. The renal veins lie anterior to the renal arteries, whereas the left renal vein usually runs between the aorta and the superior mesenteric artery.38,39,40,41,42 The adrenal glands lie anterior and medial to the upper poles of kidneys and are bilobed V- or Y-shaped structures.
The anterior pararenal space contains the second and third parts of the duodenum, the pancreas, and the ascending and descending portions of the colon. It is limited anteriorly by the parietal peritoneum, and posteriorly by the renal fascia. The posterior pararenal space contains only fat and is bounded posteriorly by the transversalis fascia. The parietal peritoneum and transversalis fascia fuse laterally to form the lateroconal fascia. The anterior and posterior pararenal spaces communicate to a limited extent above and below the level of the renal vessels. Fascial planes are demonstrated as linear structures of soft tissue attenuation surrounded by low attenuation fat.38,39,40,41,42 These fascial planes may unfuse and form a potential space between the perirenal and pararenal spaces to be filled with fluid; in particular, a sequelae of pancreatitis.
On unenhanced CT scans, the kidneys appear as oval structures with soft tissue (gray) attenuation surrounded by low attenuation (dark) perirenal fat (Fig. 11.3). They intensely (brightly) enhance with intravenous contrast. The appearance of the kidneys on MRIs depends on a number of factors, including the type of MR sequences, hydration, and contrast enhancement (Fig. 11.4). On T1-weighted images, the kidney presents with intermediate (gray) signal intensities similar to visceral organs and muscle. On T2-weighted images, the
kidney is slightly hyperintense showing signal intensities similar to the spleen. The renal medulla is slighter darker on T1 images but is brighter on T2 images than the renal cortex. This is likely because of a greater unbound water (urine) content in the medulla.25 Gadolinium contrast agents administered intravenously shorten T1 and enhance the renal parenchyma in T1-weighted images.36,43,44,45 When lesion contrast enhancement is difficult to detect, a subtraction technique between unenhanced and enhanced T1-weighted images is required.
kidney is slightly hyperintense showing signal intensities similar to the spleen. The renal medulla is slighter darker on T1 images but is brighter on T2 images than the renal cortex. This is likely because of a greater unbound water (urine) content in the medulla.25 Gadolinium contrast agents administered intravenously shorten T1 and enhance the renal parenchyma in T1-weighted images.36,43,44,45 When lesion contrast enhancement is difficult to detect, a subtraction technique between unenhanced and enhanced T1-weighted images is required.
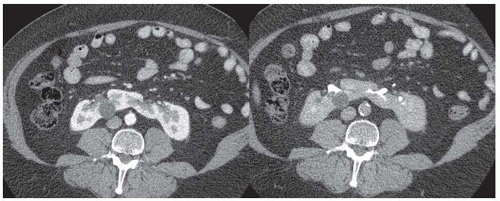 FIGURE 11.5 CT images of horseshoe kidney obtained at cortcomedullary (left) and delayed excretory phase (right). A small cyst is noted in the right kidney. |
The calyces, renal pelvises, and ureters containing abundant water (urine) have low signals on T1-weighted images and high signals on T2-weighted images. The intraluminal signal intensities of the renal vessels vary widely depending on the MR sequences, imaging planes, and gadolinium contrast. The perirenal fat is bright on both T1- and T2- weighted images. The fat saturation technique suppresses the hyperintense perirenal fat signal and helps detect and characterize a renal lesion with fat, such as angiomyolipoma.
RENAL PATHOLOGIES
Congenital Variants of Renal Anatomy
Congenital and developmental variants of the kidney such as ectopic kidneys, horseshoe kidneys (Fig. 11.5), duplicated collecting systems, and various hypoplasia or dysplasia (Fig. 11.6) are routinely detected on cross-sectional imaging. An MRI is
particularly attractive as an imaging modality for the serial follow-up of pediatric patients with suspected renal anomalies because it requires no ionizing radiation and offers superb intrinsic contrast without exogenous contrast agents.46,47
particularly attractive as an imaging modality for the serial follow-up of pediatric patients with suspected renal anomalies because it requires no ionizing radiation and offers superb intrinsic contrast without exogenous contrast agents.46,47
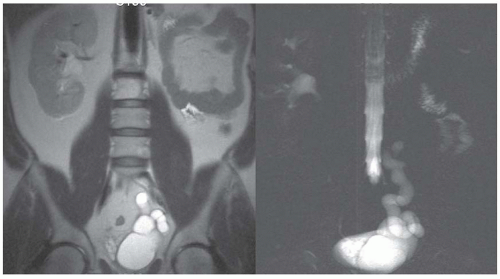 FIGURE 11.6 Left renal agenesis with dilated, tortuous ureteral remnant shown on T2-weighted MR (left) and MR urography (right). The right kidney shows compensatory hypertrophy. |
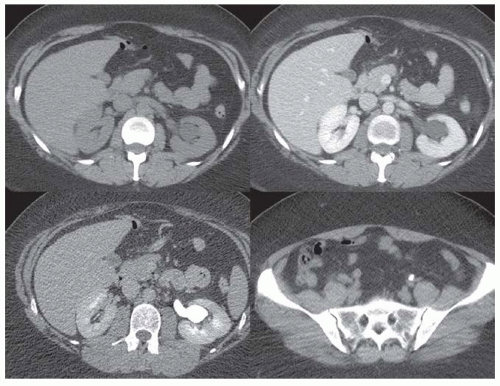 FIGURE 11.7 CT images of kidneys obtained without intravenous contrast (left upper), at nephrographic phase with contrast (right upper), and at delayed excretory phase (left lower). Mild hydronephrosis in the left kidney caused by a distal ureteral calculus (right lower) is conspicuously demonstrated by excreted contrast filling the dilated collecting system. |
Obstructive Disease
Unenhanced renal CT scans have emerged as an attractive alternative to intravenous urography (IVU) and ultrasound (US) imaging in patients with suspected renal colic. A CT scan allows us to evaluate the abdomen and the retroperitoneum for other disorders that mimic renal colic, including diverticulitis, appendicitis, an aortic aneurysm, and retroperitoneal fibrosis. The dilated, fluid-filled collecting system and ureter, along with the anatomic site, degree, and cause of obstruction can be evaluated on unenhanced images (Fig. 11.7). The acutely obstructed kidney may be enlarged and edematous. The renal execretion of contrast can be assessed on contrast-enhanced CT scans. With an acute obstruction, the usual transient, early cortical-medullary phase contrast enhancement is prolonged (persistent nephrogram) with a delayed excretion of contrast into the collecting system (Fig. 11.8).3,6,27,28,36,43,48,49,50,51,52,53,54,55,56 Chronic obstruction may cause a marked distention of the fluid-filled collection system and an atrophy of the renal parenchyma.3,6,27,28,36,43,48,49,50,51,52,53,54,55,56
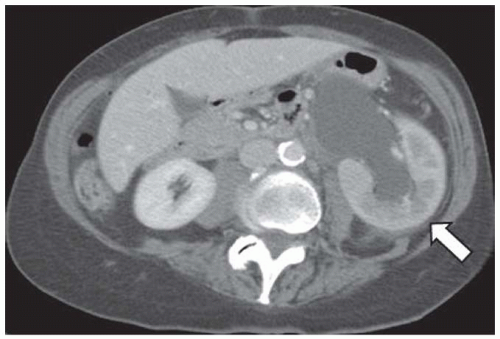 FIGURE 11.8 CT showing acute obstruction at the left uretero-pelvic junction with persistent cortico-medullary enhancement (compare the pattern of enhancement to the right kidney). |
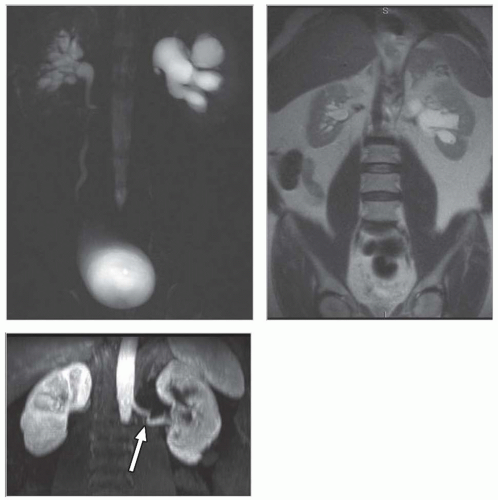 FIGURE 11.9 Left renal hydronephrosis shown on T2- weighted MR (top left) and MR urography (top right). The hydronephrosis was caused by a large crossing renal artery (white arrow), which courses across the ureteropelvic junction with a sharp angulation, as shown on contrastenhanced MR angiograph (bottom). |
Although an MRI is not commonly used as the first-line diagnostic imaging modality for the evaluation of suspected obstructive disease, the ureteral, pelvic, and calyceal dilatation caused by a distal obstruction can be readily delineated on transaxial, sagittal, or coronal MRIs. Gadolinium contrast is not necessary to determine the presence of an obstruction. In particular, an MRI that uses heavily T2-weighted images without gadolinium contrast has been shown to be accurate in detecting an obstruction (Fig. 11.9).3,6,27,28,36


Related posts:


Stay updated, free articles. Join our Telegram channel
Full access? Get Clinical Tree
