PATHOMECHANISMS UNDERLYING ENDOCRINE DISORDERS IN PATIENTS WITH CHRONIC KIDNEY DISEASE
Disturbances of endocrine function in patients with chronic kidney disease may arise from a number of different causes, which are summarized in
Table 80.1.
The clinician has at his or her disposal measurements of hormone concentration, which may or may not be abnormal. However, endocrinologic assessment is more than looking at plasma hormone concentrations. Hormone concentrations per se fail to provide a proper assessment of the adequacy of the hormonal state (e.g., hormone concentrations may be inappropriate to the stimulating or suppressing signal, the test may detect inactive hormone isoforms, or the response of the target organ may be abnormal). It is, therefore, indispensable to interpret hormone levels in the appropriate context (e.g., insulin concentration relative to glucose concentration, parathyroid hormone [PTH] in relation to serum ionized calcium concentration, and plasma 1,25-dihydroxycholecalciferol [1,25(OH)2D3] concentration).
DISORDERS OF CARBOHYDRATE METABOLISM IN PATIENTS WITH CHRONIC KIDNEY DISEASE
In patients with chronic kidney disease (CKD) abnormalities in carbohydrate metabolism are encountered at different levels of the insulin-glucose cascade (
Table 80.2). Patients with chronic kidney disease almost always display resistance to the peripheral action of insulin, although the half-life of insulin is prolonged, because insulin removal by the damaged kidney and by the extrarenal organs is impaired so that plasma insulin concentrations tend to be higher.
1,
2 The normal response of the β cell to insulin resistance is to increase the secretion of insulin and, therefore, hyperglycemia as a pointer to glucose intolerance is seen only when this adaptive response of β cells fails. In CKD patients, glucose intolerance is seen only in patients who have both insulin resistance and impaired insulin secretion.
3
Peripheral Resistance to Insulin Action
Peripheral glucose uptake is reduced in uremic patients as shown by the euglycemic insulin clamp technique.
1,
2 Peripheral resistance to insulin is seen even in patients with early stages of CKD. It is clinically important, because of its tight correlation to the enhanced cardiovascular risk
4 and to the rate of progression of CKD.
5Liver and skeletal muscles are the major sites of peripheral glucose uptake. The liver and, more recently appreciated, the kidney are the major sites of glucose production in the fasting state.
6 Glucose metabolism by the liver is usually not impaired in CKD: hepatic glucose production
2 as well as its suppression by insulin.
2The skeletal muscles are the primary sites of decreased insulin sensitivity. The defect is not at the level of the insulin receptor.
7 The defect is presumably at the postreceptor level. As a result, higher levels of insulin will be required to increase glucose uptake.
7The insulin-regulated glucose transporter (GLUT-4) in muscle and adipose tissue is unchanged in CKD.
8 In the heart of uremic rats, however, we observed (in unpublished studies) diminished insulin-dependent glucose uptake and unchanged total GLUT-4, but reduced GLUT-4 incorporation into the plasma membrane.
Peripheral resistance to insulin action is often found early in the course of renal disease and is present in the majority of patients with advanced CKD
9 and is markedly improved after several weeks of hemodialysis
10 and of peritoneal dialysis. Sera of uremic patients contain a compound that inhibits glucose metabolism by normal rat adipocytes.
11
Insulin Secretion and Pancreatic Islet Metabolism
Glucose-induced insulin secretion starts with the uptake of glucose by the β cells, followed by its metabolism and production of adenine triphosphate (ATP), which facilitates closure of ATP-dependent K
+ channels, followed by cell depolarization, and subsequent activation of voltage-sensitive Ca
++ channels. As a consequence, calcium enters the islets,
causing an acute rise in cytosolic Ca
++ concentration and secretion of insulin.
PTH impairs insulin secretion in CKD and it is improved when PTH secretion is suppressed.
12 Glucose-induced insulin secretion by pancreatic islets is impaired in parathyroid intact but is normal in PTX uremic rats. Conversely, glucose-induced insulin secretion is impaired in rats with normal renal function treated with PTH.
13Islet cells express the vitamin D receptor.
14 Insulin secretion is impaired in vitamin D-deficient rats with normal renal function reversibly with the administration of vitamin D. An acute intravenous administration of 1,25(OH)
2D3 to dialysis patients improved early and late phases of insulin secretion.
15
Insulin Clearance
Insulin is filtered by the glomeruli and reabsorbed in the proximal tubule.
16 Renal insulin clearance (200 mL per minute) exceeds glomerular filtration rate (GFR), indicating additional peritubular uptake.
17 Insulin removal by the kidney accounts for 25% to 40% of total removal.
A decreased metabolic clearance rate of insulin is seen at GFR < 40 mL per minute, and a significant prolongation of insulin half-life is observed at GFR < 20 mL per minute.
18 When dialysis is started, insulin clearance increases.
In CKD patients, diminished renal and extrarenal (liver and muscles) insulin clearance accounts for fasting hyperinsulinemia and higher insulin concentrations, fasting after administration of glucose, and decreased insulin requirements in diabetic patients with impaired renal function.
19
Hypoglycemia
Episodes of spontaneous hypoglycemia may be seen in diabetic and even in nondiabetic CKD patients.
20 In diabetic patients, decreased degradation of administered insulin may cause excessive blood insulin levels; in diabetics, repeated episodes of hypoglycemia may be the first clinical sign of impaired renal function. Many sulfonylurea compounds or their active metabolites are cleared via the kidney.
21 Appropriate dose adjustment is again necessary, but it is even better to switch the patients to insulin. The sulfonylurea gliquidone is eliminated predominantly by the liver and does not accumulate.
Spontaneous hypoglycemia is also occasionally seen in nondiabetic CKD patients.
20,
22 The underlying mechanism is not clear. Poor nutritional status, diminished gluconeogenesis, impaired glycogenolysis, and impaired degradation in insulin may all contribute.
22Hypoglycemia may exacerbate the cardiovascular risk via increased adrenergic activity, coronary ischemia, and arrhythmia.
20
Clinical Consequences
Hyperglycemia and insulin resistance may contribute to accelerated atherogenesis in renal failure. Shinohara et al.
4 followed 183 nondiabetic hemodialysis patients for more than 5 years. Cumulative cardiovascular deaths were significantly more frequent in subjects in the top tertile of insulin resistance assessed by the homeostasis model assessment of insulin resistance (HOMA) technique. The adverse effect of insulin resistance on mortality was independent on body mass, hypertension, and dyslipidemia. Hyperinsulinemia and insulin-resistance contribute to hypertension
23 and lipid abnormalities.
Insulin is also an important regulator of lipoprotein lipase activity and its activity is reduced by insulin deficiency as well as insulin resistance.
24 Lipoprotein lipase plays a major role in triglyceride removal. In patients with CKD, lipoprotein lipase activity is impaired and this is the major cause of hypertriglyceridemia in these patients.
Insulin resistance may also contribute to malnutrition, commonly found in CKD
25 by inflammatory mechanisms.
26,
27 Insulin deficiency stimulates muscle breakdown and activates the ubiquitin-proteasome system.
28 Insulin resistance increases salt sensitivity via increased tubular sodium reabsorption and contributes to hypertension.
29An interesting link between insulin resistance, metabolic syndrome, and kidney disease as a result of excessive fructose ingestion has recently been proposed by Johnson et al.
30
DISORDERS OF LIPID METABOLISM IN CHRONIC KIDNEY DISEASE
In the 19th century, Richard Bright
31 commented on the milky aspect of the serum of patients suffering from kidney diseases. After this early observation, dyslipidemia and hyperlipidemia of renal patients had become well known, but only in the recent decades did it attract more general interest after it had been recognized that atherosclerotic complications are extremely frequent in patients with impaired renal function, at least partially as the result of dyslipidemia.
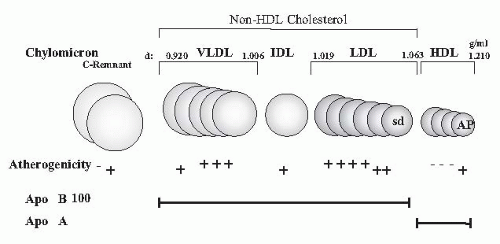
It had long been underappreciated how severe dyslipidemia actually is because measurements were usually restricted to the determination of total cholesterol and triglycerides in plasma. Only today’s more sophisticated analyses of lipid subfractions, postprandial lipid changes, apolipoprotein (apo) concentrations, and modification by oxidation, glycation, and carbamylation have fully disclosed the profound and highly atherogenic character of the lipid changes in uremia (
Fig. 80.1).
Dyslipoproteinemia was initially attributed to reduced renal function, but it has increasingly been recognized that concomitant pathologies (diabetes, metabolic syndrome, proteinuria, steroid treatment, and genetic background) play an important ancillary role.
Lipid Abnormalities in Kidney Disease
The Spectrum of Dyslipidemia in Uremia
Dyslipidemia in uremia is mainly characterized by:
Hypertriglyceridemia
Higher remnant lipoproteins (chylomicron remnants, intermediate density lipoproteins [IDLs])
Lower high density lipoprotein (HDL) cholesterol
Higher small dense low density lipoproteins [sd(LDL)], lipoprotein (a) [Lp(a)], apolipoprotein A-IV (apo A-IV)
Normal plasma LDL cholesterol (except in nephrotic syndrome and in peritoneal dialysis)
Exogenous and Endogenous Pathways
The plasma-lipid spectrum is influenced through two different pathways. In the exogenous pathway, dietary lipids transported from the intestine into the systemic circulation yield triglyceride-rich chylomicrons, which are quickly metabolized by endothelium-associated lipoprotein lipase. Chylomicron remnants are taken up by the liver. Chylomicrons, that is, large triglyceride-rich particles of intestinal origin, are only transiently present in plasma in the postprandial state under physiologic conditions. In CKD patients, the
clearance of chylomicrons is severely impaired.
32 This abnormality contributes to the hypertriglyceridemia in CKD.
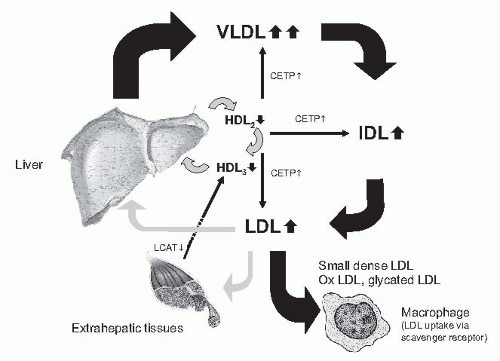
In the endogenous pathway, the liver synthesizes and secretes triglyceride-rich very low density lipoproteins (VLDLs) for export from the liver to peripheral tissues. Chylomicrons are metabolized stepwise to yield IDLs, which are either further converted into LDL particles or taken up by the liver (
Fig. 80.2). This pathway is severely disturbed in CKD and end-stage renal disease (ESRD).
Lipid Spectrum
The lipid spectrum in kidney disease is characterized by quantitative and qualitative changes.
Triglycerides. Triglycerides start to increase in early stages of CKD.
33 They are more strikingly increased in advanced CKD and dialysis, specifically in peritoneal dialysis, and are highest in the nephrotic syndrome. Chylomicrons and VLDL are enriched in triglycerides. This reflects both abnormalities in particle production and in the low fractional catabolic rate of particles. Their reduced fractional catabolic rate is caused by the lower activity of lipoprotein lipase (LPL) and of the hepatic triglyceride lipase. In part, this is the result of the increased apo C-III/apo C-II ratio; apo C-III inhibits and apo C-II activates LPL. The result is an accumulation of intermediate particles, (e.g., chylomicron remnants and IDLs).
High density lipoprotein. In patients with CKD, HDL cholesterol concentrations are commonly reduced and this is accompanied by an abnormal spectrum of HDL subfractions resulting from low apo A-I levels and decreased lecithin:cholesterol acyltransferase (LCAT) activity with consecutive diminishing of esterification of free cholesterol and conversion of HDL3 to HDL2. In uremia, HDLs are modified by paraoxonase, inhibiting the oxidation of LDLs, and by inflammation, converting HDLs from antioxidant in pro-oxidant particles. HDL particles are involved in reverse cholesterol transport from the periphery (e.g., cell membranes) to the liver. The apo A lipoprotein in HDL activates LCAT, which esterifies cholesterol and facilitates transport.
Apo lipoprotein A-IV. Apo A-IV is synthesized in the small intestine and protects against atherosclerosis by promoting reverse cholesterol transport from the periphery to the liver. It is an activator of LCAT. The beneficial effect of high plasma apo A-IV levels is illustrated by the inverse relationship between apo A-IV and coronary artery disease in healthy individuals and in uremia.
34 Low apo A-IV also correlates to progression in CKD.
35
Low density lipoprotein. Elevated LDL is not a typical feature in CKD and ESRD (except in patients with nephrotic syndrome). Behind normal LDL concentrations are hidden
qualitative changes, particularly an increased proportion of atherogenic sdLDL and IDL. Not only the activity of lipoprotein lipase, however, but also the activity of hepatic triglyceride lipase is decreased in animal models and patients with CKD.
36,
37 The decreased activities of both lipases cause a major defect in the catabolism of triglyceride-rich lipoproteins. Reduced lipoprotein lipase activity explains the disturbed first step in the breakdown of both chylomicrons (circulating after the absorption of fat from the gut) and of VLDL (synthesized and secreted by the liver). Because of the reduced activity of the hepatic triglyceride lipase, the second step (i.e., the clearance of partially metabolized lipoproteins and chylomicrons) is disturbed as well. The VLDL receptor is expressed in skeletal muscle, the heart, the brain, and adipose tissue, which use fatty acids for energy production or storage. The expression of the VLDL receptor was reduced in experimental uremia.
38 In addition to quantitative changes in lipoprotein particles, several qualitative lipoprotein changes have been demonstrated to occur in CKD. These include postribosomal modification of apos by oxidation, glycation, and carbamylation. Modified lipoproteins are not recognized by their respective receptors.
39 Their half-life in the circulation is increased. The prolonged residence time in the circulation permits their uptake by the nonsaturable scavenger receptor pathway. Oxidation does not reduce the affinity of oxidized LDL to the scavenger receptor, and oxidized LDL uptake by the macrophage scavenger receptor is increased, thus favoring the formation of foam cells. In addition to its pivotal role in foam cell formation, oxidized LDL exhibits additional atherogenic properties, including cytotoxicity and stimulation of thrombotic as well as inflammatory events.
40 LDL oxidation is currently considered as an early key event in the pathogenesis of atherosclerosis. HDL protects against oxidation of LDL. In hemodialysis patients, the capacity of HDL to prevent LDL oxidation is reduced, however.
Lipoprotein (a). Lipoprotein (Lp)(a) is an LDL-like lipoprotein consisting of apo A covalently bound to an LDL particle. The plasma Lp(a) concentrations are strongly determined by genetic factors: individuals with the high molecular weight isoform have lower plasma Lp(a) concentrations and plasma Lp(a) levels begin to start to rise early in CKD. The increase is more delayed in individuals with low molecular weight isoforms. The level of Lp(a) is determined by the degree of proteinuria.
41,
42 Furthermore, the turnover of Lp(a) is reduced, causing increasing residence time.
43 In prospective studies, Kronenberg et al.
44 and Longenecker et al.
45 found in hemodialysis patients that the small apo A genotype predicted coronary events and total mortality.
Predictive Parameters
Disorders of lipid metabolism in chronic kidney disease are not adequately reflected by the simple conventionally measured parameters (i.e., plasma concentrations of total cholesterol, LDL-cholesterol, and triglycerides). The previous parameters do not provide information on further lipid abnormalities, which almost certainly impact on the atherogenic risk: (1) abnormal concentrations of apolipoproteins (low apo A-I and apo A-II; and high apo B, apo C-II, and apo E serum concentrations); (2) postribosomal modification of apolipoproteins by oxidation, glycation, and carbamylation; (3) inflammation-induced alterations of HDL (transforming HDL from an antioxidant to a pro-oxidant lipoprotein); (4) accumulation of IDL and small, dense LDLs; (5) prolonged postprandial persistence of chylomicrons in the circulation; and (6) atherogenic apo A genotypes (
Table 80.3).
Shoji et al.
46 demonstrated that the plasma IDL concentration is an independent risk factor for aortic atherosclerosis as determined by pulse-wave Doppler sonography and proposed non-HDL cholesterol (i.e., the sum of LDL and VLDL cholesterol, as a predictor [target < 130 mg per deciliter]).
Epidemiology
The constellation of (1) high plasma LDL cholesterol, (2) low HDL cholesterol, and (3) high triglycerides increase the risk of cardiovascular atherosclerosis.
47 The correlation between lipid concentrations and cardiovascular (CV) events is not very strong, however, possibly because apos may be more important than the lipid parts of the particles or because prolonged residence time permits the modification of the particles.
The recently proposed index of non-HDL cholesterol reflects the sum of LDL and VLDL particles and appears to be more sensitive. It is a superior predictor of cardiovascular risk (
Table 80.3).
48,
49Dialysis modalities and lipid profile. In hemodialyzed patients, the improvement of dyslipidemia has also been documented in patients with the studies addressing alternative dialysis treatment modalities (e.g., comparing of conventional hemodialysis against hemodialysis using high-flux membranes)
50 and also nocturnal hemodialysis.
51 A randomized crossover study showed that treatment with high-flux polysulfone and modified cellulose membranes significantly lowered serum triglyceride concentration when compared with low-flux dialysis with polysulfone membrane.
In patients treated with continuous ambulatory peritoneal dialysis (CAPD), the concentrations of total plasma cholesterol, LDL cholesterol, and triglycerides are even higher than in hemodialysis patients.
52,
53 Such aggravation is most likely due to two additional factors: a loss of protein (7 to 14 g per day) with peritoneal dialysate and the absorption of glucose (150 to 200 mg per day) from the dialysis fluid. The protein loss may concern not only albumin, but also apolipoproteins, and possibly further lipoprotein-regulating substances, as occurs in the nephrotic syndrome. The glucose load increases the availability of free fatty acids and stimulates the synthesis of triglycerides and lipoproteins by the liver. This hypothesis is supported by the observation that conversion of patients from conventional glucosecontaining dialysis fluids to icodextrin-containing dialysis fluids in the overnight dwell reduced plasma cholesterol concentrations.
54
Dyslipidemia and Outcome—An Example of Reverse Epidemiology
Following the seminal report of Degoulet et al.,
55 numerous investigators found a paradoxical inverse relationship between plasma cholesterol concentration and overall mortality, as well as cardiovascular mortality.
56,
57 Usually a U- or J-shaped relationship was noted between plasma cholesterol concentration and cardiovascular mortality (i.e., a higher mortality at low as well as high plasma cholesterol concentrations).
56 The most plausible explanation for this paradox is that this represents an example of reverse epidemiology
58 (i.e., a relationship that is reversed by a confounding factor). The work of Liu et al.
59 is important in this respect.
59 They identified microinflammation as a major confounding factor. In dialysis patients with low high sensitivity C-reactive protein (hs) CRP concentrations, a direct positive relation was noted between LDL cholesterol and cardiovascular mortality as in individuals with no renal disease. In contrast, in patients with high hsCRP concentrations, the mortality was higher at low LDL cholesterol concentrations.
59 This finding is important because in such circumstances, serum cholesterol and LDL cholesterol concentrations may no longer be a valid guide to establish the indication for lipid-lowering therapy.
Treatment of Dyslipidemia in Renal Failure
In the treatment of dyslipidemia in patients with CKD and ESRD, the best documented intervention of high current interest is the administration of statins. Because of the negative outcome of past intervention trials in dialysis patients (4D and AURORA), the indication for lipid lowering had not been evidence based until recently. There is no doubt that in early stages of renal dysfunction, lipid lowering by statins provides a benefit by significantly lowering cardiovascular events and possibly even the progression of CKD.
60,
61,
62 In dialysis patients, however, the overall outcome (cardiovascular mortality) in two underpowered studies on the use of statins (i.e., atorvastatin in the 4D study
63 and rosuvastatin in the AURORA study
64) was negative. But, after approximately 3 years, there was a delayed nonsignificant tendency for fewer coronary events. A major drawback was that coronary events (the primary treatment target) accounted only for approximately 10% of mortality, whereas the contribution of sudden death and other noncoronary causes of cardiac death was approximately 30%.
Today, the results of the sufficiently powered Study of Heart and Renal Protection (SHARP) have clarified the dilemma. The SHARP study recruited about 8,000 patients (i.e., CKD patients or dialysis patients).
65 A significant overall survival benefit was found in patients treated with atorvastatin (± ezetimibe) and this will be reported soon.
Which other intervention strategies do we have? There is no doubt that dyslipidemia in patients with advanced CKD can be modified by dietary interventions. A reduced intake of saturated fatty acids and carbohydrates reverses VLDL overproduction by the liver and thus lowers plasma triglyceride levels.
66 Caloric restriction will also achieve weight loss and improve lipid levels in obese patients with advanced CKD. Both interventions have not gained universal acceptance,
67 however, because of their obvious side effects, particularly catabolism. Another nonpharmacologic approach is physical exercise, which has been shown to reduce insulin resistance and improve the lipid pattern in CKD patients, just as it does in nonrenal patients.
68 In our experience, however, adherence to this intervention is less than optimal.
What is the role of alternative pharmacologic treatments?
The spectrum of dyslipidemia of renal patients is mainly characterized by low HDL and high triglycerides. This constellation would require an a priori call for medications that increase HDL and decrease triglyceride concentrations.
Current efforts in cardiology target cholesteryl ester transfer protein (CETP) to raise HDL cholesterol levels in order to overcome residual dyslipidemia despite statin therapy.
69 Although the outcome of the effect of torcetrapib on glucose, insulin, and hemoglobin Alc in subjects in the ILLUMINATE study was negative,
70 presumably resulting from “off target” side effects of torcetrapib, novel agents also targeting CETP (e.g., dalcetrapib, anacetrapib) are currently under investigation.
69There are further interesting approaches (e.g., maturation of HDL with the orally absorbable amphipathic apo A-I mimetic peptide 4F).
71The pattern of hypertriglyceridemia associated with lowplasma HDL cholesterol concentration appears, at first sight, as an ideal indication for peroxisome proliferator-activated receptor alpha (PPAR-α) agonists (i.e., fibrates). Fibrates mimic the structure of free fatty acids and increase the HDL cholesterol concentration up to 20%, in part by reducing plasma CETP activity as a result of modulating CETP gene expression through the activation of PPAR-α.
69 Fibrates reduce inflammation markers independently of effects on lipid and glucose metabolism.
72 The problem is that fibrates accumulate in renal insufficiency. Therefore, except for gemfibrozil, the dose must be reduced in CKD patients depending on the level of GFR.
73 Fibrates may cause massive rhabdomyolysis with acute renal failure
74,
75 and deterioration of kidney function even in the absence of rhabdomyolysis.
76 Therefore, fibrates are no longer recommended for treatment in CKD patients.
Nicotinic acid (niacin) lowers elevated concentrations of triglyceride-rich lipoproteins, (i.e., IDL, LDL, and Lp[a]); in addition, it raises HDL dose dependently by up to 30%.
77 Upregulation of apo A-I at HDL-C is the result of (1) the upregulation of apo A-I production, (2) the inhibition of hormone-sensitive triglyceride lipase in adipose tissue, and (3) the reduction of plasma CETP activity. Unfortunately, nicotinic acid frequently causes side effects, particularly flushing and occasionally worsening glucose tolerance and hepatotoxicity Studies investigating the effect of nicotinic acid in hemodialysis patients are sparse.
78,
79,
80 Currently, nicotinic acid analogs with fewer side effects are under investigation.
DISORDERS OF PROTEIN AND AMINO ACID METABOLISM IN CHRONIC KIDNEY DISEASE
Nutrients can be divided into six general classes: proteins, lipids, carbohydrates, minerals, vitamins, and water. The first three classes serve as sources of energy required for carrying out the biochemical and functional activities of organs and cells. In addition to being an energy source, proteins in the diet provide the amino acids that are used to synthesize body proteins. Proteins and their constituent amino acids are essential to life.
The protein requirement of an individual is defined as the lowest level of dietary protein intake that will balance the losses of nitrogen from the body and maintain energy balance at modest levels of physical activity. The need for dietary protein largely arises because turnover of tissue and organ proteins is accompanied by an inefficient capture of their constituent amino acids to form new body proteins. The amino acids are lost via oxidative metabolism. Most estimates of protein and amino acid requirements in humans have been obtained directly or indirectly from measurements of nitrogen balance. In the course of carrying out their functional roles, proteins and amino acids turn over, and part of their nitrogen and carbon is lost via excretory pathways. This includes carbon dioxide in expired air and urea and ammonium in urine. Thus, to maintain an adequate protein and amino acid balance, these losses must be replaced by an appropriate dietary supply of a usable source of nitrogen and by indispensable and conditionally indispensable amino acids. These are required to replace amino acids that are lost during the course of metabolic processes or those that are deposited during growth and tissue replacement. Adults in stable conditions synthesize and degrade approximately 3.5 to 4.5 g of protein per kilogram of body weight (i.e., 245 to 315 g of protein in a 70-kg adult person) each day
81 The protein content of muscle is about 20%. Therefore, the daily protein turnover is the equivalent of 1.2 to 2 kg of muscle. Because protein turnover is so large, even a small increase in protein degradation or a decrease in the protein synthesis rate, persisting for longer periods, can cause a marked loss of lean body mass.
The essential amino acids are valine, leucine, isoleucine, threonine, methionine, phenylalanine, lysine, tryptophan, and histidine. The nonessential amino acids are glycine, alanine, serine, cystine, aspartic acid, glutamic acid, and hydroxyproline. A third category, conditionally indispensable, is based on the observation that under specific dietary conditions, function is best maintained when these amino acids are part of nutrient intake. These conditionally indispensable amino acids are glycine, cystine, tyrosine, proline, arginine, citrulline, glutamine, and taurine.
82Recently, the concept of protein-energy wasting (PEW) has been introduced by The International Society Of Clinical Nutrition and Metabolism.
83 PEW is characterized by the loss of adequate nutrient intake, decreased body protein, and reduced body energy reserves as a cause of malnutrition and/or inflammation. PEW is estimated to be present in 6% to 8% of ESRD patients. The diagnostic criteria for PEW are given in
Table 80.4.
In catabolic conditions, Du et al.
84 identified activation of caspase 3 as the initial step triggering accelerated muscle proteolysis in catabolic conditions of different causes (including fasting, cancer cachexia, streptozotocin diabetes,
and uremia induced by subtotal nephrectomy).
85 A common set of genes (atrogenes) was affected in these catabolic states, including polyubiquitins, ubiquitin ligases, and others, suggesting that different types of muscle atrophies shared a common transcription program.
86
Abnormalities in Plasma and Intracellular Amino Acid Concentrations in Chronic Kidney Disease
Some disturbances in the amino acids’ plasma concentrations are observed in chronic kidney disease even before renal replacement therapy is started.
87 The severity of amino acid abnormalities is related to the degree of chronic kidney disease and the presence of uremic symptoms.
88Plasma concentrations of tryptophan, tyrosine, and the branched-chain amino acids, particularly valine, are low in chronic renal failure
87 and plasma concentrations of citrulline, methylhistidine, and the sulfur-containing amino acids, cystine, and methionine, are high.
87,
89,
90 In summary, plasma concentrations of essential amino acids, with some exceptions, tend to be decreased, whereas plasma concentrations of the nonessential amino acids tend to be increased. The pattern of the plasma amino acid concentrations does not accurately reflect the intracellular pattern.
91 The intracellular concentrations of valine, threonine, tyrosine, and taurine in muscle are decreased
92 as a result of acidosis. The concentrations of phenylalanine, alanine, arginine, and citrulline are increased.
92 The molecular pathways of muscle wasting with CKD have been reviewed by Workeneh and Mitch.
93In CKD patients, low plasma amino acid concentrations and low intracellular amino acid concentrations may be due to: (1) anorexia, (2) decreased amino acid synthesis, (3) increased catabolism, (4) loss during the dialysis procedure, and (5) impaired binding to serum albumin caused by substances that accumulate in the blood in uremia.
As in nonuremic individuals, in CKD patients, poor dietary intake of protein and nutrients leads also to decreased concentrations of such amino acids as histidine, isoleucine, leucine, valine, and tyrosine.
94 In CKD patients, the plasma concentrations of several amino acids are inversely correlated with protein intake.
95In rats with experimental chronic renal disease, the principal cause of low plasma concentrations of branched-chain amino acids (valine, leucine, isoleucine) is increased catabolism.
92 This is stimulated by acidosis and is caused by increased activity of branched-chain keto acid dehydrogenase, a key enzyme in the amino acid degradation pathway.
92 The correction of metabolic acidosis increases the concentration of the previous three amino acids in muscle.
96 Reduced binding by albumin probably accounts for the low total plasma tryptophan concentration.
97 Also, low intracellular levels of taurine with normal or slightly elevated concentrations of this amino acid in plasma are found in CKD patients. Because the plasma concentration of precursors of taurine, such as cystine, methionine, and cystine sulfonic acid are elevated, a selective metabolic block at the level of cystine sulfonic acid decarboxylase has been proposed to explain the decrease in intracellular taurine.
98 In addition, low intracellular levels of threonine and lysine and low ratios of essential to nonessential amino acids (valine-glycine and phenylalanine-tyrosine) have been found in patients with CKD.
99
Protein Metabolism in Chronic Kidney Disease
The detailed observations of renal patients by Richard Bright
100 pointed to an important role of inanition in kidney disease. More recently, a high prevalence of protein malnutrition has been reported in hemodialysis patients as well. Mild-to-moderate protein malnutrition occurs in approximately 33% of hemodialysis patients and severe malnutrition occurs in an additional 6% to 8% of these individuals.
101 The interpretation, however, of what constitutes malnutrition and how it relates to patient outcome remains controversial.
102 Pure-energy protein malnutrition (kwashiorkor) is not associated with accelerated atherogenesis and cardiovascular events. These events, however,
are commonly found in wasted dialysis patients and are associated with markers of microinflammation, such as high hsCRP, low plasma concentrations of albumin and fetuin, as well as high plasma concentrations of interleukin (IL)-6, IL-18, and tumor necrosis factor (TNF)-α.
103 This constellation has been rephrased as the malnutrition, inflammation, and atherosclerosis (MIA) syndrome.
104 It has remained uncertain, however, whether low muscle and body mass per se
105 or rather the process of active wasting have negative effects on outcome.
104 The paradoxical finding that survival is best in dialysis patients with a high body mass index (BMI), even in the range of frank obesity, may indicate that obesity increases tolerance toward episodes of catabolism. Energy expenditure is increased in uremia.
105 In addition, some factors common in uremic patients may trigger catabolism, such as fasting resulting from a loss of appetite. Acidosis or insulin resistance activates the ubiquitin proteasome system as the final common pathway of protein breakdown.
86 It is important that proteolytic mechanisms, not malnutrition caused by loss of muscle mass in chronic renal failure
106 with insulin resistance, triggered the activation of the ubiquitin proteasome pathway as an upstream component.
107 There is also evidence that the dialysis procedure per se is a catabolic stimulus.
108 A study by Pupim at al.
109 confirmed that dialysis causes whole body and muscle proteolysis, which can be overcome, at least acutely, by an intravenous infusion of amino acids, glucose, and lipids.
The rates of synthesis and degradation of proteins can be quantitated by the infusion of either radiolabeled or stable isotopes bearing amino acids. This allows the calculation of total body protein synthesis and total average proteolysis, as well as amino acid oxidation.
110 Patients with stable CKD have been studied using this methodology when ingesting either of two different levels of dietary protein: 0.6 g per kilogram of body weight or 1.0 g per kilogram of body weight. Studies were performed both after overnight fasting and in the fed state. No differences were found in either the rate of protein turnover or the amino acid oxidation as compared to control subjects. Thus, the dynamics of amino acid metabolism are apparently normal at the whole body level in stable, nonacidotic patients with chronic kidney disease.
111In contrast to nondialyzed, stable CKD patients, nitrogen balance studies indicate that hemodialysis patients are unable to conserve nitrogen normally and have increased dietary requirements.
112 The increased protein needs are higher than accounted for by a loss of amino acids, peptides, and proteins into the dialysate. These findings are consistent with the existence of a chronic, low-grade catabolic state in hemodialysis patients. Such a catabolic state may be due to the presence of chronic inflammation, acidosis, insulin resistance, or a combination of these conditions.
113When protein intake is restricted, supplemental calories may improve nitrogen balance.
114 If calorie intake is inadequate in patients eating a low protein diet, the risk of catabolizing body protein is increased.
114
Caloric Requirements in Patients with Chronic Kidney Disease
Inadequate caloric intake may be present when energy requirements are increased, when caloric intake is decreased, or when a combination of both is present.
In a study on 10 hemodialysis patients, Ikizler et al.
108 found 7% higher than expected energy expenditure during both dialysis and nondialysis days, suggesting that uremia per se increases energy expenditure. This conclusion is controversial, however. Monteon et al.
115 measured energy expenditure of CKD patients during rest and exercise; CKD patients did not differ from control subjects. This issue may be clinically important, because a prospective study showed a correlation between high resting energy expenditure and increased mortality or cardiovascular death in patients on continuous ambulatory peritoneal dialysis.
116In CKD patients, caloric intake tends to be decreased.
117 CKD patients do not ingest a prescribed amount of calories despite dietary counseling: in the Modification of Diet in Renal Disease (MDRD) study, initial energy intake was below the recommended limit (30 to 35 kcal per kilogram of body weight per day) and, during the study, energy intake declined further despite intensive dietary counseling.
118
Nutrition in Hemodialysis Patients
Hypercatabolism is common in dialysis patients and is presumably related to an intradialytic loss of amino acids, as well as cytokine activation, particularly IL-6. There is an interesting dichotomy: muscle protein breakdown increases during hemodialysis, whereas whole-body proteolysis is not increased.
119 It has been suggested that avoiding a negative protein balance requires both the provision of nutrients and the inhibition of inflammatory signals.
119 Hypoalbuminemia, negative nitrogen balance, loss of muscle mass, and wasting are commonly seen in long-term dialysis patients.
119 Several tests have been used to diagnose PEW, but they do not exactly measure the same abnormality.
102 The procedures range from the well-known anthropometric measurements, such as skinfold thickness and midarm muscle circumference, BMI, waist-to-hip ratio, to a subjective global assessment. Low plasma albumin concentrations are closely related to mortality,
120 whereas BMI and urine creatinine excretion as an index of muscle mass are not. Even small decrements in plasma albumin concentration (in the range of 3.5 to 3.9 g per deciliter) have been associated with increased mortality in hemodialysis patients. The plasma albumin concentration appears to be a late index of malnutrition. Because of its relatively long half-life (21 days) and the vast capacity of the liver to synthesize albumin, a decrease in serum albumin concentration lags behind the onset of malnutrition by several months.
121 Other indicators of PEW include preal-bumin levels, plasma cholesterol concentrations (< 150 mg per deciliter), decreased plasma transferrin, and a decrease in body weight.
102 Indices of PEW in CKD patients undergoing renal replacement therapy are shown in
Table 80.4.
Factors That Affect Nutritional Status in Chronic Kidney Disease
Several factors contribute to the high prevalence of PEW in CKD patients (
Table 80.5). The catabolic factors that may participate in the pathogenesis of PEW in CKD are (1) metabolic acidosis, (2) inflammation, (3) insulin resistance, (4) dialysate loss of amino acids and glucose losses, and (5) bioincompatibility of dialysis membrane.
Metabolic acidosis is one of the most important factors causing excessive catabolism of amino acids and proteins in CKD patients. Metabolic acidosis activates the specific pathways involved in the degradation of branched-chain amino acids catalyzed by branched-chain keto acid dehydrogenase.
92 It also activates the ubiquitin-proteasome system, the final common pathway of muscle protein degradation.
122 Profound acidemia following the ingestion of ammonium chloride causes cachexia in humans without CKD.
123 Conversely, in CKD patients, correction of metabolic acidosis decreases protein degradation considerably.
124 Long-term therapy with a higher concentration of lactate buffer in peritoneal dialysate caused decreased expression of mRNA encoding ubiquitin in muscle.
125 Correction of metabolic acidosis by oral sodium bicarbonate supplementation in dialysis patients increases plasma albumin concentration and muscle mass,
126 and may even slow down progression in CKD.
127,
128In a sizable proportion of hemodialyzed patients, high plasma concentration of proinflammatory cytokines are found
129 (e.g., high TNF-α, which are known to stimulate protein degradation in muscle). Another factor is insulin resistance. Absence of, and potentially resistance to, insulin stimulates the ubiquitin-proteasome system, that is, the common proteolytic pathway, in muscle.
28The hemodialysis procedure may also be catabolic. Protein breakdown is acutely stimulated during a dialysis session.
105 This effect may be mediated, at least in part, via complement activation by contact between blood and bioincompatible membranes.
130 The use of more biocompatible dialysis membranes may prevent PEW by reducing complement activation. Unfortunately, two long-term, prospective studies on this issue yielded conflicting results,
131,
132 and the issue of the relation between bioincompatibility and malnutrition remains a matter of debate.
A further important factor contributing to malnutrition in CKD patients is a loss of appetite. Changes in the motility and function of the gastrointestinal tract, including gastroparesis, malabsorption, intestinal bacterial colonization, and constipation, are further contributory factors.
Dietary and Energy Intake Recommended in Patients Undergoing Dialysis Replacement Therapy
The recommended nutrient intake for patients undergoing maintenance hemodialysis or peritoneal dialysis is summarized in
Table 80.6.
133
 Computed Tomography and Magnetic Resonance Imaging
 Alport Syndrome, Fabry Disease, and Nail-Patella Syndrome
 Pathophysiology of Nephrotoxic Cell Injury
 Immunoglobulin A Nephropathy and Henoch-Schönlein Purpura
 Monoclonal Gammopathies: Multiple Myeloma, Amyloidosis, and Related Disorders
 Peritoneal Dialysis


