Dialysis is defined as the bidirectional movement of molecules across a semipermeable membrane. During dialysis, solute (molecules dissolved in a liquid) can be removed and subsequently discarded from the body. If this process takes place across an artificial membrane which is in contact with the blood during extracorporeal circulation it is called hemodialysis. Hemodialysis can be performed in treatment centers which specialize in the delivery of dialysis or, alternatively, it can be performed at home.
The ultimate goal of dialysis is to replace the function of the kidney to alleviate signs and symptoms of uremia and rehabilitate patients with end-stage renal disease (ESRD) so that they may lead productive lives. Thus far, methods of renal replacement outside of kidney transplantation have focused on mechanical methods to purify the blood of toxins, balance fluid and electrolyte levels, and correct acid-base disturbances. The downside to the currently available forms of mechanical renal replacement is they do not address the many other important endocrine and immunologic functions of the kidney. Therefore, despite our many technological advances in the field, dialysis by mechanical means does not completely replace kidney function but rather serves as a substitute.
HISTORY
In 1913 Abel, Rowntree, and Turner at Johns Hopkins University performed the first dialysis on dogs using cellulose trinitrate membranes and hirudin for anticoagulation.1 The first human hemodialysis was performed by Hass in 1924 in Germany.2 Hass used the radial carotid artery and portal vein for blood access. In 1943 Kolff developed the rotating drum dialyzer in Holland. Kolff used cellophane membranes (sausage casings) and an immersion bath and reported on the first patient to recover from acute renal failure after treatment. Further work by Kolff would lead to the twin coil dialyzer in 1955.3 In 1946, Alwall developed a system for applying hydrostatic pressure to achieve ultrafiltration allowing for fluid removal from the circulation during dialysis. In 1960 Kiil developed a flat plate dialyzer that could easily be dismantled and reassembled. The Kiil dialyzer consisted of boards of polypropylene and used more permeable cellulosic cuprophane membranes. Due to low internal resistance, a blood pump was not necessary. Meanwhile, Scribner and Quinton came up with a method to heat Teflon to bend it into a U shape. This allowed a connection between the radial artery and cephalic vein in the forearm that could be used for dialysis access.4 Prior to this development, dialysis therapy was largely reserved for the treatment of acute renal failure in a few specialized inpatient centers. The Scribner-Quinton shunt was a crucial step that made long-term dialysis for chronic renal failure a reality. Dialysis technology was further refined in 1963 when Babb developed a central proportioning system for the delivery of dialysate to multiple patients. Access to the bloodstream was improved in 1966 when Cimino and Brescia developed the native arteriovenous fistula. More recent times have seen the development of improved technology such as ultrafiltration control, dialysate proportioning systems allowing the use of bicarbonate based dialysate, improved safety mechanisms, more biocompatible dialysis membranes, high flux dialyzers, simplified home dialysis technologies, and even development of wearable artificial kidneys. Advances by researchers and industry coupled with financial support through government subsidized care have led to the expansion of dialysis as we know it today and have solidified chronic hemodialysis as a feasible life-sustaining treatment for thousands of patients who would otherwise be facing terminal ESRD.
EPIDEMIOLOGY
According to the United States Renal Data System (USRDS) atlas of ESRD report,5 in the year 2008 there were 109,832 new ESRD patients. The rate of ESRD incidence reached 322 per million population for hemodialysis, 20.7 for peritoneal dialysis, and 7.9 for transplant. In the United States, hemodialysis remains the most common form of chronic renal replacement therapy. Hemodialysis as the modality of renal replacement therapy accounted for the bulk of the incident dialysis patients with peritoneal dialysis initiated in only 6,577 patients and renal transplant in only 2,644. Trends over the past few decades have seen increases in percentages of incident hemodialysis patients and decreases or plateauing of the incident patients on peritoneal dialysis. In-center hemodialysis therapies were more frequently utilized with more than 347,000 patients receiving hemodialysis and only 3,826 performing home hemodialysis.
Hemodialysis Outcomes: Morbidity and Mortality
Patients with ESRD are frequently hospitalized for medical complications. Numbers from the USRDS reveal 12.8 hospital days per patient year on hemodialysis (HD), compared with 13.3 hospital days per patient year on peritoneal dialysis (PD) and 5.9 for transplant patients. Over the last few years, hospital admission rates have remained the same for HD (approximately two admissions per year) and declined 9.6% in PD patients. Women appear 16% more likely to be hospitalized than their male counterparts. Common causes for admission to the hospital are cardiovascular complications, infectious complications, and access complications. Admission rates for infection (pneumonia, bacteremia) have risen 19% whereas admission rates for cardiovascular disease have remained similar and admissions for vascular access issues have fallen as more procedures are now performed in the outpatient setting.5
ESRD patients have high mortality rates. Adjusted rates for all-cause mortality in dialysis patients are approximately six to eight times higher than in the general population. Fiveyear probability of survival (1999-2003) among incident ESRD patients was 0.39. This improved 8.4% when compared with 1994-1998. The greatest amount of improvement was seen in the PD population with a 17.6% increase compared with an 8.4% increase in HD patients. There is a large racial disparity in risk for death when comparing Caucasians (21%), African Americans (17%), and other racial groups (14%), with minorities having a clear survival advantage.5
MECHANISMS OF SOLUTE REMOVAL
Removal of solute (molecules dissolved in liquid, such as urea) from solvent (the liquid which contains the molecules, such as the bloodstream) is the major function of dialysis. Removal of solute from the body can be accomplished by diffusion, convection, or osmosis.
Diffusion
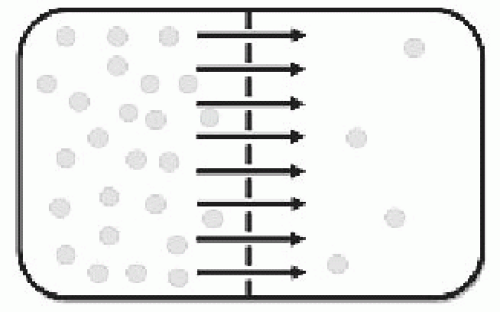
Diffusion is the movement of particles from areas of higher concentration to areas of lower concentration through random motion. In the example of hemodialytic therapy, diffusion is the driving force that is responsible for the movement of solute dissolved in blood (such as urea) across the membrane of the dialyzer to the area of lower concentration, the dialysate (Fig. 84.1).
FIGURE 84.1 Diffusion. If two compartments are separated by a semipermeable membrane (dashed line) solute tends to move down a concentration gradient from areas of high concentration to areas of lower concentration. For example, in the case of hemodialysis, solute (e.g., urea) dissolved in solvent (blood) passes the semipermeable membrane (dialyzer) to an area of lower solute concentration (dialysate).
Convection
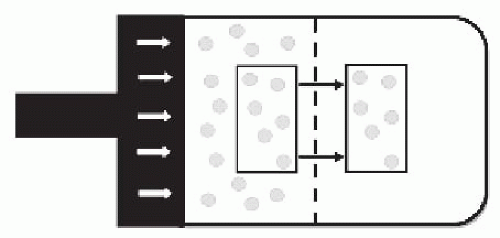
Convection is the movement of molecules within fluids, also known as “solute drag.” Convection occurs in hemofiltration when a transmembrane pressure is applied to the blood side of a membrane forcing plasma water through the pores in the membrane. Any solute dissolved in the plasma water smaller than the membrane pore size is subsequently transported (Fig. 84.2). The ability for a particular solute to be removed through convection is dependent on the solute size and the membrane pore size, compared to the diffusive process where removal is also dependent on concentration gradients. The sieving coefficient describes the membrane passage of a particular solute during convection and can be determined by dividing the concentration of the solute in the effluent by the concentration in the blood. For example, urea (small molecule) generally will have a sieving coefficient of 1 which indicates that the concentration in the blood is equal to the concentration in the effluent whereas albumin, a molecule which is too large to pass traditionally used membranes, will have a sieving coefficient of 0.
FIGURE 84.2 Convection is the movement of molecules within fluid. In the case of hemofiltration, solute (e.g., urea) is dissolved in plasma water. If a hydrostatic pressure is applied to one side of the semipermeable membrane, water will be forced through the pores of the membrane bringing along the solute which is dissolved in it if the solute particles are smaller than the membrane pore size. This is also known as solute drag.
Osmosis
Osmosis is the movement of water molecules across a semipermeable membrane down a water gradient. In other words, osmosis is the movement of water across a semipermeable membrane from an area of low solute concentration to an area of high solute concentration. A clinical example of osmosis is PD where a high dextrose containing fluid is instilled into the peritoneal cavity which creates a osmotic gradient moving water into the peritoneal space.
Ultrafiltration
Ultrafiltration is the movement of fluid across a semipermeable membrane which is caused by a pressure difference. This pressure difference can be a result of osmotic pressure (as is the case with PD) or hydrostatic pressure (as is the case with HD). Ultrafiltration is a form of convective clearance in traditional HD but does not typically account for a significant volume of clearance.
Concept of Clearance in Dialysis
The clearance of a solute is defined as the volume from which the solute is completely removed in a specified period of time and is often expressed in units of milliliters per minute. In HD, the processes of diffusion, convection, and, to a lesser extent, membrane adsorption each contribute to the total clearance of solute. Numerous factors affect the clearance of solute in dialysis including the concentration differences between the blood and dialysate, the rate at which blood is delivered to the dialyzer, and the intrinsic properties of the dialyzer such as surface area, permeability, membrane thickness, pore size, and solute size.
Concentration is the ratio of the amount of solute in a given solvent volume. The clearance of a solute is dependent on the concentration of the solute. It is also important to recognize the relationship between concentration and generation of a solute. Both generation and removal of a solute from the body will affect the concentration and therefore has an effect on clearance. The concept of mass balance and the relationship between concentration, generation, and clearance forms the basis for many of the equations that have been derived to assess the adequacy of dialysis (discussed in more detail below).
DIALYSIS TECHNIQUE
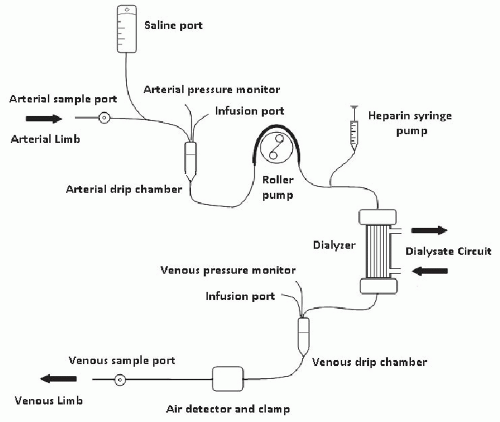
The HD equipment typically consists of a tubing set, dialyzer, and the hemodialysis machine. The tubing set connects the patient’s source of blood access to the dialyzer which contains the semipermeable membrane. The entire circuit is connected to the dialysis machine. After negative pressure is applied to the access by a mechanically driven blood pump on the dialysis machine, blood circulates through the arterial limb of the blood tubing and past the dialysis membrane. It is then sent through the venous limb of the tubing and back to the patient via the vascular access (Fig. 84.3).
Blood Access
Ideally HD is performed through a connection between the arterial circulation and the venous system in the form of an arteriovenous fistula (AVF) or an arteriovenous graft (AVG). The AVF is the preferred form of access. The use of the arteriovenous circulation allows intradialytic blood flows that can easily support achieving adequate solute clearance during the dialysis procedure. In the case of the AVF and AVG, needles are placed into the access during each dialysis session. Hemodialysis needles range in size but usually are 17 to 15 gauge with larger needles (15 g) being used in stable accesses with lower risk of bleeding and smaller needles (17 g) used in situations of small diameter access, developing accesses (especially for first cannulation), or higher bleeding risk. Typically two needles are placed in the access, one needle for the inflow to the dialysis machine, and the other needle for the outflow from the dialysis machine. Single needles with a dual lumen are also available but are rarely used due to a higher degree of access recirculation.
The buttonholing technique of dialysis access is sometimes used in patients with an AVF. Through this technique, the AVF is accessed in the same location at the same angle during each dialysis session, preferably by the patients themselves or by the same dialysis caregiver. Over time, the patient develops a scarred tract that eventually allows for the placement of blunt needles down the tract after removal of the scab that serves as a plug. Once established, buttonholes have the advantage of ease of obtaining access, less pain, reduced aneurysm formation, and reduced incidence of hematoma formation.6 The downside of buttonholes is higher rates of infection, particularly, Staphylococcus aureus bacteremia. This increased risk may be mitigated by diligent topical care and the use of agents such as mupirocin.7
Catheters placed in the central veins can also be used for dialysis access. Typically these catheters are placed within the internal jugular or femoral vein. The subclavian vein position is associated with greater rates of central stenosis and should be avoided if possible.8,9 Catheters are less desirable than AVF or AVG due to increased rates of infection,10 clotting,11 recirculation,12 poor blood flows,13 and higher potential to cause stenosis of the central veins.14 Catheters that are tunneled and cuffed have lower rates of infectious complications than noncuffed, nontunneled catheters, and, when possible, are preferable in patients who have an anticipated need for dialysis that is longer than 2 weeks.15
FIGURE 84.3 Drawing of a hemodialysis circuit. Blood flows from the patient access into the arterial limb of the circuit, passes the dialyzer, then is delivered to the venous limb and back to the patient. Note that the location of the arterial drip chamber, which is drawn prepump in this picture, is occasionally postpump in some designs. The location of the infusion ports and sample ports can vary as well.
Blood Circuit
The blood circuit is composed of tubing which carries blood from the patient access through the dialyzer and back to the patient. There are two main portions of the dialysis circuit: the arterial and venous limbs. The arterial limb carries blood under negative pressure provided by the blood pump from the access to the dialyzer. It usually includes a drip chamber which serves to remove air from the dialysis circuit. The arterial pressure monitor is frequently located at the top of the arterial drip chamber and blood flows out of the bottom of the drip chamber toward the blood pump. The blood pump is commonly designed in a circular roller fashion that squeezes segments of blood through a portion of arterial tubing as the rollers apply pressure to the line. This configuration leads to an irregular vacillating flow of blood through the circuit. The portion of the arterial limb tubing that comes in contact with the rollers from the pump is reinforced to withstand the extra stress applied by the rollers. The blood pump typically operates at speeds ranging from 150-500 mL per min. There is usually a branching line that connects to an automated heparin syringe pump, typically located after the blood pump.
After the blood passes through the arterial circuit it is delivered to the dialyzer. Post dialyzer the blood enters the venous circuit. Similar to the arterial limb, the venous limb also has a drip chamber and pressure monitor. Furthermore, the venous limb has an air detector and a portion of line which passes through an automated clamp. If air is detected in the venous line, the clamp will be triggered, preventing delivery of air to the patient. This portion of equipment is crucial as an air embolus is a potentially lethal complication. The arterial and venous pressure monitors play an important function in monitoring the progress of dialysis. Arterial pressures are typically negative with pressures ranging from -80 to -200 mm Hg. Venous pressures are usually positive, ranging from 50 to 250 mm Hg. Pressures that fall outside of the acceptable ranges should trigger machine alarms that will stop the blood pump. Tables 84.1 and 84.2 list potential reasons for arterial and venous pressure alarms, respectively.
The ideal tubing set has a smooth inner surface to reduce blood turbulence, is biologically compatible to prevent allergic reactions, and does not narrow or kink. Care should be taken to ensure that the tubing is rinsed completely prior to initiation of dialysis especially in the case of tubing that is sterilized with ethylene oxide. Failure to do so can result in an allergic reaction. For example, if there is a faulty or misplaced clamp on a side branch of the circuit, such as the heparin branch, ethylene oxide can backfill into the tubing during rinsing and later is delivered to the patient.
TABLE 84.1 Arterial Pressure Alarms
Arterial Pressure (normal -80 to -200)
Potential Problem
0 to -80
Pump speed too low
Arterial needle dislodged
Saline line open
-200 or more negative
Kink in line or catheter ports
Catheter or needle placement suboptimal
Clotting of access
Vasospasm
Infiltration
Low patient blood pressure
Shear stress applied to blood in dialysis tubing has been associated with hemolysis and should be avoided. Narrowing or kinking of the blood tubing can cause hemolysis.16 In the past faulty tubing sets were linked to outbreaks of hemolysis in patients on dialysis.17 High blood flows using small gauge needles,18 excessively negative arterial pressures, and misalignment of the blood tubing with the blood pump can theoretically cause hemolysis as well.
Dialyzer
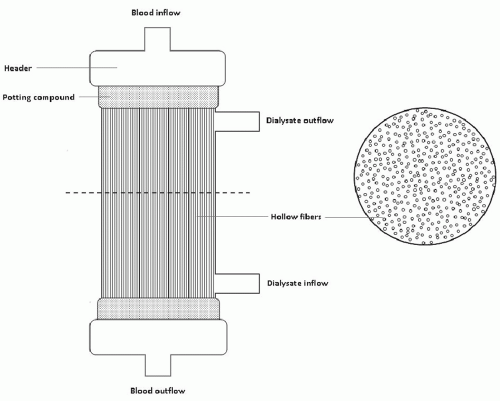
The dialyzer is a crucial portion of the hemodialysis apparatus that provides a site for solute transport. Dialyzers are composed of blood and dialysate compartments. These two compartments are separated by a semipermeable membrane and form a closed self-contained system. Although dialysis membranes initially used the parallel plate design, the hollow fiber design is now used almost exclusively (Fig. 84.4). Hollow fiber dialyzers consist of a cylindrical plastic shell. At the opposing ends of the cylinder are headers which provide ports for the blood flow. Blood flows through the header to the potting compound which encases thousands of tiny hollow fibers through which the blood flows. On the side of the cylinder are two ports for the dialysate connections. Blood and dialysate flows are typically run in opposite directions (countercurrent) to improve clearance, but can be run in the same direction if less solute clearance is desired. The hollow fibers are the site of diffusion and convection as each of the hollow fibers contain pores which allow the passage of molecules.
Dialysis membrane biomaterials can be divided into four different types: cellulose, substituted cellulose, mixed cellulose synthetic, and pure synthetic. Cellulose membranes are formed from plant (usually cotton) polysaccharide. They are considered to be less biocompatible and are therefore now used less frequently. Substituted cellulose membranes are formed by removing free hydroxyl groups from cellulose membranes. The removal of these hydroxyl groups attenuates complement activation and therefore is more biocompatible. Cellulosynthetic membranes are cellulose membranes with a synthetic material (tertiary amine structure) added to the surface. Pure synthetic membranes do not contain cellulose materials and are the most commonly used membranes today.
TABLE 84.2 Venous Pressure Alarms
Venous Pressure (normal 50-250 mm Hg)
Potential Problem
<50
Pump speed too slow
Postpump clotting (clotted dialyzer)
Dialyzer membrane rupture
Kink in line (postpump, prepressure monitor)
Venous needle or catheter dislodged
>250
Access stenosis
Kink in line or catheter (postpressure monitor)
Catheter or needle placement suboptimal
Venous drip chamber clotting
Clotting of access
Access hematoma formation
Access vasospasm
Bad arm positioning
Pump speed too fast
Dialyzer solute clearance characteristics are primarily dependent on surface area and porosity. Dialyzer properties are provided by the manufacturer via dialyzer specification sheets. It is worthy to note that reported clearance data for the dialyzer is based on in vitro testing which tends to overestimate in vivo clearances. It is also important to note that clearance is affected by blood flow, therefore analysis of clearance at varying blood flows is of relevance. In general, the clearance values provided by the manufacturer can give the practitioner an idea of the performance of a particular dialyzer. For example, urea can be used as a marker of small molecule removal, whereas clearance values for B12 provide information about the middle molecule removal. Flux refers to the ability to remove or ultrafilter plasma water. High-flux dialyzers have larger pores capable of removing greater volumes of plasma water. This is denoted by the ultrafiltration coefficient, or Kuf, of a dialyzer. Low-flux dialyzers have a Kuf of <10 mL/h/mm Hg and high flux dialyzers >20 mL/h/mm Hg. High-flux membranes, by nature of their larger pore sizes, also have higher clearance of middle molecules with sizes similar to molecules such as vitamin B12 (MW ˜1400 Da) and β2-microglobulin (MW ˜ 12000 Da). The efficiency of a dialyzer refers to its ability to remove small molecular solutes such as urea; this is usually denoted by the KoA of urea. The KoA is related to the clearance of a dialyzer (Ko) and the surface area of the dialyzer (A). It should be recognized that the manufacturer-provided clearance values for different dialyzers at different blood flows can be useful to help compare performance, but cannot reliably be used to calculate the dose of dialysis.
FIGURE 84.4 Hollow fiber dialyzer. In modern times nearly all dialysis setups utilize hollow fiber dialyzers as the membrane site of dialysis. The dialyzer is usually designed as a cylindrical tube which encases hollow fibers. The fibers serve as semipermeable membranes. Blood flows through the cavity of the hollow fiber and dialysate bathes the outside of the fibers. The fibers are held in place by the impermeable potting compound and the dialyzer is capped off by two headers which also serve as the site for the blood hookups. The dashed line above indicates the site of cross-section that is illustrated on the right. Note that blood and dialysate usually run in a countercurrent (opposite) direction to optimize exposure of the blood to fresh dialysate and improve clearance; however, dialysate can also be run in the same direction as the blood if less efficient therapy is required.
The priming volume of the dialyzer and the sterilization method of the dialyzer will also be listed in the dialyzer specifications. The average priming volume ranges from 50 to 150 mL. Sterilization methods of dialyzers include ethylene oxide, gamma beam radiation, and heat/steam sterilization. Sterilization with ethylene oxide has fallen out of favor due to increased rates of allergic reactions. Certain dialyzers can be reprocessed and reused. Reused dialyzers are cleaned with bleach, hydrogen peroxide, or peracetic acid and sterilized with formaldehyde, glutaraldehyde, or heat. Before reuse, the dialyzers have to be tested for residual chemical agents and ability to withstand pressure. Fiber bundle volume is also calculated to ensure the dialyzer has an adequate number of patent hollow fibers to achieve adequate solute clearance. This process can be tedious and labor intensive and can sometimes outweigh the cost of the dialyzer—as a consequence, many dialysis units choose single-use dialyzers.
Dialysate Circuit
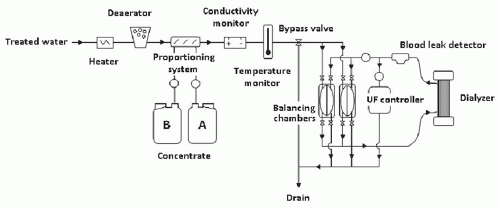
The main components of a typical dialysis circuit include the dialysate concentrate, the water input, a proportioning system, and a volumetric control system. The dialysate circuit is usually fitted with monitors including the conductivity monitor, temperature monitor, and a blood leak detector (Fig. 84.5).
FIGURE 84.5 Drawing of the typical components in a dialysate circuit. Treated water is heated to an appropriate temperature (˜35.5°-38°C) and any air bubbles in the water are removed by the deaerator. The water is then mixed with concentrate. In dynamic proportioning systems bicarbonate is usually added followed by the acid concentrate through the proportioning system. The mixed product is then tested by the conductivity monitor and tested to ensure that temperature is appropriate. pH sensors are also sometimes used. If the product is not within acceptable conductivity or temperature range the bypass valve is opened and the dialysate is delivered to the drain preventing delivery to the patient. If the product passes the tests, then it is delivered to the balancing chambers. The balancing chambers are an intricate set of chambers separated by impermeable membranes and inflow and outflow valves. The purpose of the balancing chambers is to balance dialyzer inflow with dialyzer outflow to ensure that the amount of dialysate entering the dialyzer and the amount leaving the dialyzer are equal. The ultrafiltration (UF) controller uses pressure measurements and a separate pump to remove any additional desired volume from the dialyzer effluent. The blood leak detector located on the effluent outflow tract serves to ensure dialyzer membrane integrity.
The job of the proportioning system is to take pretreated pure water and mix it with the bicarbonate and acid concentrates to make final dialysate for delivery to the dialyzer. The common range of components for bicarbonate dialysate are listed in Table 84.3. The level of sodium or bicarbonate in the dialysate can be adjusted by the proportioning system from input provided to the dialysate machine, whereas the concentration of the other electrolytes such as potassium and calcium are relatively fixed and require a change in the concentration in the concentrate. Dialysis machines rely on conductivity to test the dialysate and appropriately proportion the bicarbonate concentrate, acid concentrate, and water prior to delivery to the patient. The flow of electricity through solution is proportional to the amount of ions dissolved in the solution. Pure water is a poor conductor of electricity and salty water conducts electricity more readily. The conductivity monitor ensures that the conductivity of the dialysate, and therefore the overall electrolyte concentrations, are within the appropriate range. If out of range, the dialysate is delivered to the drain via a bypass valve. Machine alarms due to altered conductivity usually represent either inaccurate input of the concentrations of electrolytes in the concentrate, an inappropriately calibrated machine, or problems with the water purification system. These alarms can indicate malfunction of proportioning or contaminated water which can be potentially fatal to the patient if the bypass system is not evoked.
TABLE 84.3 Typical Dialysate Composition Ranges
Sodium (mEq/L)
130-145
Potassium (mEq/L)
0-4
Chloride (mEq/L)
98-112
Bicarbonate (mEq/L)
30-40
Magnesium (mEq/L)
0.5-1.5
Calcium (mEq/L)
2.5-3.5
Glucose (mg/dL)
100-200
In most dialysis machines, treated water flows through the dialysate circuit at a constant rate and bicarbonate concentrate is metered into the water at a ratio around 1:20 to 1:30. After mixing of the bicarbonate with the water there is a conductivity check, then the acid concentrate is metered and added to the water in a ratio around 1:33 to 1:45. The product dialysate then undergoes further conductivity testing. It is important to understand that current dialysis technology is not sophisticated enough to measure the exact concentration of electrolytes in the dialysate but rather it relies on conductivity to ensure the correct preparation of dialysate. For example, if a lower bicarbonate concentration is desired in the dialysate then the bicarbonate pump will deliver less of the bicarbonate concentrate to the water stream, therefore, there will be less sodium delivered as well. In order for the machine to prepare dialysate with appropriate conductivity it will need to deliver additional sodium from the acid concentrate, subsequently, other cations in the acid concentrate will also be delivered in a larger proportion as well (e.g., potassium and calcium).
The volumetric control system regulates the amount of plasma water removed (ultrafiltration) during dialysis. It consists of an intricate set of valves coupled with balancing chamber(s), an ultrafiltration pump, pressure monitors, and a computerized ultrafiltration controller. If no ultrafiltration is desired, these components act together to ensure that the amount of fluid entering the dialyzer matches the amount of fluid that leaves the dialyzer. If fluid removal is desired, the amount of fluid in the dialyzer outflow will exceed the dialysate input.
Other safety systems included in the dialysate circuit include the temperature monitor, the blood leak detector, and sometimes a pH detector. Standard dialysate temperature is around 37°C. Lower temperature is associated with shivering and discomfort but may reduce intradialytic hypotension. Higher temperatures (> 42°C) can lead to protein denaturation and hemolysis.19,20 The blood leak detector serves as a method to detect the presence of blood in the dialysate. Given that dialysate water is not sterile, blood should not come in direct contact with the dialysate. If there is a rupture in the dialysis membrane blood will be found in the dialysate effluent. Additionally, high levels of myoglobin or hemoglobin in the dialysate effluent can set off the blood leak detector if a significant amount of pigment is able to pass through the membrane.
Methods of Dialysis
Traditional Intermittent Hemodialysis
In traditional intermittent hemodialysis (IHD) blood flows through a dialyzer at rates from 300 to 500 mL per min against countercurrent flow of dialysate at 500 to 800 mL per min. Typically this is done in 4-hour treatments three to four times weekly. Solute removal in IHD is predominantly from diffusive clearance. Ultrafiltration is usually performed concurrently for volume removal. The resulting convective removal of solute by ultrafiltration is only a small fraction of the overall clearance.
Slow Low Efficiency Dialysis
Slow low efficiency dialysis (SLED) or sustained low efficiency dialysis is an option for patients who are hemodynamically unstable and would not otherwise tolerate traditional intermittent hemodialysis. With SLED, the speed and efficiency of dialysis is decreased and this decreases the rate of osmolar shifts while still providing for solute removal and volume removal if necessary. Blood pump speeds are typically 100 to 200 mL per min and dialysate flows 100 to 300 mL per min. SLED is typically done for longer periods of time or continuously with lower rates of ultrafiltration (0-400 mL per hr), and is primarily used in inpatient hospital settings for the treatment of acute kidney injury (AKI).
Hemofiltration
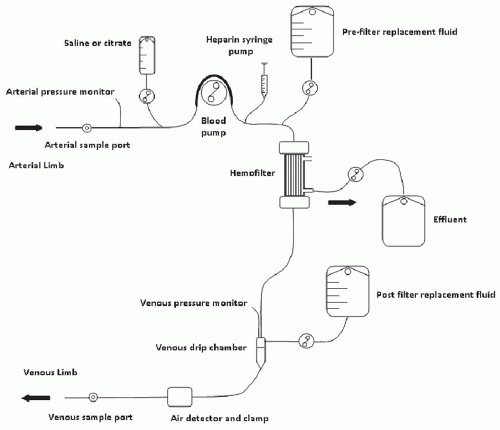
In hemofiltration (Fig. 84.6) large quantities of plasma water are removed with ultrafiltration by hydrostatic pressure (typically 1-5 L per hr). There is no dialysate, thus, diffusive clearance is nonexistent and resulting solute clearance is primarily convective. Blood pump speeds can vary from slow (100 mL per min) to speeds similar to IHD. The large amount of ultrafiltration performed necessitates use of a replacement fluid; otherwise, plasma volume would be rapidly depleted using this technique. Replacement fluid is added back to the blood circuit either pre- or postfilter (or both). The replacement fluid needs to be sterile or “ultrapure” as it will be delivered directly to the patient. Hemofiltration can be intermittent or slow and continuous. Slow continuous hemofiltration is also known as continuous arteriovenous hemofiltration (CAVH) or continuous venovenous hemofiltration (CVVH). CAVH requires arterial access and has fallen out of favor in recent years. These continuous techniques are primarily used for the treatment of critically ill patients with AKI.
Typically the dose of replacement fluid is set in liters per hour. The ideal dose is controversial but, in general, around 20 to 35 mL/kg/hr is recommended. Care should be taken to account for the difference between the actual delivered dose and the prescribed dose as the two can often be off by 20% due to a variety of technical and logistic problems such as breaks in therapy and clotting issues.21 There does not seem to be any improvement in outcomes when using higher delivered dosages (>30 mL/kg/hr) for AKI.21,22,23,24 Volume removal in hemofiltration can be achieved by decreasing the amount of replacement fluid given back to the patient in relation to the amount of fluid that is removed.
Hemodiafiltration
Combining diffusive clearance with large amounts of convective clearance (in other words, combining hemofiltration with dialysis) is termed hemodiafiltration. With hemodiafiltration, both use of dialysate and ultrapure replacement fluid administration are necessary. If performed continuously, hemodiafiltration is termed continuous veno-venous hemodiafiltration or CVVHDF (also CVVHD). Hemodiafiltration can be used for the treatment of ESRD and is also frequently used continuously for critically ill patients with AKI.
Pure Ultrafiltration
In patients who require fluid removal without solute clearance, removal of plasma water alone or ultrafiltration can be performed. Fluid removal without simultaneous dialysis has the added benefit of conferring more hemodynamic stability as osmolar shifts are not taking place in the circulation due to lack of diffusive clearance. For patients who are particularly hemodynamically unstable, slow continuous ultrafiltration (SCUF) is an option. With SCUF blood flows are typically 100-200 mL per min with fluid removal (ultrafiltration rate) ranging from 100-500 mL per hr as tolerated. Small amounts of convective clearance of solute occur with this technique but not at a level that is clinically significant. Pure ultrafiltration or SCUF has also been termed aquaphresis by non-nephrologists.
FIGURE 84.6 Drawing of a hemofiltration circuit. Blood enters the arterial limb from the patient dialysis access and flows through a hemofilter where plasma water and solute that is smaller than the hemofilter pore size passes the membrane via convection and is discarded in the effluent bag. Blood then continues to flow through the venous limb and back to the patient. To achieve meaningful clearance of solute, large volumes of plasma water removal are required, thus the need for replacement fluid to prevent excessive volume removal from the patient. Replacement fluid can be delivered prefilter, postfilter, or both pre-and postfilter as illustrated. Anticoagulation options typically include either heparin delivered by a syringe pump or citrate delivered to the arterial limb by a separate pump. Note that the illustration only shows a hemofiltration setup which is similar to setups used for continuous venovenous hemofiltration (CVVH). Many different arrangements are available. If dialysate is hooked up to the filter, the technique can be modified to perform dialysis at the same time as hemofiltration, also known as hemodiafiltration.
Water Treatment Systems
To perform hemodialysis, a large amount of pure water is needed. At a dialysate flow rate of 500 to 800 mL per min a standard 4-hour dialysis session will require 120 to 192 L of water. Inpatient and outpatient dialysis units operate using water treatment systems that are able to meet this demand for water (Fig. 84.7). Regular city or well water can contain many contaminants. Some of these contaminants include particulate matter such as sand, clay, and plant matter or metals such as copper, zinc, and lead which can be leeched from pipes during water transport. Water obtained in proximity of agriculture may be contaminated with fertilizers and pesticides. Further, heath authorities of city water systems frequently add agents to water to make it safer or more palpable for consumption. Chlorine and chloramines are added to control microbial contamination, fluorides for dental prophylaxis, and occasionally aluminum sulfate and iron salts are added as flocculating agents to decrease water turbidity.25 These contaminants and additives need to be removed from the water source prior to being used in the production of dialysate.
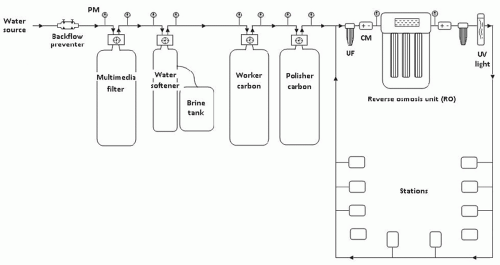
FIGURE 84.7 Simplified drawing of the components of a typical direct feed water treatment system. Arrows indicate the direction of flow. City water enters the system and runs through a backflow preventer. Pressure is monitored (PM) at multiple points in the circuit to ensure filtration integrity of the various components. Conductivity monitors (CM) are placed before and after treatment with the reverse osmosis unit. Ultrafilters (UF) and a ultraviolet (UV) light are placed in the loop to prevent microbiologic contamination. Water not used at the dialysis stations in the loop is returned to the circuit pre-RO for reuse. Not drawn but occasionally included in the water treatment system is the storage tank (for indirect feed systems), pressure tank, booster pump, and acid feed system.
Treatment guidelines for water purification have been set by the Association for the Advancement of Medical Instrumentation (AAMI) and the European Pharmacopeia. Water treatment systems can vary among institutions and differ based on water supply and local requirements. The water purification circuit generally consists of a back flow preventer, multimedia filter, water softener, activated carbon filters, and a final purification device which can be a de-ionizer or more commonly a reverse osmosis system. The backflow preventer serves to keep water in the circuit from regurgitating into the plumbing circuit of the building. The multimedia filter contains sand and gravel of varying sizes and serves to remove large particulate matter and debris from the water. The water softener contains anion exchange beads which exchange calcium and magnesium in the city water for sodium from the brine tank. Carbon tanks remove chlorine and chloramines from the city water. After passing through these initial steps the water is sent to the final purification unit. Reverse osmosis (RO) is a filtration process by which water is actively forced through a membrane with very small pore sizes that do not allow solute (including sodium) and other organic matter to pass through. De-ionization, an alternative to reverse osmosis, uses an ion exchange process to form water. Supply water percolates around cationic and anionic exchange resins which exchange hydrogen and hydroxide ions for other ions. The H+ and OH— ions then form pure water. De-ionization is effective in removing inorganic ions but has the downside of ineffective removal of organic contaminants and potential bacterial contamination. Water also can be passed through a UV light and ultrafilters to aid in the sterilization process. Once purified, typically, water is sent through a loop which feeds dialysis stations. Depending on the dialysis machine, there may also be a filter at the machine for the dialysate after the water has mixed with the concentrate.26,27
Water Quality Issues
Clinical events can manifest when there is a problem with chemical or microbiologic impurities in water. Aluminum, chloramines, and fluoride intoxication have been reported in recent years in hemodialysis units. Aluminum toxicity can lead to progressive central nervous system (CNS) effects, anemia, and low turnover bone disease. High levels can lead to permanent CNS toxicity, dementia, and even death.27 Blood exposure to chloride and chloramines in the dialysate can lead to symptoms of nausea, vomiting, hypotension, dyspnea, and hemolytic anemia. Patients with hemolysis may present with dark blood in the hemodialysis line. Chloramines are not completely removed by de-ionization or reverse osmosis and require functional activated charcoal columns for removal. Charcoal columns can be exhausted over time and if water flow is too rapid through them, chloramines can pass into the product water. For this reason, purified water for dialysis should be checked every dialysis shift or every 4 hours for chloramines to ensure that this complication is avoided. Fluoride is removed by reverse osmosis and de-ionization. However, if the de-ionizer becomes saturated, large quantities of fluoride can be released into the water as the anion resin preferentially exchanges bound fluoride for anions of higher affinity such as chloride. In the body, fluoride binds to calcium and can disrupt cell membranes leading to hyperkalemia. Toxic effects of fluoride can manifest with pruritus, painful gastrointestinal (GI) symptoms, syncope, tetany, neurologic symptoms, cardiac arrhythmia, and death.28
Dialysate water does not have to be sterile because the dialysis membrane does not have pore sizes large enough for transport of microbes. Even so, water-related febrile reactions and related inflammatory problems can occur if the water is excessively contaminated with microorganisms, lipopolysaccharides, or endotoxins. The AAMI recommends that water used for dialysate has less than 200 colony forming units (CFU) per milliliter of water. The European Pharmacopeia guidelines are more strict, recommending less than 100 CFU per mL. Water contaminated with high levels of endotoxins or lipopolysaccharides can cause fevers, chills, and systemic inflammatory response. The acceptable level for endotoxin measured by the LAL test is less than 0.1 EU per mL.27,29
The term “ultrapure dialysate” describes fluid that is nearly free of bacteria and endotoxin but should not be confused with sterile fluid which is completely free of pyrogen and bacteria. Ultrapure dialysate has been suggested as beneficial in dialysis patients due to a decreased burden of microbial contamination resulting in less inflammatory response.30 Ultrapure dialysate water contains bacterial concentrations less than 0.1 CFU per mL if standard techniques are used or less than 0.03 IU per mL if sensitive assays are used.31 Improving water purification methods have allowed for more interest in online generation of replacement fluid for hemofiltration or hemodiafiltration.32,33 These techniques usually involve an extra ultrafilter at the dialysis machine to generate ultrapure replacement fluid for infusion into the patient.
Uremic Toxins
Uremic retention compounds are usually classified by molecular weight and degree of protein binding. Many of the known uremic toxins are generated by metabolism of proteins and by modification of amino acids by gut microbes.
Urea, measured by blood urea nitrogen (BUN), is a low molecular weight solute (60 daltons) which is linked to protein metabolism and has been used as a surrogate marker for small, water soluble uremic toxins. Urea itself is not highly toxic and its generation is influenced by many factors such as dietary intake and liver function. In current practice, urea is the predominant marker used to evaluate clearance in dialysis and urea clearance is accordingly associated with dose of dialysis or dialysis adequacy. However, the clinical picture of uremia is complex and involves more than just small molecules.
Middle molecules (500 daltons to 60 kDa) have also been suggested as an important component of the uremic syndrome.34 This proposal was based, in part, on the observation that peritoneal dialysis patients did quite well with high BUN and creatinine levels and the peritoneal membrane is more permeable to middle size molecules than the dialysis membranes used early on in dialytic therapy.35 Most middle molecules are peptides. Clearance of middle molecules has improved in recent years with the use of high-flux dialyzers that have larger pore sizes. Clearance of middle molecules can also be improved by lengthening treatment time. Further, convective methods of clearance are gaining in popularity and are more effective than diffusive methods for clearance of middle molecules. The prototype middle molecule is β2-microglobulin (12 kDa). Many of the middle molecules are involved in leukocyte, endothelial cell, smooth muscle cell, and/or thrombocyte function and therefore they likely have an impact on cardiovascular health.36
Protein-bound uremic toxins can be of variable size but due to their binding to large molecular weight plasma proteins such as albumin (68 kDa), they are not well cleared with current dialysis technology. Only the smaller, free fraction of these solutes is cleared with diffusion or convection. Phenols, indoles, hippurates, and advanced glycation end products are some examples of uremic toxins that are protein bound.37 Many uremic toxins, protein bound and otherwise, appear to be generated in the gastrointestinal tract as a result of altered intestinal absorption of nutrients in the uremic state leading to changes in gut flora and microbial metabolism.38
Urea as a Marker of Dialysis Adequacy
Single Pool Kt/V (spKt/V)
To quantify the effect dialysis has on the removal of urea over time we can multiply clearance (K, mL/min) by time (t, min) which gives us the expression Kt which is a volume (mL) cleared. To generalize this expression among patients, Kt can be normalized to the volume of distribution of urea or total body water (V, mL) which results in a dimensionless expression of Kt/V.39 In hemodialysis, this can be thought of as a ratio of the volume cleared of urea to the volume of distribution of urea. In other words, a Kt/V of 1.0 means that a volume of blood equal to the volume of total body water was cleared of urea. The clearance of urea from the blood over time during dialysis follows an exponential pattern. The following equation models the clearance of a substance from the body where that substance decreases in an exponential fashion:
Kt/V = ln(Cpre/Cpost)
where Cpre is predialysis urea and Cpost is postdialysis urea. This simplified equation provides the basis for urea kinetic modeling. It should be noted that it does not take into account the minimal generation of urea that happens during dialysis, nor does it take into account fluid that is removed with ultrafiltration during dialysis (changing V). It also assumes that the postdialysis urea is equilibrated across all body compartments or a “single pool.” This is an erroneous assumption as urea is not distributed equally throughout all body compartments, especially during dialysis with high blood and dialysate flow rates. Other more complex formulas attempt to improve on accuracy and can also be used for the calculation of single pool Kt/V (Table 84.4). 40
Equilibrated Kt/V (eKt/V)
The concentration of solute removal will be the greatest in the compartments of the body which have the largest amount of blood flow in continuity with the dialysis access—for example, the cardiopulmonary circuit. Other less well perfused areas such as the peripheral capillary beds will equilibrate urea more slowly with the vascular space. The method described above for calculation of Kt/V is the single pool method (spKt/V). This method treats the volume of distribution of urea as if it was a single pool that urea moves in and out of easily. In reality this is not true as solute gradients form between the various body compartments during dialysis and equilibration occurs in a delayed fashion after dialysis is complete. Although access recirculation and the cardiopulmonary circuit are quickly equilibrated, movement from less well perfused areas and cellular compartments continues for up to 60 minutes after dialysis.41
Keeping the phenomenon of recirculation in mind, it becomes important to be consistent about the timing of the postdialysis sample. Although measuring the urea concentration 60 minutes after dialysis would allow for equilibration to occur, this expenditure of patient and staff time is not practical in everyday practice. Alternate methods have been developed to estimate the degree of equilibration which are not so time consuming. In one such method ultrafiltration is stopped and the blood pump is slowed to 100 mL per min for 10 seconds, after which a sample is drawn from the arterial port. This maneuver allows for access recirculation to resolve and will yield a measurement that can be used in the calculation of the spKt/V. To account for equilibration of urea between body compartments after dialysis, equations have been developed to estimate the equilibrated Kt/V (eKt/V).42 These equations (Table 84.5) were developed to serve as estimations extrapolated from urea rebound curves. The lack of significant cardiopulmonary recirculation in patients dialyzing with catheters necessitates the use of a separate formula.
TABLE 84.4 Formulae for the Calculation of Single Pool Kt/V
Kt/V = (4 × URR) – 1.2
Kt/V = 1.18 × -ln(R)
Kt/V = 2.2 – 3.3 × (R – 0.03 – UF/W)
Kt/V = -ln(R – 0.03) + (4 – 3.5 × R) × UF/W
Accuracy of formulae increases from top to bottom.
URR, pre-post BUN/pre-BUN; UF, volume of fluid removed (L);
From Daugirdas JT. Chronic hemodialysis prescription: a urea kinetic approach. In: Daugirdas JT, Ing TD, eds. Handbook of dialysis. 2nd ed.
Boston: Little, Brown and Company; 1994:92; with permission.
TABLE 84.5 Formulae for the Calculation of Equilibrated Kt/V42
Arteriovenous access
eKt/V = spKt/V – 0.6(K/V) + 0.03
Venous catheter
eKt/V = spKt/V – 0.47(K/V) + 0.02
Standard Kt/V
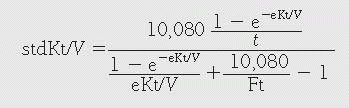
Measuring the single pool Kt/V (spKt/V) or equilibrated Kt/V (eKt/V) provides data for a single dialysis treatment, and this has limited value for comparing different treatment frequency strategies or for comparing peritoneal dialysis to hemodialysis. In an effort to quantify the dose of dialysis that is delivered continuously, the standard Kt/V (stdKt/V) was developed.43,44 One can think of the standard Kt/V urea as a continuous clearance over a week of therapy rather than an intermittent clearance, similar to continuous urea clearance provided by residual renal function. The clearance is calculated based on the mean (peak) urea concentrations and the generation rate of urea over a week. It is then normalized to the volume of distribution of urea. This method of quantifying dialysis dose has utility particularly when comparing (or standardizing) patients on continuous therapies such as peritoneal dialysis or those who are receiving more frequent hemodialysis. Equations for calculation of stdKt/V are described in Table 84.6.44,45
Urea Reduction Ratio
Compared to formal urea kinetic modeling, the amount of urea removed in a single dialysis treatment can be expressed in a simple way as the fractional reduction of urea. The urea reduction ratio (URR) can then be converted into a percentage of urea reduction for a given dialysis session:
Roughly, a %UR of 65 correlates with a single pool Kt/V of 1.2. The URR does not take into account changes in volume. Larger amounts of fluid removed with dialysis will result in a lower URR. This effect should be realized in patients with large intradialytic weight gains and high ultrafiltration rates.
TABLE 84.6 Formulae for the Calculation of Standard Kt/V
Where t is the treatment time in minutes, S is the result of equation 1, F is the number of sessions per week, UFw is the weekly fluid removal in liters, spKt/V is the single pool Kt/V, Kru is residual renal function, and V is the volume of distribution of urea.
Protein Catabolic Rate
Measurement of pre- and postdialysis urea concentration also allows the ability to calculate the amount of urea that is generated in the intradialytic period. This in turn can be used as a surrogate measure of protein intake and/or nutritional status. As protein is metabolized by the body, urea is generated. Therefore, measurement of the amount of urea in the body can be viewed as a measurement of net protein breakdown and, in the nutritional steady state, net protein catabolism is equal to dietary protein intake.46
TABLE 84.7 Formula for the Calculation of Normalized Protein Catabolic Rate217
PCRn = 5.42 G / V+ 0.168
G is the urea generation rate and V the volume of distribution of urea.
Three times weekly dialysis
Beginning of week
Co / [36.3 + 5.48Kt/V + 53.5/(Kt/V)] + 0.168
Mid week
Co / [25.8 + 1.15Kt/V + 56.4/(Kt/V)] + 0.168
End of week
Co / [16.3 + 4.3Kt/V + 56.6/(Kt/V)] + 0.168
Twice weekly dialysis
Beginning of week
Co / [48 + 5.14Kt/V + 79/(Kt/V)] + 0.168
End of week
Co / [33 + 3.6Kt/V + 83.2/(Kt/V)] + 0.168
Co is the predialysis concentration of urea.
There are many equations available for the calculation of normalized protein catabolic rate (Table 84.7). It should be noted that the equations do not take into account the clearance of urea that takes place by native kidneys in persons with residual kidney function. If a significant amount of urea clearance is still present through the native kidneys the PCRn will appear low. Further care should be taken when relating the PCRn to nutrition. Each patient needs to be evaluated for other clinical factors that can affect serum urea levels because the equation assumes that the patient is in a steady state of protein balance. For example, in states of increased protein catabolism, such as acute illness, urea levels will be increased and do not represent increased dietary intake. Taking these potential confounders into account, in general, an nPCR of greater than 1.0 g/kg/day would indicate that the patient has adequate protein intake. Goal PCRn should be in the range of 0.8 g/kg/day to 1.4 g/kg/day.47
Pitfalls with Urea-based Measures of Dialysis Adequacy
Urea is used as a surrogate marker of dialysis adequacy but urea itself does not describe the entirety of the uremic milieu. Urea is attractive as a marker of uremic toxicity because levels correlate with protein catabolism and many uremic toxins have been linked to protein metabolism. Urea is also easily measured by blood chemistry. However, urea levels may not correlate with the level of all uremic toxins, particularly in the case of uremic toxins that are not small solutes. Middle molecules and uremic toxins which are protein bound are largely ignored when using urea based methods of measurement of adequacy. Further, putting these inherent properties of urea aside, many other potential inaccuracies exist in the calculation of Kt/V (Table 84.8).
Timing of Initiation of Dialysis
The ideal timing for the initiation of dialysis in the patient with chronic kidney disease (CKD) is dependent on sound clinical judgment which accounts for factors such as age, residual kidney function, rate of progression to ESRD, modality choice, and patient preference. Examples of clear indications for the initiation of dialysis include uremia, uremic pericarditis, and volume excess refractory to diuretic therapy. Over time in the United States, the estimated glomerular filtration rate (eGFR) at which patients are initiated on dialysis continues to increase. In 1996 the mean eGFR at dialysis initiation was between 7 and 8 mL per min whereas in 2008 the mean eGFR was 11 mL per min.5 It is possible that this increase in eGFR represents changing nephrologist attitudes toward offering dialysis care with a general shift in practice patterns toward offering dialysis earlier. Patients starting dialysis at higher eGFRs may also be sicker than appreciated or sicker than historical patients. Patients starting dialysis with a higher eGFR are generally older, diabetic, and have a higher number of premorbid conditions.5
Many recent clinical guidelines and recommendations focus on the estimated GFR as calculated by Cockcroft-Gault or MDRD formulae as a tool to assist with the timing of initiation of dialysis. Use of eGFR is fraught with difficulties because the eGFR does not always correlate well with the actual GFR, particularly at very low levels of renal function as is seen in patients nearing the need for renal replacement therapy. Often patients with malnutrition will have lower creatinine levels reflective of decreased muscle mass and MDRD eGFRs which appear to be higher.
The trend toward starting dialysis earlier based on eGFR is alarming due to lack of clear demonstration of benefit in early start situations. In a prospective registry study comparing the MDRD eGFR and mortality, in a subgroup of patients with measured creatinine clearances, mortality rates were higher in patients with a higher eGFR but this relationship did not hold up when the GFR was calculated by measured creatinine clearance.48 Furthermore, higher eGFR at initiation of dialysis has been correlated with a greater risk for death. In an evaluation of registry data from Scotland and British Columbia, a progressively increasing hazard ratio of death was seen with increasing eGFR.49 In a cohort of over 25,000 patients from Canada between 2001 and 2007, increased mortality was seen in the early start group (eGFR > 10.5) compared with late start (eGFR <10.5). After adjustment for comorbidities, the increased risk persisted.50 Retrospective analysis of the USRDS revealed similar associations between increased mortality and early dialysis start when using eGFR > 15 mL per min as the definition for early start and <5 mL per min late start, arguing against early start of dialysis based on eGFR alone.51 Recently, a randomized controlled trial of patients from Australia and New Zealand attempted to define the ideal timing of dialysis based on the eGFR calculated by the Cockcroft-Gault formula (IDEAL study).52 Patients were randomized to two groups, early start (eGFR 10-14 mL per min) and late start (5-7 mL per min). Enrollment included 828 patients followed between 2000 and 2008. The results showed no difference between early versus late start with regard to death from any cause, cardiovascular complications, infectious complications, or dialysis complications. The conclusion was early start based on eGFR considerations alone does not confer clinical benefit.
The weight of the evidence seems to point away from using eGFR as the sole factor to determine the appropriate timing for initiation of dialysis. Rather, decisions regarding timing of the initiation of dialysis should remain a clinical judgment call made by a physician trained in kidney disease and individualized to meet the patient’s needs.
Clinical Trials to Define the Optimal Dialysis Dose
Over the years, clinicians and researchers have attempted to define the optimal dose of dialytic therapy for ESRD patients. Currently, dialysis therapy is delivered in a relatively uniform fashion to nearly all dialysis patients (3 to 4 days a week for 3 to 4 hours). Realization that the appropriate dose of volume and solute removal in dialysis is probably not the same for every patient led to expanded concepts for adequacy of dialysis by measurement of patient specific factors which could quantify the amount of dialysis delivered.
TABLE 84.8 Some Potential Pitfalls with Urea-based Methods of Dialysis Adequacy and Their Solutions
Problem
Potential Solution
Expected Kurea
Clearance data for specific dialyzers relies on information provided by manufacturers measured in artificial situations with urea solutions, not in vivo.
Anticipate that manufacturer listed clearances overestimate in vivo clearances
Sampling error
Clearance calculations can be affected by sampling, if sample is not drawn correctly or there is significant access recirculation results can be overestimated.
Develop consistent quality driven protocols for measurement of pre- and postdialysis urea
Discrepancy between prescribed vs. delivered dose
Loss of fiber bundle volume due to clotting can reduce amount of clearance. This is more of an issue near the end of the dialysis run or in dialyzers that are reused.
Lost dialysis time. Staff or patient related factors may create a discrepancy between the prescribed dose of dialysis and the amount of dialysis actually delivered.
Urea kinetic modeling should not be used alone to prescribe a dose of dialysis
Urea rebound
Urea rebound occurs after dialysis. Initially urea is equilibrated in the dialysis access as recirculation is negated, in the following minutes recirculation from the cardiopulmonary circuit resolves and over the following hour urea is redistributed completely from various tissue compartments and cellular spaces. Urea levels drawn immediately after dialysis do not allow enough time for equilibration to occur.
The calculation of equilibrated Kt/V attempts to address this problem
Modeled after traditional intermittent HD
Single pool Kt/V measures the effectiveness of a single dialysis session and is modeled after patients undergoing thrice weekly dialysis for 3-4 hours. The applicability of this method in persons on differing dialysis regimens particularly in cases of more frequent dialysis is unclear.
The calculation of standard Kt/V attempts to address this problem
The National Cooperative Dialysis Study (NCDS) in 1981 was a seminal early study seeking to provide a means for quantitative measurement of the optimal dose for thrice weekly dialysis.53 Investigators compared time averaged urea clearances (TACurea) with long or short treatment durations using a factorial randomized study design. Patients were divided into four groups based on their TACurea and dialysis time (Table 84.9). The TACurea provides a value for the mean concentration of urea over a dialysis cycle (Fig. 84.8). Investigators found that the patients in groups 2 and 4 with higher TACurea had more frequent hospitalizations, most commonly due to nausea, anorexia, and other uremic symptoms. As a result, more patients were withdrawn from the high TACurea groups for medical reasons. With regard to the length of therapy, in the high TACurea patients (groups 2 and 4), the short duration dialysis group (group 4) was hospitalized more frequently than the long duration dialysis group (group 2). The benefit of longer dialysis was not seen in the two groups with low TACurea (groups 1 and 3).
The NCDS findings were widely interpreted as suggesting that to prevent morbidity, clearance of urea is more important than dialysis treatment time. This led to the assumption by many clinicians that dialysis time could be shortened so long as urea clearance remained adequate. Notable caveats of the NCDS study include relatively low urea clearances across all groups, a patient population that was healthier when compared to the dialysis population in more recent times, and the small size of the study which was underpowered to make mortality comparisons.
TABLE 84.9 Four Groups of the National Cooperative Dialysis Study (NCDS)
 Computed Tomography and Magnetic Resonance Imaging
 Alport Syndrome, Fabry Disease, and Nail-Patella Syndrome
 Pathophysiology of Nephrotoxic Cell Injury
 Immunoglobulin A Nephropathy and Henoch-Schönlein Purpura
 Monoclonal Gammopathies: Multiple Myeloma, Amyloidosis, and Related Disorders
 Immunobiology and Immunopharmacology of Renal Allograft Rejection


