The increasing incidence of renal cell carcinoma over the past 2 decades can be partly explained by the expanding use of abdominal imaging. As a result, the most incident renal cancers today are small, localized, and asymptomatic. However, the well-documented rise in all stages of RCC calls into question the nature of these asymptomatic lesions. The expected “screening effect” of detecting RCC when it is small and localized, with subsequent decreases in disease-specific mortality, has not been observed. Disease-specific mortality is actually rising, especially in African American patients. Effective interventions aimed at reducing obesity, hypertension, and smoking may help in reducing the incidence of RCC in the future.
Renal cell carcinoma (RCC) accounts for 3% of all cancer diagnoses in the United States. In 2007 there were approximately 51,200 new cases of RCC, and an estimated 12,900 deaths. When compared with 1971, these numbers represent a fivefold increase in new cases and a twofold increase in mortality. In fact, the incidence of RCC has been steadily increasing since the early 1980s, from approximately 7.1 per 100,000 to 10.9 in 2002.
The reasons behind this rise are multiple. The primary reason relates to the increased availability and use of abdominal imaging in the American health care system during the past 2 decades. As a result, more renal masses are being diagnosed incidentally—that is, in the absence of symptoms typically associated with RCC. In 1970 approximately 10% of RCCs were detected incidentally, compared with more than 60% in 1998.
This shift in clinical presentation has had an important effect on the number of renal cancers detected as well as on the characteristics of the newly diagnosed lesions. The features of incidentally detected tumors tend to differ from symptomatic lesions in several respects. Incidentally detected renal masses tend to be smaller than their symptomatic counterparts. Accordingly, the average size of diagnosed RCC masses has decreased significantly over the past 2 decades. In a review of the Memorial Sloan Kettering experience, Lee and colleagues described the mean RCC tumor size at diagnosis in 1989 to be 7.8 cm, decreasing to 5.3 cm in 1998. Similarly, Hollingsworth and colleagues found that the rise in incidence of RCC between 1983 and 2002 (7.1 to 10.8 per 100,000) was mostly a result of tumors 4 cm or smaller in diameter.
Changes in stage at presentation
Incidentally detected RCC tends to be lower stage and more likely to be localized than symptomatic lesions at diagnosis. Luciani and colleagues examined over 1,000 consecutive patients who presented with RCC at a single institution between 1982 and 1997. Consistent with other studies, the proportion of tumors detected incidentally rose rapidly during this period (from 13% to 59%). At the same time, the proportion of clinical stage T1-T2 tumors increased from 49% to 74%, while the percentage of patients with M1 disease decreased from 20% to 10%. Similar patterns have been noted for pathologic stage. At Memorial Sloan Kettering, the proportion of renal tumors that were stage pT1 in 1989 was 4%, versus 22% in 2000. However, since the hospital-based patient samples in these studies are composed mainly of patients who are at least being considered for surgery, they are likely to be biased toward those with lower stage, and thus resectable, disease. Interpretation of this data as evidence of a downward stage migration of RCC may therefore be inaccurate.
Whereas small, localized renal masses are responsible for most incident cases today, the incidence of all stages of RCC, including advanced and metastatic disease, is on the rise. Hock and colleagues compared incidence rates of RCC between 1973 to 1985 and 1986 to 1998 using the SEER (Surveillance Epidemiology and End Results) cancer registry. They found that localized disease rose by an annual 3.7% (95% CI 3.2–4.2), regional disease by 1.9% (95% CI 1.2–2.6), and distant metastatic disease by 0.68 (95% CI 0.1–1.3). Similarly findings have been echoed by other authors.
Changes in demographics
In addition to changes in disease characteristics at presentation, significant changes have been noted in the demographics of RCC. There continues to be a strong gender preponderance, with men accounting for two-thirds of RCC diagnoses and deaths. Luciani and colleagues found that the mean age of patients presenting with RCC has increased from a mean of 57 years in 1982 to 63 years in 1997. When restricted to incidentally detected tumors only, they found that mean age at detection increased to 64 years. More recently, the SEER cancer registry reported that median age at diagnosis between 2000 and 2004 was 65 years. The causes for this shift in age at diagnosis are unclear. It may in part be the result of increased exposure to the health care system owing to a greater number of comorbidities as a patient ages.
Race has also emerged as an important factor in the epidemiology of RCC. Using the SEER cancer registry, Vaishampayan and colleagues found that between 1975 and 1998, incidence rates among blacks increased by 4.5% compared with 2.9% in whites. Similarly, Chow and colleagues estimated the RCC incidence among white men between 1975 and 1995 to be 2.3%, compared with 3.9% in black men. During the same period white women had a 3.1% annual increase, while the rate in black women increased by 4.9% per year.
The reason why blacks have had a higher incidence rate of RCC during the past 2 decades is uncertain. There is no evidence that RCC in this population is being disproportionately detected via increased use of abdominal imaging. The underlying reason for this disparity is therefore likely to involve changes in the affected population itself. For example, it is possible that there is increased exposure within this population to risk factors associated with RCC. As described in more detail later in this article, established risk factors for RCC such as obesity and hypertension affect the black population disproportionately.
Racial disparities have also been observed in mortality rates from RCC. The study by Vaishampayan and colleagues found that between 1975 and 1998, the median disease-specific survival for all stages of RCC for blacks was 47 months, compared with 53 months for whites. When limited to those patients 60 years of age and younger with localized disease, the disparity in median survival rates between the two groups increased: 190 and 259 months, respectively ( P < .01). In other words, the survival difference between black and white patients seems to be amplified in younger cohorts with less severe disease. Similar findings have been cited by other authors.
Again, reasons for this difference are unclear. Racial disparities in cancer rates and outcomes exist for multiple solid organ neoplasms, including prostate and bladder cancer. However, while the poorer outcomes in bladder cancer can be in part explained by more advanced stage at presentation, racial disparities in survival for RCC are greatest among younger patients with localized disease. Delayed presentation is therefore not a sufficient explanation for this phenomenon, and requires further study. With the exception of renal medullary carcinoma, predisposition to more malignant histologies in the black population do not seem to be borne out in the literature.
In an analysis of the SEER cancer registry, Berndt and colleagues examined the treatment patterns between blacks and whites diagnosed with RCC. They found that after adjusting for known disease- and patient-specific variables affecting surgical candidacy, blacks were less likely to undergo nephrectomy than whites (relative risk [RR] 0.93, 95% CI 0.9–0.96). Survival was significantly worse for blacks, although the disparity was reduced after controlling for comorbidities. It is therefore possible that the worse prognosis in blacks diagnosed with RCC can be partly explained by the increased prevalence of significant comorbidities in this population, as well as by their lower rate of surgical intervention.
Mortality rates
Excellent 5-year survival rates have been reported for the small, localized masses that comprise the majority of newly diagnosed renal tumors today. Tsui and colleagues found that incidentally detected tumors were more likely to be smaller, lower stage, and lower grade than symptomatic lesions. Accordingly, 5-year disease-free survival (DFS) rates were 85.3% and 62.5%, respectively. In their review of 4,000 patients who underwent nephrectomy between 1984 and 1999, Patard and colleagues found that at 73 months DFS was 93% for incidentally detected tumors and 59% for symptomatic lesions. Similarly, Pantuck and colleagues found a doubling of 5-year DFS rates for patients with RCC between the time periods of 1963 to 1973 and 1982 to 1992. They postulate that this improvement was mostly the result of an increasing proportion of smaller, incidentally detected tumors included in the analyses.
While the disease characteristics may have changed over the past 2 decades, aggressive treatment remains the standard for incident renal tumors. Between 1983 and 2002, the incidence of renal surgery increased from 0.9 to 3.6 per 100,000, mostly for tumors 4 cm or smaller. Whether this is an appropriate extension of aggressive therapy remains to be determined.
In a review of the SEER cancer registry, Chow and colleagues found that despite the increasing proportion of localized, incidentally detected RCCs, mortality rates continue to rise. This documented rise in mortality is likely to be in part the result of the concomitant increase in all stages of RCC, including advanced disease. But if the increasing incidence of RCC is primarily a result of smaller, localized tumors, and these are being addressed with effective surgical treatments, why have overall mortality rates not decreased? If these localized masses are being detected early in their progression before they advance and cause mortality, why has their treatment not effected a decrease in advanced disease and in disease-specific mortality? This “treatment disconnect” is the subject of much debate.
As argued by Parsons and colleagues, if the increase in overall incidence of RCC is primarily a result of the detection of earlier stages of the disease, we would expect a “screening effect” similar to that noted for prostate-specific antigen and prostate cancer. Namely, over a period of time, disease-specific mortality should decrease. However, the incidence of advanced disease continues to rise, as do mortality rates. This therefore begs the question of what risk these small, incidental masses truly represent, and therefore what constitutes appropriate therapy.
First, the conclusions about mortality rates that can be made from improved 5-year DFS statistics are limited, as this measure may not ultimately translate into decreased mortality. Using the SEER cancer registry, Welch and colleagues found that the 5-year DFS rates for 20 selected malignancies all increased between 1950 and 1995. However, eventual mortality decreased for only 12 of 20 cancers during the same time period, and increased for the remainder. They concluded that improvements in 5-year DFS may not translate into eventual decreases in mortality, but may instead be affected by changes in diagnostic patterns. Part of this explanation stems from the phenomenon of lead-time bias: in the case of RCC, smaller tumors being diagnosed and recognized earlier than in the past may give an artificial increase in survival time without affecting eventual mortality rates. However, this presumes that a large percentage of these asymptomatic, incidentally detected renal masses are destined to progress. At this time there is insufficient evidence to suggest that this is true.
The increasing mortality rates and incidence of advanced stages of RCC represent a challenge to our current treatment paradigm for small, incidentally detected renal masses. It is possible that many of these lesions are unlikely to progress to advanced stages, or to result in mortality. This possibility, combined with an independently rising incidence of advanced disease, may provide part of the explanation as to why overall mortality rates for RCC are increasing. Examining the biology and natural course of incidentally detected renal masses may help in clarifying this dilemma. Therefore, in the absence of prospective clinical trials, observations taken from retrospective, active surveillance programs may provide meaningful insight into this issue.
In 2006, Chawla and colleagues performed a meta-analysis of 234 renal lesions with a mean diameter of 2.6 cm followed on active surveillance at 10 institutions. At a mean follow-up of 34 months, the mean growth rate was estimated as 0.28 cm per year. Pathology was available in 46% of the cases, of which 92% (120 of 131) were confirmed as RCC variants. Within the subgroup of patients with documented RCC, a mean growth rate of 0.40 cm per year was observed. Development of metastases was seen in 1% of lesions (3 of 286) during follow-up. This review of the available world literature on surveillance of small solid renal lesions provides valuable insight into why the detection of these indolent lesions has not led to a demonstrable decrease in mortality from this disease.
In an analysis of a prospectively collected database of 482 renal masses resected between 2001 and 2005, Schachter and colleagues found that of those lesions 4 cm or smaller in diameter (n = 228), 26% were benign, compared with 8% of lesions larger than 4 cm (n = 254). Similarly, in a large-scale study of more than 2,700 nephrectomy specimens, there was an inverse relationship between tumor size and benign histology: of tumors smaller than 1 cm, 46% were benign, versus 6% of those 7 cm or larger. Similar patterns have been reported by other authors. These findings suggest that many of the small masses that comprise the majority of incident RCCs today are more likely to be benign. However, more research is needed into the natural course of these cancers before clinical guidelines can be suggested.
Risk factors
Smoking
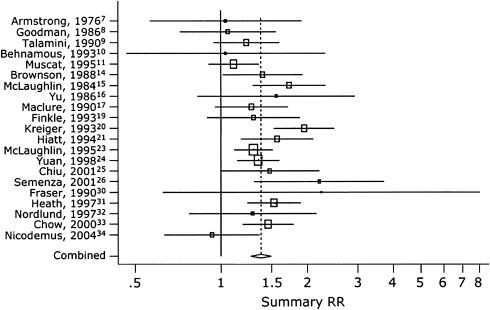
There are myriad risk factors that have been linked to the development of RCC. Smoking, obesity, and hypertension are the three most well-established factors associated with RCC. A recent review by Vineis and colleagues revealed a relative risk of 1.5 to 2.0 for development of RCC in persons who smoke 20 or more cigarettes daily. Similarly, a cohort study of more than 350,000 Swedish men found a significantly increased risk of RCC in individuals with any smoking history. More recently, a meta-analysis by Hunt and colleagues in 2005 reviewed 19 case-control studies and 5 cohort studies ( Fig. 1 ). In their comparison of “ever” versus “never” smokers, they found that the relative risk for RCC in smokers was 1.39 (95% CI 1.27–1.5). Among men, the relative risk was 1.54 (1.42–1.68), and in women 1.22 (1.09–1.36). There was also a significant dose-dependent effect, with relative risk increasing in those smoking more than 20 cigarettes per day compared with fewer than 10. In men, the relative risk was 2.03 (95% CI 1.51–2.74) versus 1.6 (95% CI 1.21–2.12). In women this dose-effect was less salient: 1.58 (95% CI 1.14–2.2) compared with 0.98 (95% CI 0.71–1.35). The authors explained this gender-based difference by the “maturity” of smoking patterns, that is, men are likely to have been smoking for a longer period of time than women.
Smoking cessation significantly decreased the relative risk of RCC after 10 years compared with those who had quit less than 10 years ago, but this difference was noted only in men (RR 1.75, 95% CI 1.41–2.18 versus 1.21, 95% CI 0.86–1.7). Similarly, Parker and colleagues found that the risk of RCC decreased with increasing number of years after quitting smoking. After controlling for age, sex, body mass index (BMI), hypertension, and pack-years of smoking, for those having quit for 30 years or longer versus fewer than 30 years there was a 50% decrease in risk of developing RCC (odds ratio [OR] = 0.5, 95% CI 0.3–0.8).
Obesity
Obesity has long been considered an important risk factor for developing RCC. In the previously cited study, Chow and colleagues divided patients into three groups based on increasing BMI. They found that those in the middle group had a 60% greater risk of developing RCC than those in the lower group, while the risk in the highest BMI group doubled ( P < .01). In a recent large-scale study, 2 million Norwegian men and women were followed for a mean of 23 years between 1963 and 2001. The calculated relative risk per unit of BMI for both men and women was 1.05 (95% CI 1.04–1.06). Compared with men of normal weight, men with a BMI of 35 to 39 had a relative risk of 1.89 (95% CI 1.22–2.94), increasing to 2.76 (95% CI 0.89–8.56) for a BMI of 40 or greater. In a more recent review of the literature, Calle and Kaaks noted that compared with individuals with normal weight, the relative risk of developing RCC for persons with a BMI of 25 to 30 was 1.5, and 2.5 for those with BMI 30 or greater. The authors calculate that the population-attributable fraction of being overweight to the development of RCC in the United States is more than 30%.
The prevalence of obesity in the United States has increased dramatically over the past 3 decades. In 1980 approximately 15% of American adults were estimated to be obese, as defined by a BMI of 30 or greater. This estimate has more than doubled to 33% in 2004. This trend must be considered when discussing the increasing incidence of RCC in the United States that has been largely attributed to abdominal imaging. As a well-established risk factor for RCC, the “epidemic” of obesity in the United States may help explain the rising incidence of all stages of RCC.
Multiple mechanisms of how obesity may be related to the development of RCC have been proposed. Researchers have pointed to the endocrine and metabolic role of adipose tissue. Consequently, obesity may lead to increased release of adipokines such as free fatty acids and tumor necrosis factor-α. Together with the hyperinsulinemia and increased bioavailability of insulin-like growth factor-1 associated with obesity, these adipokines may lead to increased cell proliferation, decreased apoptosis, and tumorigenesis. As proposed by Gago-Dominguez and colleagues, lipid peroxidation of proximal renal tubules may be carcinogenic, and increased lipid bioavailability in obese individuals may predispose them to RCC.
Hypertension
Multiple studies have demonstrated the association between hypertension and RCC. Chow and colleagues noted a positive trend in RCC risk with increasing diastolic and systolic blood pressure. As shown in Table 1 , compared with individuals with diastolic blood pressures less than 70 mm Hg, those with values higher than 90 mm Hg had a doubled risk of developing RCC. Similarly, compared with patients with a systolic blood pressure of less than 120 mm Hg, those with a value higher than 150 mm Hg had a 60% higher risk of RCC. In this same study, no association was found between blood pressure values and the risk of renal pelvis cancer, which has a distinct histology and clinical course from RCC.
| Variable | No. Men in Cohort (n = 362,992) | Follow-up | Renal-Cell Cancer | Renal-Pelvis Cancer | ||
|---|---|---|---|---|---|---|
| No. Men with Cancer | Relative Risk (95% CI) | No. Men with Cancer | Relative Risk (95% CI) | |||
| Person-Year | ||||||
| Smoking status | ||||||
| Nonsmoker | 148,206 | 2,129,536 | 180 | 1.0 (ref) | 18 | 1.0 (ref) |
| Former smoker | 51,638 | 909,630 | 145 | 1.3 (1.0−1.6) | 19 | 1.6 (0.9−3.1) |
| Current smoker | 138,332 | 2,289,228 | 334 | 1.6 (1.3−1.9) | 82 | 3.5 (2.1−5.8) |
| Unknown | 25,816 | 455,494 | 100 | 1.6 (1.2−2.0) | 17 | 2.6 (1.3−5.0) |
| Body mass index | ||||||
| ≤20.75 | 45,073 | 705,242 | 32 | 1.0 (ref) | 15 | 1.0 (ref) |
| 20.75–21.90 | 45,131 | 707,289 | 46 | 1.2 (0.7−1.8) | 8 | 0.4 (0.2−1.0) |
| 21.91–22.85 | 45,057 | 710,225 | 43 | 0.9 (0.6−1.5) | 13 | 0.6 (0.3−1.3) |
| 22.86–23.80 | 46,516 | 741,832 | 78 | 1.4 (0.9−2.1) | 13 | 0.5 (0.2−1.1) |
| 23.81–24.76 | 44,916 | 720,615 | 107 | 1.6 (1.1−2.4) | 22 | 0.8 (0.4−1.5) |
| 24.77–25.95 | 45,987 | 744,218 | 102 | 1.3 (0.8−1.9) | 23 | 0.7 (0.4−1.5) |
| 25.96–27.75 | 45,499 | 735,804 | 156 | 1.7 (1.1−2.7) | 22 | 0.6 (0.3−1.1) |
| ≥27.76 | 45,813 | 718,663 | 195 | 1.9 (1.3−2.7) | 20 | 0.5 (0.2−1.0) |
| P for trend | — | — | — | <.001 | — | .25 |
| Diastolic blood pressure | ||||||
| <70 mm Hg | 40,407 | 540,097 | 12 | 1.0 (ref) | 6 | 1.0 (ref) |
| 70−79 mm Hg | 110,461 | 1,695,116 | 96 | 1.4 (0.8−2.5) | 22 | 0.6 (0.2−1.5) |
| 80–89 mm Hg | 139,998 | 2,317,216 | 273 | 1.7 (0.9−3.0) | 49 | 0.6 (0.2−1.4) |
| 90–99 mm Hg | 57,060 | 974,597 | 272 | 2.1 (1.2−3.9) | 46 | 0.7 (0.3−1.8) |
| 100–109 mm Hg | 11,627 | 187,114 | 78 | 2.3 (1.2−4.4) | 10 | 0.6 (0.2−1.9) |
| ≥110 mm Hg | 4,439 | 69,748 | 28 | 2.2 (1.1−4.5) | 3 | 0.6 (0.1−2.4) |
| P for trend | — | — | — | <.001 | — | .74 |
| Systolic blood pressure | ||||||
| <120 mm Hg | 39,010 | 554,138 | 28 | 1.0 (ref) | 11 | 1.0 (ref) |
| 120–129 mm Hg | 100,884 | 1,561,807 | 103 | 1.1 (0.7−1.7) | 28 | 0.8 (0.4−1.7) |
| 130–139 mm Hg | 108,165 | 1,754,399 | 192 | 1.5 (1.0−2.2) | 29 | 0.6 (0.3−1.2) |
| 140–149 mm Hg | 67,661 | 1,122,128 | 168 | 1.4 (0.9−2.1) | 27 | 0.6 (0.3−1.3) |
| 150–159 mm Hg | 27,361 | 458,505 | 124 | 1.6 (1.1−2.4) | 20 | 0.7 (0.3−1.5) |
| ≥160 mm Hg | 20,911 | 332,911 | 144 | 1.7 (1.1−2.6) | 21 | 0.7 (0.3−1.5) |
| P for trend | — | — | — | .007 | — | .91 |
Related posts:
 Molecular Biology of Renal Cortical Tumors
 Pathologic Features of Renal Cortical Tumors
 Molecular Imaging of Renal Cell Carcinoma
 Renal Tumor Natural History: the Rationale and Role for Active Surveillance
 Choice of Operation for Clinically Localized Renal Tumor
 Lymph Node Dissection in the Management of Renal Cell Carcinoma
Stay updated, free articles. Join our Telegram channel

Full access? Get Clinical Tree


