Renal cell carcinoma (RCC) is the most common malignancy of the kidney. Despite widespread treatment at diagnosis, overall mortality rates associated with RCC have not decreased. Partly because of the more frequent use of abdominal imaging, diagnosis as an incidental finding has increased. The largest increase in incidence is in tumors smaller than 4 cm, termed small renal masses (SRMs). SRMs that are RCC may frequently be growth slowly and have a low risk of early progression. Initial active surveillance with delayed treatment for progression for selected patients should be considered. This should result in an overall decrease in treatment burden and cost saving.
Renal cell carcinoma (RCC) is the most common malignancy of the kidney and it represents 2% to 3% of newly diagnosed cancers in the United States. It is estimated that there were 51,190 new cases and 12,890 deaths from kidney cancer in 2007. This incidence has been increasing in the past 20 years. From 1983 to 2002, the overall age-adjusted incidence rate for kidney cancer rose from 7.1 to 10.8 cases per 100,000 US population, which is an increase of 52%. This increase is at least in part attributable to the more frequent use of abdominal imaging. All clinical stages have increased in incidence but the largest increase is in tumors smaller than 4 cm. These CT-enhancing lesions that have the characteristics of RCC have been termed small renal masses (SRMs). The incidence of tumors 2 to 4 cm in size rose from 1.0 to 3.3 per 100,000. Resected tumor size dropped from a maximum diameter of 7.8 cm to 5.3 cm between 1989 and 1998. Diagnosis as an incidental finding increased from 7% to 13% in the early 1970s to 48% to 66% of kidney cancer currently. Not all SRMs are RCC, and those incidentally discovered are more frequently benign. Frank and colleagues reported a large series of 2770 renal tumors. Benign tumors accounted for 46.3% of those smaller than 1 cm, 22.4% of tumors 1.0 to 1.9 cm, 22.0% of tumors 2.0 to 2.9 cm, and 19.9% of tumors 3.0 to 3.9 cm and most of these incidental tumors have a lower grade than those in symptomatic patients. The greatest incidence of SRMs is in patients older than 65 years, which is an age group more likely to undergo radiological examination for other medical conditions. They also have more comorbidity and are therefore at increased surgical risk. Hollingsworth and colleagues in a cohort of 26,618 individuals treated surgically for localized kidney cancer, showed that the relative benefit of therapy is diminished by competing causes of mortality in older patients. Nearly one third of patients aged 70 years and older died from unrelated comorbid disease within 5 years of curative surgery.
Even though surgical morbidity is decreasing, it is still significant and has been reported in 11% to 40% of cases. Despite widespread treatment at diagnosis, overall mortality rates associated with RCC have not decreased. Five-year cancer-specific survival of 90% or greater with low recurrence rates is widely reported for early-stage tumors. Interestingly, these results are frequently reported to be independent of margin status.
These observations suggest that SRMs that are RCC may frequently be slow growing and have a reduced risk of early progression. Initial active surveillance with delayed treatment for progression for some patients should be considered. This should result in an overall decrease in treatment burden and cost saving.
Natural history
The natural history of renal tumors has not been extensively studied because the only established curative treatment for RCC has been surgery by radical or partial nephrectomy (which is done soon after diagnosis).
Since 1995 there have been a number of reports that contribute to our understanding of the natural history of SRMs. They all indicate that these tumors grow slowly. However, most of the clinical series are small, single institutional and retrospective. Bosniak and colleagues collected 40 incidentally detected renal masses < 3.5 cm in diameter with 3.25 years of follow-up. They reported a mean linear growth rate of 0.36 cm/year (0–1.1cm/year) by retrospectively reviewing available imaging obtained before surgery. Of 26 tumors removed, 22 (85%) revealed pathological RCC. Nineteen had a growth rate < 0.35 cm/year and none of the patients developed metastatic disease. These results showed that most of their reported renal masses had little or no change in size and they hypothesized that the small proportion of tumors with rapid growth rates were not curable despite early detection and treatment.
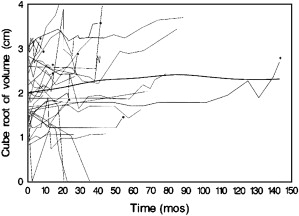
We have reported our experience with prospective surveillance in 32 tumors (25 solid, 7 Bosniak III-IV) in 29 patients followed for a mean of 27.9 months (range 5.3 to 143.0). The overall average growth rate became insignificant after growing tumors were removed (nine tumors were removed after an average follow-up of 3.1 years) and growth was not associated with the initial tumor size ( P = .28). For solid masses, the average growth rate was 0.11 cm 3 per year and for cystic masses it was 0.09 cm 3 per year ( P = .41). Seven masses (22%) reached 4 cm in diameter after 12 to 85 months of follow-up and eight (25%) doubled their volume within 12 months. Overall, 11 (34%) fulfilled one of these two criteria of progression. Finally and importantly, four of these renal masses decreased in size ( Fig. 1 ).
Kassouf and colleagues reported a similar experience with SRMs. In 24 patients with 32 months of follow-up, most of the tumors had no significant growth and no metastatic disease was observed during the surveillance period. In a recently reported pooled analysis, nine single-institutional series with a total of 234 masses met the author’s criteria for study. Overall, the mean initial lesion size was 2.6 cm (range 1.73 to 4.08 cm) and 86% (178 of 208) were lesions smaller than 4 cm in maximal diameter at presentation. They were followed for a mean of 34 months (range 26 to 39) and the mean growth rate was 0.28 cm/year (range 0.09 to 0.86 cm/year). Ninety-two percent of the lesions evaluated pathologically (42% of the tumors) were carcinoma. A comparison of size at presentation and growth rate in the 116 tumors (63 confirmed RCCs versus 53 observed without biopsy) revealed that size at presentation did not differ but that the growth rate of confirmed RCCs was greater (0.4 ± 0.36 versus 0.21 ± 0.4 cm yearly, P = .001). The difference in growth rates may have been the result of a selection bias because of treatment delay in lesions with slower growth rates.
Kouba and colleagues reported a correlation between SRM growth rate and age with younger patients (60 years old or less) having more rapid growth (0.77 cm versus 0.26 cm per year). This observation supports earlier intervention in younger patients.
A lack of interval radiographic growth does not indicate benign histology. There is a wide range of growth with some lesions showing no interval growth over the short term and most of those have malignant pathology. Kunkle and colleagues followed 106 enhancing renal masses for a minimum of 12 months (median 29). Pathology was available in 42 patients (40%). Overall, 33% (35/106) had no growth. The overall frequency of malignant lesions did not differ significantly between those with growth and those with zero growth (89% versus 83%, P = .56). Furthermore, they did not find any correlation between growth and patients’ age, lesion size, solid/cystic appearance, or the incidental detection rate. Seventy-eight (26%) of 295 observed lesions failed to show growth. Overall, 26% to 33% of lesions under active surveillance do not grow and this characteristic does not predict for benign pathology.
Prognostic factors for tumor growth
Clinical and pathologic stage, histologic subtype, and grade are important prognostic factors for outcome with RCC. Histology and grade are less well understood factors for SRMs that are proven RCC (stage T1a).
Overall, new papillary and chromophobe RCCs appear to be smaller at presentation than clear cell carcinomas but it is not known if they have a slower growth rate. The relationship of nuclear grade to growth is also unclear. Oda and colleagues could not find a relation between growth rate and the degree of nuclear anaplasia in 16 patients. However, Kato and colleagues reported that Fuhrman grade III tumors, which comprised 17% of his series of 18 incidentally detected with histologic-proven RCCs that underwent surgical resection after a median observation follow-up of 22.5 months, grew faster than Fuhrman grade I-II tumors.
Tumor size at presentation does not clearly predict growth rate. Sowery and Siemens did not find a correlation in 22 patients with T1-2N0M0 tumors. Growth appeared to be slow even in those diagnosed with larger masses. Others have made the same observations that size and growth rate do not correlate.
The presence of cystic components may be a marker of a slower growth rate but numbers reported are small and most were removed early. Others report that the presence of cystic components does not predict slower growth.
Those that are detected incidentally and are lower stage have a better survival rate (5-year cancer-specific survival 85.3% versus 62.5%).
Molecular markers of prognosis for RCC would be very useful. Ki-67 (a nuclear antigen that is a marker of active cell proliferation), p53 protein (induces apoptosis), PTEN (a tumor suppressor gene), pAkt, nuclear akt, p27, pS6, bcl-2 (inhibits apoptosis), cyclin-D1 (a protein kinase that plays a role in cell-cycle regulation), vascular endothelial growth factor (VEGF), caveolin-1 (major structural component of caveoae that might play a role in invasion and metastatic progression), and HER-2 (an epidermal growth factor) have been studied. In a recent immunohistochemistry study by Phuoc and colleagues in 119 paraffin-embedded clear-cell RCCs, using univariate analyses, high Ki-67, p53, VEGF, and caveolin-1 were associated with decreased survival but high bcl-2 and cyclin-D1 were associated with increased survival. On multivariate analysis, expression of p53 or bcl-2 was an independent predictor of disease-specific survival. In addition, low PTEN expression was associated with decreased survival. Kim and colleagues developed a multivariate clinical prognostic model based on the UCLA Integrated Staging System. CA9, CA12 (cell surface transmembrane carbonic anhydrases that are normally up-regulated by hypoxia-inducible factor in a low oxygen environment), PTEN, vimentin (epithelial cell adhesion molecule expressed on cell surface of carcinomas), p53, T stage, and performance status were significant predictors of survival.
Most of these studies included renal masses larger than 3 cm. However, Kato and colleagues investigated the natural history of incidentally discovered SRMs and evaluated several features including cell proliferation and apoptosis. The cell activity was measured by immunostaining using Ki-67 and TUNEL (tranferase-mediated dUTP-biotin nick). They found that tumor growth rate is not associated with Ki-67 immunostaining and apoptosis was related to growth rate. However, Oda and colleagues failed to establish a correlation between cell proliferation, apoptosis, and angiogenesis (measured with CD34 immunoanalysis) and tumor growth. Fujimoto and colleagues, in a study of 18 patients with incidental renal tumors, reported that the argyrophilic nucleolar organizer regions (AgNORs) and proliferating cell nuclear antigen (PCNA) activity immunohistochemically correlated with the tumor doubling time (DT). DT was inversely and significantly correlated with AgNORs and PCNA. At this time, molecular markers of progression by tumor growth or metastatic potential have not been established as clinically useful triggers for therapy when active surveillance is being conducted or being considered.
There has been considerable effort to establish genomic markers of progression and response to treatment in RCC, as has been reported in retinoblastoma for example. Genomic features of RCC have been studied using microarrays. Higgins and colleagues characterized different types of RCC. Takahashi and colleagues used 21,632 element arrays to prognostically stratify 29 clear-cell carcinoma patients. They found two groups of patients and identified 40 genes that predict patients’ prognosis, which are related to matrix metalloproteinase and angiogenesis activity. One group had a 100% 5-year survival with 88% of these without clinical evidence of metastatic disease. The remainder had an average survival time of 25.4 months with a 0% 5-year survival rate. This stratification by gene expression was superior to stage but similar to grade.
Zhao and colleagues studied 177 clear-cell carcinomas and identified different types by distinct gene expression patterns with differing prognosis. They developed a set of 259 genes that predicted survival. By multivariate analysis, the gene expression pattern was a strong predictor of survival independent of tumor stage, grade, and performance status. Vasselli and colleagues studied 58 archived tumors from patients with sporadic, stage IV RCC and 8 matched grossly normal-appearing kidney samples. They identified two patterns of gene expression, which correlated with a significant difference in overall survival. Although several reports using microarray data have been published in the past decade, variations among studies and lack of consistency between different platforms exist. At present, expression array data have limited clinical utility.
Risk of progression to metastatic disease
Progression to metastases as opposed to progression in tumor stage in patients under observation therapy is rare and poorly documented. In the recent pooled analysis, only 3 patients progressed to metastatic disease, representing 1% (3 in 286) of the total lesions. It is important to point out that all of these patients were symptomatic at the time of disease progression. They reported the lesion size at presentation, the growth rate and follow-up in two patients. One patient presented with an 8.8-cm lesion and was followed for 111 months with a growth rate of 0.2 cm per year. The other developed metastatic disease after 54 months of follow-up, with a 2.0-cm lesion at the presentation and a growth rate of 1.3 cm per year.
Related posts:
 Molecular Biology of Renal Cortical Tumors
 Pathologic Features of Renal Cortical Tumors
 Epidemiology, Clinical Staging, and Presentation of Renal Cell Carcinoma
 The Medical and Oncological Rationale for Partial Nephrectomy for the Treatment of T1 Renal Cortical Tumors
 Choice of Operation for Clinically Localized Renal Tumor
 Lymph Node Dissection in the Management of Renal Cell Carcinoma
Stay updated, free articles. Join our Telegram channel

Full access? Get Clinical Tree


