Fig. 1
Two ultrasound probes viewed from a frontal and lateral prospective. To the left of both panels an ordinary 2D phased array is shown and to the right in both panels a matrix probe that enables real-time 3D ultrasound scanning is depicted
Third, true volumetric 2D array transducers have been developed (Green and Campbell 1994). These complex transducers generate a pyramidal volume of ultrasound data, enabling dynamic real-time 3D ultrasonography. The matrix probes have been validated in volume estimation and seem to perform well (Bu et al. 2005; Qin et al. 2000; Binder et al. 2000), also compared with magnetic resonance imaging (MRI) (Jenkins et al. 2004). Clinical applications of real-time 3D ultrasound include measurement of left ventricular volume (Arai et al. 2004), quantitative assessment of perfusion defects with myocardial contrast agents (Camarano et al. 2002), and detection of ischemia during dobutamine-induced stress (Ahmad et al. 2001). In pathologic fetal hearts, 3D Echocardiography (3DE) was helpful for localizing multiple cardiac tumors; estimating size and function of the right and left ventricles, and evaluating mechanism of valvular regurgitation and pulmonary obstruction (Acar et al. 2005). Several ultrasound vendors have now developed real-time 3D probes to promote clinical and interventional scanning exploiting all dimensions (Sugimoto et al. 2011; Harris et al. 2010; Foroughi et al. 2006). An example of 4D scanning is shown in Fig. 2.
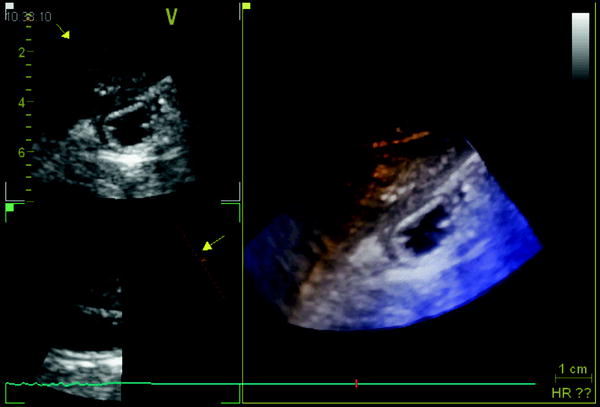
Fig. 2
Ultrasonogram of fluid-filled gastric antrum acquired by a real-time 3D matrix probe showing two 2D slices in left panels and a 3D volume in the right panel
2.2 Data Digitization
Ultrasound raw data are available in a digital format in most scanners; however, some of the commercially available ultrasound scanners generate analog output signals. Therefore, in order to be processed by a computer, conversion of ultrasonographic data into a digital format is necessary. Frequently, this is done by video frame grabbing using designated hardware cards in the computer or in the scanner. However, frame grabbing of video signals impairs image resolution. Therefore, preferably, raw ultrasound data is digitized directly maintaining the original resolution.
2.3 Data Storage
Following data capture and digitisation, image data is normally stored temporarily until computer processing can take place. High-resolution 3D ultrasound data give rise to large image files necessitating high-capacity storage media such as magneto-optical disks, CD/DVD, or hard disks. The ultimate goal in 3D ultrasonography is to obviate the data storage operation and perform direct data processing and volume estimation in real time, and subsequently store only the clinically relevant images and measurements.
2.4 Data Processing
Depending on the mode of acquisition, the image data can be prepared in different ways (Belohlavek et al. 1993b). Only the mainstream flowchart of processing will be outlined here.
First, the image data must be converted to a rectangular (Cartesian) co-ordinate system. Image points are assigned to new positions within a cuberille (regular data volume) on the basis of their pyramidal (if tilting acquisition) co-ordinates. This scan conversion is usually relatively time consuming and is performed by computer algorithms.
Second, mathematical interpolation is performed to generate values that “fill in the gaps” between 2D slices that are stacked together in the cuberille. After scan conversion and interpolation, the pixels can be treated as spatially correct 3D image elements, known as voxels.
Third, methods for image enhancement are usually applied to improve image contrast and remove artifacts. These techniques include filtering, histogram stretching and sliding, and morphological operations. This step may be important to the overall quality of the final 3D ultrasound image but may not be of great importance for volume measurement. Image enhancement represents an uncertainty because significant clinical information can be lost in the operation.
Fourth, the cube of image data is now ready for segmentation; i.e., the procedure where the object of interest is separated from the surrounding structures (Greenleaf et al. 1993). Three fundamental approaches to segmentation have been utilized in 3D ultrasonography:
(1).
Extraction by visual inspection and manual outlining of contours
(2).
Semi-automatic separation using visualization algorithms (Nielson and Shriver 1989) aided by operator interaction
(3).
Fully automatic computer segmentation.
The latter method is capable of detecting edges with high contrast, but is subject to inaccuracies and artifact production. Therefore, automatic segmentation must be used with great care if applied to patient data. Manual segmentation of structures in the 3D data set makes accurate volume estimation and reconstruction of organs or pathology achievable. This method, which primarily supplies quantitative information, is applicable to all areas of sonographic imaging where volume calculation is indicated.
2.5 Data Display
The final step in formation of 3D ultrasound images is to display the data so that the inherent voxel information is communicated accurately. Commonly, simple rotation of the object on the computer monitor provides some 3D effects. To further enhance the 3D outcome of the images, stereoglasses have been applied (Martin et al. 1995; Nelson and Pretorius 1995). Projection of images by optical holography enables the observer to move around the object and examine the spatial relationships from different viewpoints (Baum and Stroke 1975; Koivukangas et al. 1986; Redman et al. 1969). A typical setup of a 3D ultrasound system is shown in Fig. 3.
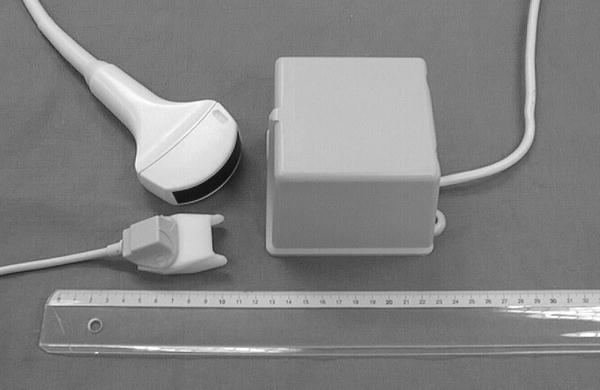
Fig. 3
A 3D ultrasound system based on magnetic Position and Orientation Measurement (POM). The Bird System (Ascension Technology Corp., Burlington, VT, USA) consists of a sensor that can be attached to the scanhead, a magnetic field generator, and a system control unit (usually hidden in the scanner)
Data processing and display requires specialized computer software to handle the ultrasound images. We have developed, in collaboration with Christian Michelsen Research (Bergen, Norway) and Vingmed Sound (Horten, Norway), a software package: EchoPac3D® (Martens et al. 1997; Martens and Gilja 2004). EchoPac3D enable import of image data that are acquired both with mechanical devices and magnetic position sensors, as well as endosonographic acquisitions. Manual segmentation or semiautomatic rendering of structures in the 3D data set makes accurate volume estimation and reconstruction of organs or pathologic tissue achievable. The accuracy of volume estimation in this software package has been evaluated in several studies (Gilja et al. 1994; Gilja et al. 1995; Thune et al. 1996). A display of the EchoPac3D software is shown in Fig. 4. The 3D ultrasound system used in our lab is outlined more in depth in a previous review (Gilja et al. 1999).
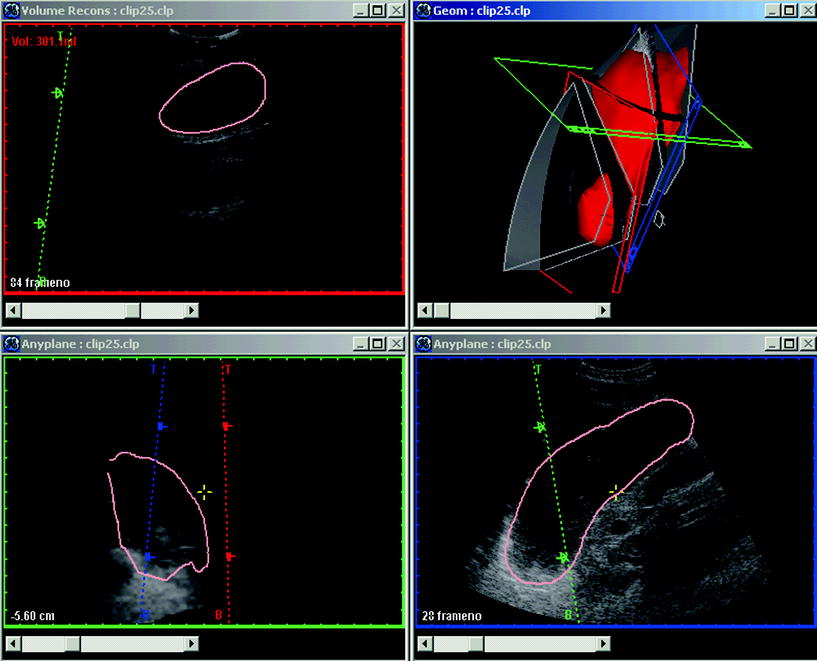
Fig. 4
A display of EchoPac3D software manufactured by GE-Vingmed Sound (Horten, Norway). In the upper right panel, the red volume is a reconstructed stomach shown in the geometry window. In the antrum an ultrasound section is displayed and this sagittal section is also depicted in the reconstruction window in the upper left panel. The visualization window, enabling application of numerous algorithms, is shown in the lower right and left panels. The software EchoPac3D® enables accurate post-processing of 3D ultrasonographic images
Ultrasound data contains a significant amount of noise and speckle and may exhibit boundary regions several pixels wide. It is important to keep in mind that the quality of the final 3D data display strongly depends on the resolution of the raw data. Transducer frequency and lateral resolution, frame rate of the scanner, accuracy of 3D probe, speed of scanning, methods of filtering and segmentation, are all factors that influence the final image and subsequently volume measurements. Furthermore, there is no advantage in sampling over a spatial scale that is much smaller than the resolution cell of the display system. The ultrasound sampling conditions using a specific transducer is closely related to the display parameters.
3 Three-Dimensional Ultrasonography of the Stomach
Two-dimensional (2D) ultrasonography has been utilized to assess gastric emptying in patients with functional dyspepsia (Bolondi et al. 1985; Duan et al. 1993; Hou et al. 1992; Berstad and Gilja 2004), diabetes mellitus (Dorlars et al. 1994), and in infants with gastroesophageal reflux (Li Voti et al. 1992). In several studies, repeated single 2D ultrasonic sections of the antrum have been applied to measure gastric emptying rates (Desaga and Hixt 1987; Dorlars et al. 1994; Duan et al. 1993; Hou et al. 1992; Newell et al. 1993). To estimate volumes of the gastric antrum by means of 2D ultrasound, a sum-of-cylinders method (Radberg et al. 1989) and simple formulas (Bolondi et al. 1985) have been used. Volume estimation based on 2D sonograms is subject to significant error because assumptions regarding geometrical shape of the antrum need to be made before reliable volume measurements can be performed.
To overcome these limitations, a method for volume estimation of organs and tissue based on three-dimensional (3D) ultrasonography was developed (Gilja et al. 1994). Using a motor device, the transducer was tilted through an angle of 90°, capturing sequential 2D-frames before the data set was transferred to a graphic workstation for final 3D processing. This 3D ultrasound system demonstrated excellent accuracy in vitro both on phantoms (Thune et al. 1996) and on animal organs (Gilja et al. 1994), and intra- and interobserver variation was low. When validated in vivo against MRI, this 3D ultrasound system was in good agreement and presented high precision (Gilja et al. 1995). This system has also been used to study diseases of the liver (Hokland and Hausken 1994), and to evaluate patients with functional dyspepsia (Berstad et al. 1994; Gilja et al. 1996a; Hausken et al. 1994). Despite the significant achievements with respect to accuracy in volume estimation and 3D reconstruction of tissue and organs, this 3D system could only acquire a 90° fan-like data set from a predetermined, fixed orientation of the transducer. Accordingly, although highly accurate, a mechanical acquisition system like this poses great limitations to acquisition, because only small volumes can be captured.
Random acquisition of 3D ultrasound data has been achieved by utilizing different devices to locate the exact position and orientation of the transducer in space. To enable scanning of a large organ like the fluid-filled stomach, a commercially available magnetometer-based position and orientation measurement (POM) device was interfaced to the scanner. This system for magnetic scanhead tracking (Bird, Ascencion Technology Inc., Vermont, USA) was validated both with respect to its precision in locating specific points in space (Detmer et al. 1994) and to its accuracy in volume estimation (Hodges et al. 1994; Matre et al. 1999). In these studies, the sensor system worked satisfactorily in scanning human organs, and high precision and accuracy were revealed in volume estimation.
For the first time, total gastric volumes and intragastric distribution of meals could be studied by ultrasonography (Gilja et al. 1997). In this study, the depth of scanning was adjusted to fit each individual’s habitus, averaging 17.6 cm. Sagittal sections of the stomach were recorded throughout its entire length, starting in the proximal part where the transducer was positioned by the left subcostal margin and tilted cranially to image the most superior part of the stomach. After stepwise scanning of the proximal stomach angling from left to right, the transducer was moved and held to insonicate normally to the skin surface. Then the distal stomach was scanned stepwise moving distally to the gastroduodenal junction. The image data and the position and orientation data were transferred to a workstation for final processing. A 3D reconstruction of the total stomach volume based on magnetic scanhead tracking from this first study is depicted in Fig. 5.
Fig. 5
A wire-frame outline of the total stomach volume after ingestion of a soup meal serving as contrast medium. The images used for 3D reconstruction are acquired by ordinary 2D ultrasonography and magnetic scanhead tracking enables precise acquisition and reconstruction of the organ
The stomach is a large and geometrically complex organ to study by ultrasonography. Therefore, we have validated this 3D ultrasonographic method in vivo in healthy controls. A barostat bag was positioned in the proximal stomach of six healthy subjects who underwent scanning with the Bird® magnetic system. In steps of 100, up to 700 ml of meat soup was instilled into and subsequently aspirated from the barostat bag while simultaneous 3D scanning was performed. This 3D ultrasound system correlated very well to infused volumes (Fig. 6) and showed very good agreement with true volumes, as well as low interobserver variation (Tefera et al. 2002). Patients with reflux esophagitis exhibited an abnormally large volume of the proximal stomach soon after a liquid meal, concomitant with the perception of fullness. The abnormal distention of the proximal stomach may represent an important pathogenetic mechanism in reflux oesophagitis.
Fig. 6
Scatter plot showing the correlation between estimated and true volumes of a barostat bag positioned in the human stomach after scanning by a 3D ultrasound system. Scanning was performed with a 3.5 MHz transducer attached to a Bird system after stepwise instillation and aspiration of the test meal. The magnetic transmitter was positioned just behind the back of the examined subject and within the performance range of the sensor (60 cm)
In functional dyspepsia, poor accommodation of the proximal stomach to a meal has been found in many studies (Ahluwalia et al. 1994; Berstad et al. 1997; Gilja et al. 1996b; Tack et al. 1998). Drinking capacity is often reduced in these patients and drink tests may therefore have a diagnostic potential. A simple drink test in combination with 3D ultrasonography was applied in a test using Toro meat soup, Nutridrink, and water (Hjelland et al. 2004). The meals were ingested at a rate of 100 mL/min until maximal drinking capacity was reached. Intragastric volume at maximal drinking capacity was determined using 3D ultrasonography (Fig. 7). Optimal discrimination between patients and controls was obtained by the combination of symptoms and intragastric volume (S/V) using meat soup as the test meal.
Fig. 7
The scanning protocol is shown using 3D ultrasound to determine maximal gastric volume after a meal in patients with functional dyspepsia. Interestingly, the fraction of symptoms per volume (S/V) distinguished best between patients and controls after a soup meal
Impaired gastric accommodation may induce dyspeptic symptoms also in postfundoplication patients. Using 3D ultrasonography, postfundoplication patients with and without dyspeptic symptoms were scanned and symptoms were scored postprandially (Scheffer et al. 2004). Dyspeptic and nondyspeptic fundoplication patients exhibited similar total gastric volumes at 5 min postprandially compared to controls, whereas smaller total gastric volumes were observed from 15 to 60 min postprandially. Distal stomach volume was more pronounced in dyspeptic fundoplication patients and related with the increase in postprandial fullness sensations. In healthy volunteers, the sensation of fullness was also related to antral volume and area rather than proximal volume (Mundt et al. 2005).
In another study, we developed an analytical method to describe the 3D geometry of the gastric antrum, gastric fundus, and the whole stomach based 3D ultrasound acquisitions. The Fourier series method was used to simulate the organ surface geometry. The principal curvatures spatial distributions were non-homogeneous in the gastric antrum, gastric fundus, and the stomach due to their complex geometry (Fig. 8). An analytical tool for characterizing the complex 3D geometry of an organ like the human stomach reconstructed by 3D ultrasound was provided (Liao et al. 2004).
Fig. 8
A 3D gastric antrum generated by the Echopac-3D program and reconstructed in a new coordinate system. In this geometry, 3D strain can be calculated and visualized following ultrasound scanning
Hausken et al. developed a noninvasive method for evaluating transpyloric flow and duodenogastric reflux stroke volumes using a 3D-guided digital color Doppler imaging model (Hausken et al. 2001). They studied healthy subjects during ingestion of a soup meal and 10 min postprandially. Cross-sectional color Doppler digital images of duodenogastric reflux episodes were acquired with a 5–3 MHz phased-array transducer. The 3D position and orientation data were acquired using a magnetic sensing system. They found high intra- and interindividual variations of the stroke volumes of transpyloric flow episodes during the initial gastric emptying. The duodenogastric reflux episodes lasted on average 2.4 s with a volume of on average of 8.3 ml. This novel method minimized geometric assumptions and angular ambiguity.
4 Three-Dimensional Endoscopic Ultrasonography
Endoscopic ultrasonography (EUS) has gained acceptance as a valuable tool in obtaining diagnostic information in patients with digestive diseases, as it enables detailed visualization of small structures along the gastrointestinal tract. However, its use has been limited to a few centers, partly due to the high demands for skills in both endoscopy and ultrasound scanning. Interpretation of 2D endosonographic images can be challenging, even for experienced operators. Therefore, the applicability of new acquisition units allowing endosonographic recordings to be imported into the general 3D reconstruction systems was investigated (Molin et al. 1996a, b; Molin et al. 1997; Molin et al. 1999). So far, 3D endosonography has been based on sequential sampling of 2D images, mainly during pull-back of radial scanning probes. The 3D data are usually displayed in an orthogonal window or by any plane slicing. In one study, endoluminal ultrasound examinations were performed with 360° radial scanning 7.5- and 12-MHz echoendoscope and miniature probes, 8 F., 12, and 20 MHz (Olympus Co Ltd, Tokyo, Japan). Acquisition of 2D ultrasound images was achieved by connecting the probes to a computer controlled linear stepping motor device (Prototype, MKAB, Gothenburg, Sweden) with an acquisition length of 0.5–15 cm and an operating speed at 10 mm/s, resulting in a distance between serial images of 0.1 to 0.2 mm. Further post-processing was performed using EchoPac3D®. These studies demonstrated that 3D endosonography enabled accurate volume estimation of a wide range of tumors (Fig. 9), and improved global display of tumor extensions and topographic relations, thus enabling better preoperative planning (Odegaard et al. 1999; Odegaard et al. 1998). We also explored other methods of 3D acquisition by testing the performance in vitro of a miniature magnetic sensor (MiniBird, Ascension Technology Corp., Burlington, VT, USA) for endoluminal ultrasound and 3D EUS (Molin et al. 2000). The magnetic 6D position and orientation measurement system (POM) was used to track different types of radial scanning endoluminal ultrasound probes. The performance of the POM system was similar if ferric or non-ferric ultrasound endoscopes were used for EUS. Sumiyama et al. later developed a linear-array 3D EUS with a miniature position sensor attached to the tip of the echoendoscope used in freehand scanning and confirmed its applicability (Sumiyama et al. 2003).
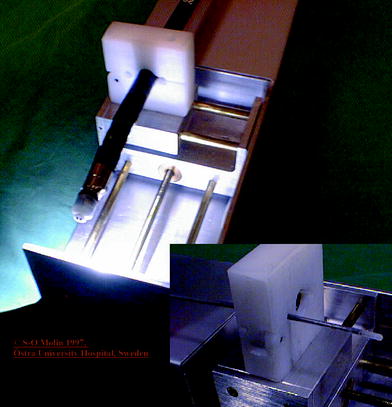
Fig. 9
The plot shows the association between estimated and true volumes after EUS scanning of a phantom in vitro. The acquisition was performed using Olympus miniprobe 12 MHz (UM-2R)
Fig. 10
A prototype acquisition unit for 3D EUS imaging that can be used both for echoendoscopes and miniprobes. The pullback system allows for a constant speed of transducer movement
In order to improve the image quality of the 3D data set by avoiding artifacts from pulsatile organs, ECG-triggered 3D EUS reconstructions was attempted (Molin et al. 1998). They found that ECG-triggered 3D EUS images could easily be obtained using a stepping motor device during routine examinations, resulting in a clear demonstration of the different wall layers in the longitudinal image axis (Fig. 10).
The lateral dislocation was 2.40 mm (SD 0.56) in non-ECG trigged examinations resulting in a “fuzzy” image in the axial display, compared to 0.19 mm (SD 0.23) in the ECG trigged scans (p < 0.0027) (Fig. 11). This resulted in higher accuracy in the evaluation of small and superficial lesions of the esophageal wall and fundic region of the stomach.
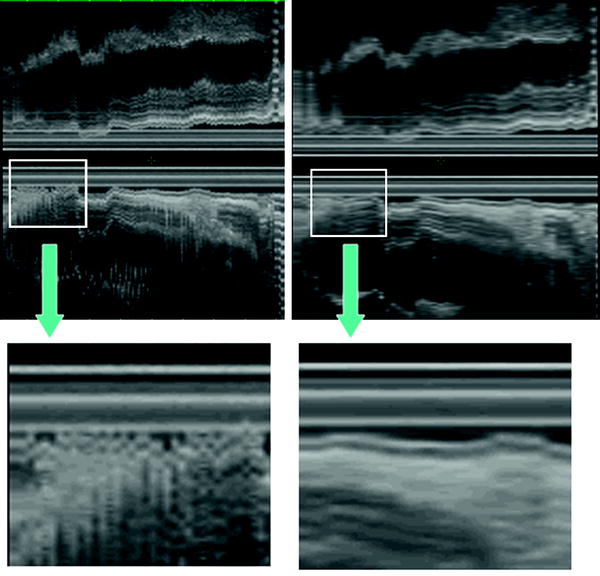
Fig. 11
The ECG-triggered 3D EUS reconstructions could be obtained during routine examinations, resulting in a clear demonstration of the different wall layers in the longitudinal image axis. In the left panel, a non-ECG-triggered EUS acquisition is depicted. Eight-French miniature ultrasound catheters 12–20 MHz (Olympus Optical Inc., Japan) were used. Image distortion was measured as lateral dislocation of the organ wall layers, perpendicular to the probe, in the longitudinal axis of the reconstructed ultrasound image. The lateral dislocation was 2.40 mm (SD 0.56) in non-ECG trigged examinations resulting in a “fuzzy” image in the axial display, compared to 0.19 mm (SD 0.23) in the ECG-triggered examination (p < 0.0027)
Other researchers have also assessed the clinical usefulness and problems of 3D images obtained by endosonography (Nishimura et al. 1997). Nishimura et al. (1997) studied 18 resected specimens of gastrointestinal lesions and 21 patients. In the resected specimens, the surface images were quite consistent with the macroscopic findings in 17 cases. In two esophageal cancers, 7 of 10 gastric cancers, and 2 colonic cancers the depth of tumor invasion was assessed accurately from the reconstructed images. In the in vivo study, although 3D displays had some limitations, it was particularly useful for esophageal and rectal lesions. They concluded that this new diagnostic method enabled visualization of the total extent of gastrointestinal lesions and appeared to have useful clinical applications.
Related posts:


Stay updated, free articles. Join our Telegram channel

Full access? Get Clinical Tree


