Fig. 6.1
Imaging of a normal liver using ARFI; the sonogram shows the velocity of shear waves and the depth of the ROI
However, the elastic values for each liver fibrosis stages as determined by ARFI, the cutoff values for grading liver fibrosis, and the diagnostic efficacy for liver fibrosis vary significantly among different studies. Zhang et al. [23] performed ARFI and FibroScan in 180 patients. The speed of the shear waves in liver fibrosis stages S0/S1, S2, S3, and S4 was 1.24 ± 0.20 m/s, 1.40 ± 0.38 m/s, 1.93 ± 0.70 m/s, and 2.19 ± 0.66 m/s, respectively. The elasticity values of distinct stages of liver fibrosis were significantly different, showing a prominent correlation to histological grades, with a correlation coefficient of 0.599. The AUROCs of ARFI for diagnosing liver fibrosis grades ≥S2, ≥S3, and S4 were 0.764, 0.852, and 0.825, respectively. This previous study indicated that ARFI had better performance in diagnosing liver cirrhosis than did FibroScan. However, both techniques possessed a similar diagnostic ability for liver fibrosis. A study of 349 various types of chronic liver disease patients conducted by Cassinotto et al. [24] compared ARFI, SSI, and FibroScan for the diagnosis and grading of liver fibrosis. The results indicated that the speeds of the shear waves propagating in S0 to S4 liver fibrosis were, respectively, 1.16 ± 0.60 m/s, 1.28 ± 0.42 m/s, 1.51 ± 0.70 m/s, 1.77 ± 0.54 m/s, and 2.24 ± 0.69 m/s. Using ≥1.35 m/s as the cutoff value for liver fibrosis ≥S1, the AUROC was 0.81, the sensitivity was 61 %, the specificity was 96 %, and the accuracy was 65 %. When using ≥1.38 m/s to diagnose liver fibrosis ≥S2, the AUROC was 0.81, and the sensitivity, specificity, and accuracy were 72 %, 81 %, and 75 %, respectively. Using ≥1.50 m/s as the cutoff value for ≥S3, the AUROC was 0.85, the sensitivity was 79 %, the specificity was 81 %, and the accuracy was 80 %. When using ≥1.61 m/s to determine S4, the AUROC was 0.84, and the sensitivity, specificity, and accuracy were 81 %, 77 %, and 78 %, respectively. The above study suggested that ARFI can differentiate between different grades of liver fibrosis; moreover, it had better diagnostic value and accuracy in severe liver fibrosis and cirrhosis. However, the diagnostic value and accuracy for grading liver fibrosis of ARFI were lower than for SSI. A meta-analysis of eight studies that included 518 cases of all types of liver fibrosis cases performed by Friedrich-Rust et al. [25] indicated that the AUROCs of ARFI in grading ≥S2, ≥S3, and S4 were 0.87, 0.91, and 0.93, respectively, and the cutoffs were 1.34 m/s, 1.55 m/s, and 1.80 m/s, respectively, with acceptable sensitivity and specificity. Generally speaking, ARFI can be used for measuring and differentiating distinct liver fibrosis stages.
Results have varied widely in studies applying ARFI for the measurement of liver fibrosis. Here, we list some possible explanations. First, different etiologies result in natural pathological diversity along liver fibrosis course. Second, diversity exists in liver stiffness in the context of liver fibrosis among different races. Bota et al. [26] studied 5 countries, 2 areas, and 1242 patients with variable etiologies, concluding that different reference values of liver stiffness for liver fibrosis should be adopted for the European and Asian populations. These authors also reported that stiffness as measured by ARFI could be affected by ALT levels. For European HCV patients with normal or mild elevated ALT, the respective diagnosing values for fibrosis ≥S2 and S4 were 1.20 m/s and 1.75 m/s, while the values for HBV patients were 1.35 and 1.55 m/s, and the values for Asian hepatitis patients with normal ALT levels were 1.30 and 1.55 m/s. Third, there was no unified standard for measuring liver fibrosis by ARFI, and the cutoff values for grading liver fibrosis differed. All of the above factors may explain the variable results to a certain degree.
Instead of an external mechanical low-frequency vibrator, ARFI uses a regular-sized ultrasound probe and can be applied in patients with the narrow intercostal spaces or ascites. This vibrator is mounted to regular ultrasound, allowing real-time observation of the ROI with guidance by gray-scale sonogram to directly avoid intrahepatic blood vessels and occupational lesions. However, Bota et al. [27] also studied the factors that influence liver fibrosis measurements made with ARFI. The results indicated that obesity, old age, and male sex had adverse effect on the success rate and accuracy of ARFI. In addition, intra-abdominal gas, large arterial pulses, and respiratory movements could interfere with the measurement. Moreover, the ARFI measurement might fail and return an invalid value of “X.XX” when the stiffness of the ROI is too high or too low. With a fixed sampling frame, the maximal depth of ARFI measurement is 8 cm, confining its measurement range. Owing to the advantages and disadvantages of ARFI mentioned above, the diagnostic standard and process still need to be optimized.
6.2.3 Application of ElastPQ for Grading Liver Fibrosis
ElastPQ is a novel ultrasound elastosonography technique that uses a shear wave-based technology. An ultrasonic radiation force impulse generates shear waves directly in the tissue, and pulse-echo technology is used to measure the shear wave propagation speed. From this value, the vibrating phase of the shear waves of different frequencies can be estimated, and the tissue elasticity coefficient can be calculated. Then, using the tissue elasticity distribution obtained by a mutual correlation elasticity reconstruction algorithm, tissue elasticity is calculated [28]. Using a standard ultrasonic transducer, and the data being added to a two-dimensional ultrasonogram, ElastPQ represents tissue stiffness (kPa) directly on the sonogram. Recently, the iU22 ultrasound diagnosis system with ElastPQ technology developed by Philips has been applied in practice. However, studies on this technology are limited owing to its short appearance. Some researchers have already applied it for the quantification of liver fibrosis grades, and some have used it for differentiating benign or malignant liver tumors. All of the above studies showed its potential in measuring tissue stiffness and quantification of liver fibrosis grades.
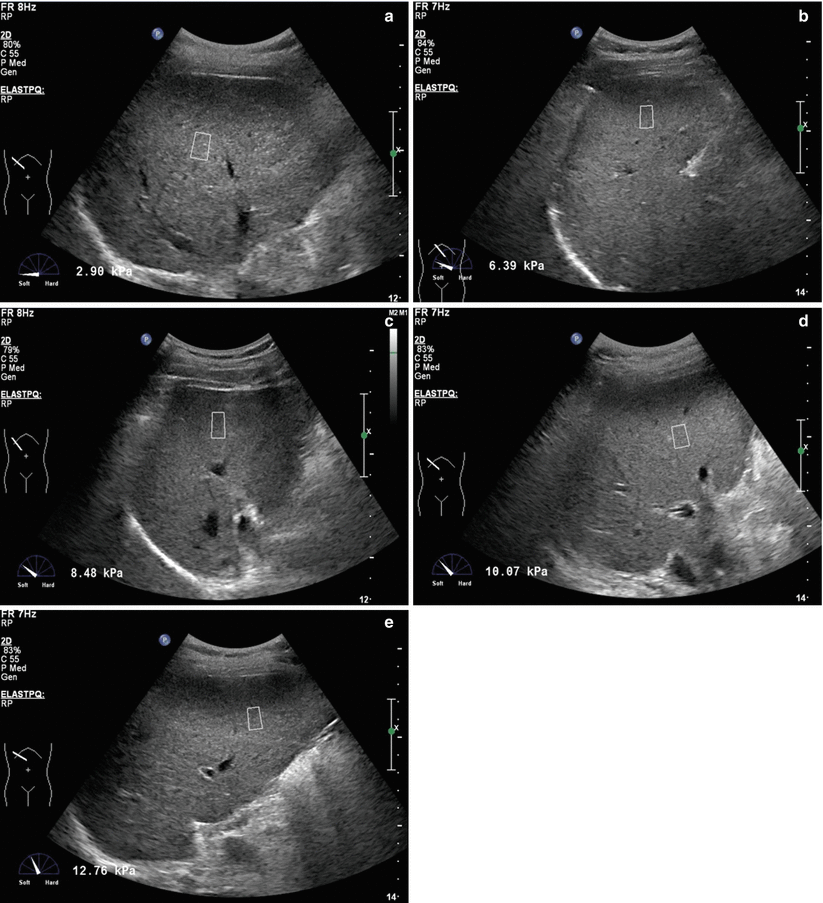
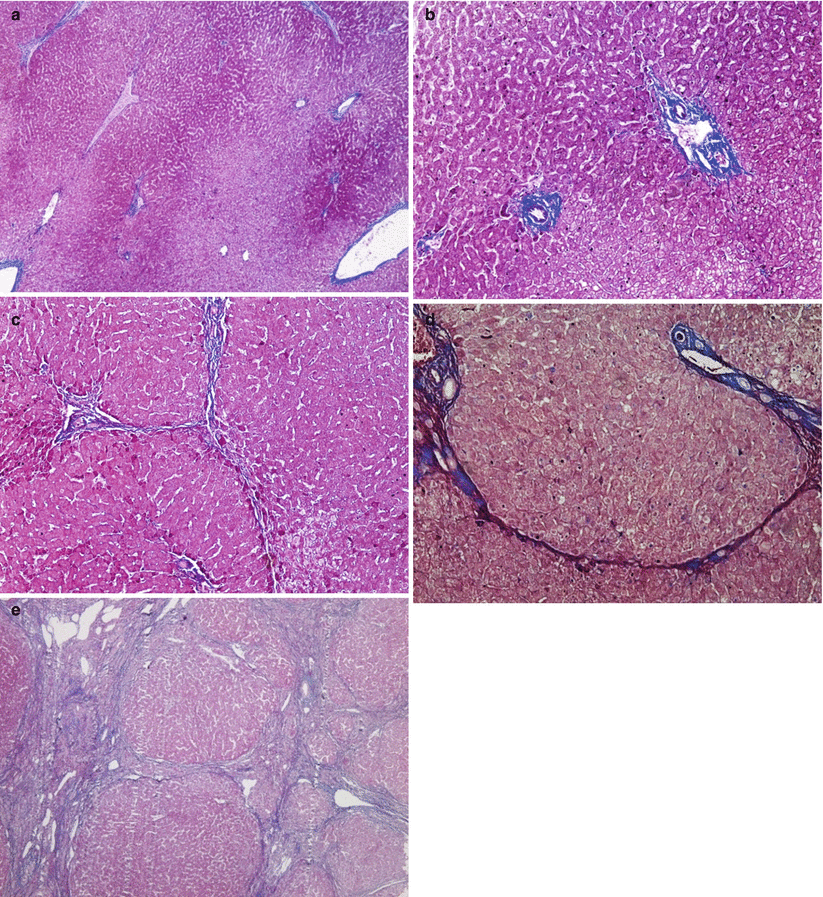
Numerous efforts have been made by our department to apply ElastPQ in grading liver fibrosis. We performed ElastPQ on 278 HBV patients undergoing hepatectomy due to liver cancer from 2011 to 2013. The ROI was liver parenchyma more than 2 cm away from the liver tumors, the area of sampling was 15 × 10 mm, and the elasticity value was displayed directly on a two-dimensional sonogram. The surgical samples we used provided us with more representative histological results than did the liver biopsy. Our study indicated a significant positive correlation between ElastPQ values and liver fibrosis grades, with correlation coefficients of 0.704 (95 % CI: 0.639–0.759). For detailed ElastPQ values for different liver fibrosis grades, see Table 6.1. Figures 6.2 and 6.3 illustrate the corresponding sonogram and histological images. Moreover, we analyzed the diagnostic value and accuracy of ElastPQ in diagnosing liver fibrosis grades. Using 5.8 kPa as the cutoff for fibrosis ≥S1, the AUROC was 0.959, and the sensitivity, specificity, and accuracy were 88.4 %, 100 %, and 89.9 %, respectively. The AUROC was 0.943 when using 6.9 kPa to determine liver fibrosis ≥S2, and the corresponding sensitivity, specificity, and accuracy were 81.6 %, 97.4 %, and 84.2 %, respectively. Using 9.1 kPa as cutoff value for fibrosis ≥S3 showed an AUROC of 0.887, a sensitivity of 67.6 %, a specificity of 93.5 %, and an accuracy of 75.5 %. When applying 10.4 kPa for diagnosing S4, the AUROC was 0.855 (sensitivity 62.2 %, specificity 87.4 %, and accuracy 75.9 %). ElastPQ appeared to have a similar diagnostic value for liver cirrhosis compared with other ultrasonic elastography methods based on shear wave technology, such as FibroScan and ARFI. Similarly, this technique showed diagnostic accuracy for no/mild or significant fibrosis (≥S2) and cirrhosis (S4) in chronic HBV patients. Furthermore, we analyzed the influence of necroinflammation degrees and copies of HBV-DNA and ALT on liver stiffness. The results indicated a slight correlation between necroinflammation and liver stiffness (r = 0.393), which was in accordance with Ma et al.’s [29] study. Additionally, ElastPQ might overestimate liver fibrosis in patients with elevated ALT levels or high copy numbers of HBV-DNA. Ma et al.’s [29] study of 291 HBV patients noted that S3 and S4 liver stiffness measured by ElastPQ were 8.71 ± 3.14 kPa and 10.87 ± 5.25 kPa, which is significantly lower than those in our study. However, their values for S0-S2 liver fibrosis were similar to ours. These differences may be due to different proportions of liver fibrosis patients in these studies. We included a patient population undergoing surgery with a potentially larger proportion of S3 and S4 fibrosis compared with the patients undergoing liver biopsies in Ma et al.’s study with a potentially smaller proportion of S4 fibrosis.


Table 6.1
Liver stiffness values for different fibrosis stages
Fibrosis stage | Mean (kPa) | Range (kPa) | SD |
|---|---|---|---|
S0 | 4.6 | 3.4–5.8 | 0.8 |
S1 | 5.5 | 3.4–7.9 | 1.2 |
S2 | 7.5 | 3.9–11.3 | 1.8 |
S3 | 9.4 | 5.6–17.8 | 3.1 |
S4 | 13.0 | 4.8–38.3 | 5.3 |

Fig. 6.2
(a) ElastPQ sonogram of liver fibrosis S0. (b) ElastPQ sonogram of liver fibrosis S1. (c) ElastPQ sonogram of liver fibrosis S2. (d) ElastPQ sonogram of liver fibrosis S3. (e) ElastPQ sonogram of liver fibrosis S4

Fig. 6.3
(a) Histological image for S0 (Masson staining, 4×). (b) Histological image for S1 (Masson staining, 10×). (c) Histological image for S2 (Masson staining, 4×). (d) Histological image for S3 (Masson staining, 4×). (e) Histological image for S4 (Masson staining, 4×)
Moreover, we explored factors that influenced the stiffness measurements of ElastPQ [30]. The results revealed differences between ElastPQ values in different liver segments. The value and consistency of the right lobe of the liver, especially the right anterior inferior segment, were significantly higher than those of the left lobe. The respiratory phase might influence measured liver stiffness. In our study, liver stiffness at the end-expiratory phase was higher than that at the end-inspiratory phase. However, age, direction of the probe, and body mass index (BMI) showed no significant effect on the measured liver stiffness. The influence of different genders on liver stiffness remains controversial. Similar to ARFI, with a fixed sampling frame, the maximal depth of ElastPQ measurements is 8 cm, confining its measurement range. As a result, standardization of the measurement process with ElastPQ is needed.
6.2.4 Application of SSI for Grading Liver Fibrosis
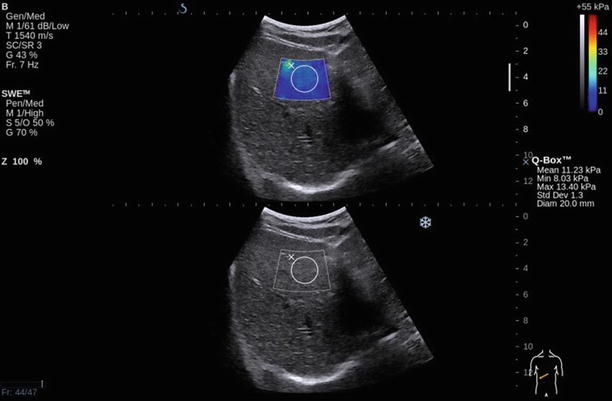
Super-speed acoustic radiation force impulses emitted by medical-frequency ultrasound probe focus consecutively along the acoustic axis at different depths of the tissue, causing simultaneous dislocation of the tissue along the acoustic axis, forming a conical shear wave front is formed, an effect also known as Mach cone effect. Based on this effect, SSI not only improves the propagation efficiency of the shear wave but also avoids adverse bio-effects due to continuous focus on the same site. In addition, adopting a super-speed video mapping technique to trace and detect the real-time propagation velocity of the shear wave and to perform video mapping provides a real-time shear wave elasticity image with ultrahigh time resolution and tissue stiffness values [31, 32]. The SSI technology that is currently used in practice is Aixplorer ShearWaveTM, a real-time ultrasonic shear wave elastography system developed by the French company SuperSonic Imagine. In ShearWaveTM elastography, ultrafast imaging is performed at 20,000 frames/s, which allows for real-time acquisition and tracing of the shear wave. With the real-time elasticity image of the shear wave, the Young modulus of the tissue is acquired, meaning that the stiffness of the ROI is directly acquired. These data are representing on the elasticity image using a color-coded technique (see Fig. 6.4, expressed as kPa). The SSI value increases with tissue stiffness.


Fig. 6.4
Liver stiffness of S4 measured by SSI
SSI is widely applied in practice and in the noninvasive quantitative evaluation of liver fibrosis in research. Because of the short-time clinical application, studies have shown differences in the diagnostic efficiency of SSI for liver fibrosis; however, the results suggest that it has great value in grading liver fibrosis. Jeong et al. [33] studied SSI on 70 chronic liver disease patients with various causes. The liver stiffness was positively correlated with the liver fibrosis grade, with a correlation coefficient of 0.774. The stiffness values for fibrosis S0-1, S2, S3, and S4 were 6.77 ± 1.72 kPa, 9.98 ± 3.99 kPa, 15.80 ± 7.73 kPa, and 22.09 ± 10.09 kPa, respectively. When defining 8.6 kPa as the cutoff for fibrosis ≥S2, the AUROC was 0.915, the sensitivity was 78.20 %, and the specificity was 93.30 %. When using 10.46 kPa to diagnose fibrosis ≥S3, the AUROC, sensitivity, and specificity were 0.913, 88.60 %, and 80.00 %, respectively. Using 14.00 kPa as the cutoff for fibrosis S4 showed an AUROC of 0.878, a sensitivity of 77.30 %, and a specificity of 85.40 %. In this study, we noted that the diagnostic ability of SSI for S4 was slightly lower than that for ≥S2 and ≥S3, which is inconsistent with several other studies. Jeong et al. attributed this difference to insufficient sample size. A study of SSI applied in 206 HBV patients performed by Zeng et al. [34] indicated that liver stiffness values for S0, S1, S2, S3, and S4 were 5.7 kPa, 6.3 kPa, 8.2 kPa, 11.3 kPa, and 18.1 kPa, respectively. The AUROC values were 0.917, 0.945, and 0.945, respectively, when using 7.2 kPa, 9.1 kPa, and 11.7 kPa for diagnosing cutoffs of ≥S2, ≥S3, and S4. This study showed a high diagnostic value of SSI for diagnosing HBV-related liver fibrosis, especially severe liver fibrosis and cirrhosis. Moreover, a significant correlation existed between liver stiffness and both γ-glutamyltranspeptidase and serum albumin. Ferraioli et al. [35] compared SSI and FibroScan applied on 121 chronic HCV patients. The results showed a positive correlation between liver fibrosis grades and liver stiffness as measured by both SSI and FibroScan, with correlation coefficients of 0.83 and 0.74, respectively. Liver stiffness values for S0-1, S2, S3, and S4 were 6.2 kPa, 7.6 kPa, 10.0 kPa, and 15.6 kPa, respectively. SSI showed better diagnostic ability for fibrosis ≥S2 than did FibroScan (AUROC 0.92 vs. 0.84, respectively). Both SSI and FibroScan showed a similar ability in diagnosing ≥S3 and S4 fibrosis (AUROC 0.96 and 0.98 vs. 0.96 and 0.98, respectively). However, Cassinotto et al. [24] compared SSI, ARFI, and FibroScan for grading liver fibrosis in 349 various types of chronic liver disease patients. The results indicated that SSI had better diagnostic ability for ≥S2 fibrosis than did ARFI, but the diagnostic ability was similar to that of FibroScan. The AUROCs of SSI, ARFI, and FibroScan were 0.88, 0.81, and 0.84, respectively. SSI performed better in diagnosing fibrosis ≥S3 than did ARFI and FibroScan, with AUROC values of 0.93, 0.89, and 0.87, respectively. However, the three techniques showed no difference in differentiating S4, with AUROC values of 0.93, 0.90, and 0.90, respectively. In contrast to the results mentioned above, the study conducted by Deffieux et al. [36] of 120 chronic liver disease patients using SSI and FibroScan showed no difference in diagnostic ability for all liver fibrosis grades.
Stay updated, free articles. Join our Telegram channel

Full access? Get Clinical Tree


