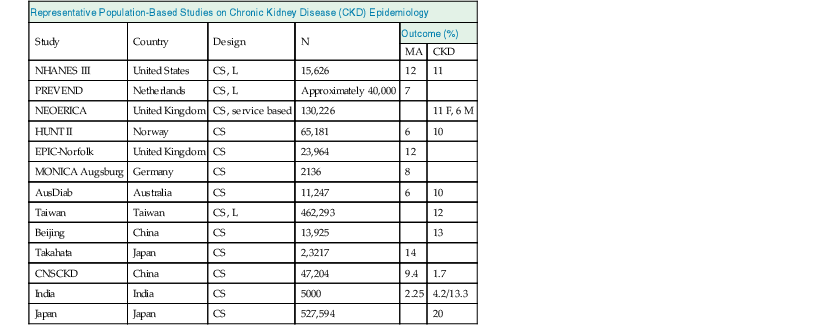
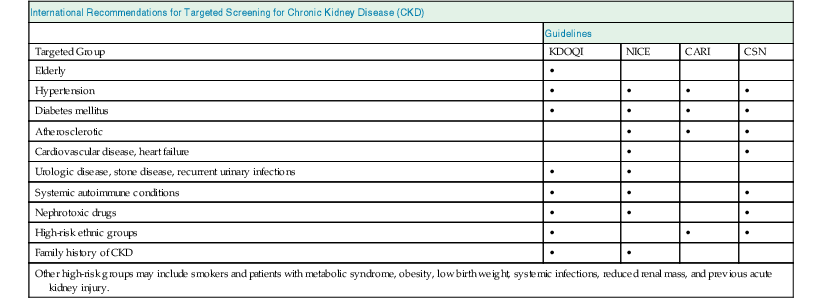
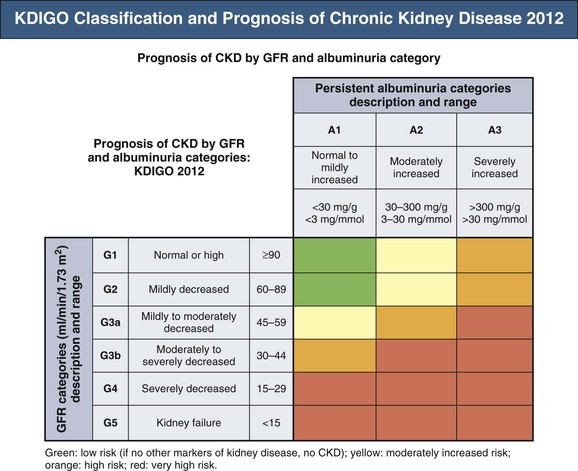
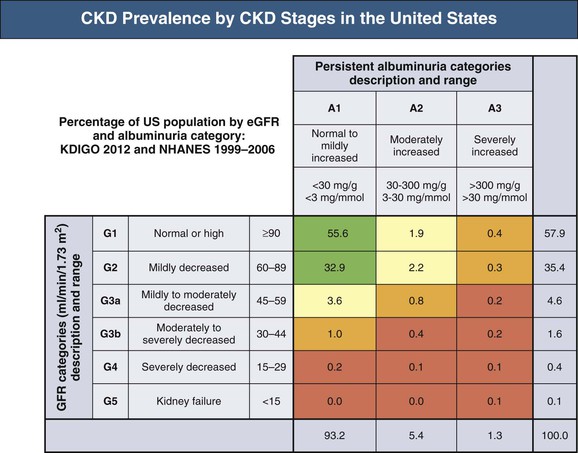
Meguid El Nahas, Arif Khwaja Chronic kidney disease (CKD) is defined as kidney damage or an estimated glomerular filtration rate (eGFR) below 60 ml/min/1.73 m2 persisting for 3 months or more irrespective of the cause. The Kidney Disease Outcomes Quality Initiative (KDOQI) guidelines have classified CKD into five stages.1 The Kidney Disease: Improving Global Outcomes (KDIGO) group suggested clarifications including the addition of the suffix T for patients with renal allografts and D to identify CKD stage 5 patients on dialysis. The latest 2012 KDIGO CKD classification recommends detailing the cause of CKD and classifying into six categories related to glomerular filtration rate (G1 to G5, with G3 split into 3a and 3b) but also based on three levels of albuminuria (A1, A2, and A3), each assessed according to the urinary albumin-creatinine ratio (in mg/g or mg/mmol in an early morning “spot” urine sample). The term microalbuminuria is no longer incorporated into this classification; the term moderate level of albuminuria is used (30 to 300 mg/g or 2.5 to 30 mg/mmol) (Fig. 79-1).2 The improved classification of CKD has been of benefit to identify prognostic indications related to decreased kidney function as well as increased albuminuria. This has led to increased awareness of CKD as well as appreciation of the significant impact of CKD on health care worldwide. However, a downside of the use of the classification systems is the possible overdiagnosis of CKD, at least among certain categories of eGFR and albuminuria, especially among the elderly. The current CKD classification is based on eGFR (see Chapter 3). The Modification of Diet in Renal Disease (MDRD) study equation and the more recently developed Chronic Kidney Disease Epidemiology Collaboration (CKD-EPI) equation are both commonly used equations to calculate eGFR; however, both are relatively inaccurate in reflecting measured glomerular filtration rate (mGFR) above 60 ml/min/1.73 m2. This underestimation by eGFR of true mGFR can lead to misclassification of a large number of individuals as having CKD stage 3a, whereas in reality their true GFR is above 60 ml/min. Also, the inaccuracy of eGFR to reflect mGFR above 60 ml/min/1.73 m2 makes the distinction between CKD stages 1 and 2 difficult and artificial. The limitations of using creatinine-based estimations have spurred the search for alternative filtration biomarkers, such as β-trace protein (βTP), cystatin C, and β2-microglobulin (β2M). (See Chapter 3 for alternative estimations of GFR.) Isolated microalbuminuria (i.e., moderate level albuminuria; A2 category) is a common feature of aging and can be associated with a large number of acute and chronic inflammatory as well as vascular pathologies.3 It is also associated with obesity, cigarette smoking, and unhealthy diets. Furthermore, microalbuminuria is often transient and reversible, thus not justifying its specific defining role in CKD (stages 1 and 2). Whereas microalbuminuria may highlight those at increased relative risk of CKD progression or cardiovascular risk, the absolute risk to the individual remains low. Therefore the retention of microalbuminuria as a sole definition of CKD in spite of its obvious lack of specificity to kidney disease remains controversial and potentially misleading. The great majority of individuals classified as having CKD in the community are over the age of 60 years—in part a reflection of physiologic age-related decrease in kidney function.3 The current CKD definition and classification are age neutral; therefore the difference in outcomes among different age groups is not recognized. Thus, under the current classification, an 80-year-old man with G4A1 is deemed to be at higher risk of progression to end-stage renal disease (ESRD) than a 20-year-old with G3A2, yet the outcomes in CKD are markedly age sensitive. This was elegantly demonstrated by the calculation of a threshold eGFR. ESRD exceeded the risk of death in a cohort of more than 200,000 U.S. veterans with CKD stages 3 to 5; the level of eGFR below which the risk of ESRD exceeded the risk of death varied by age, being 45 ml/min/1.73 m2 for 18- to 44-year-olds to 15 ml/min/1.73 m2 for those 65 to 85 years old.4 Thus in the absence of associated albuminuria, CKD is seldom progressive to ESRD in the elderly, as it may to a large extent reflect age-related decline in kidney function. The current classification takes no notice of the single most important risk factor associated with CKD, namely, systemic hypertension. The current classification also does not determine whether CKD is progressive or not—that is, it does not incorporate values for the trajectory of renal function (eGFR) over time. KDIGO suggests defining progressive kidney disease as a sustained decline in eGFR of more than 5 ml/min/1.73 m2/yr or a decline in GFR category accompanied by a greater than 25% drop in eGFR from baseline. Defining progression is problematic because the eGFR equations perform relatively poorly when the GFR is greater than 60 ml/min/1.73 m2 and because serum creatinine often fluctuates in patients with nonprogressive CKD. Also, declining true or measured GFR concomitant with loss of muscle mass (sarcopenia) may not be appropriately detected by creatinine-based eGFR assessment. Thus the current classification system has no mechanism to alert the clinician to the patients in whom the disease is actually progressing and who therefore may require intervention. Altogether, although classification of CKD based on eGFR and albuminuria has undoubted advantages and has achieved greater awareness of CKD and its impact on global health, there remain a number of limitations that may give rise to misinterpretation and miscategorization of individuals, particularly in the growing elderly population. The true incidence and prevalence of CKD within a community are difficult to ascertain because early to moderate CKD is usually asymptomatic. However, various epidemiologic studies suggest a prevalence of CKD of approximately 10% to 14% in the general population, albuminuria (mostly microalbuminuria or A2) of approximately 7%, and GFR below 60 ml/min/1.73 m2 of approximately 3% to 5% (Fig. 79-2 and Table 79-1).5 Most of these studies are limited by the fact that individuals were tested only once; thus the studies merely reflect a snapshot with no clear evidence of chronicity.6 KDOQI stipulates that tests should be undertaken on three occasions over a 3-month period, with two of three results being consistently positive to justify the labeling of chronicity and CKD.1 Of note, the high reported prevalence of CKD is confounded by a number of facts: ▪ Formulas such as those of MDRD and CKD-EPI are used to estimate GFR in spite of their known limitations (see Chapter 3). It is interesting to note that the prevalence of CKD in communities varies up to threefold based on the type of equation applied.7 All these limitations of current CKD screening strategies are at risk of overinflating the true prevalence of significant CKD. The rationale for screening at-risk individuals for CKD is to permit earlier detection of CKD, allowing interventions aimed at slowing its progression. In addition, detection of CKD may identify individuals within communities at risk for complications, including cardiovascular disease (CVD) and associated morbidity and mortality. Several guidelines for screening, mostly targeted at high-risk individuals, have been issued and implemented worldwide. Those include the KDOQI guidelines in the United States, the CKD National Institute for Health and Care Excellence (NICE) guidelines, and the Australian Caring for Australasians with Renal Impairment (CARI) guidelines. There are few differences regarding the recommended targeted high-risk populations, but they invariably include individuals with hypertension and diabetes mellitus (Table 79-2). The KDOQI guidelines additionally recommend screening those older than 65 years. Screening should consist of urinalysis, a urine albumin or protein estimation (such as urine albumin-creatinine ratio [uACR]), and measurement of serum creatinine and estimation of GFR (see Chapter 3), preferably by the CKD-EPI equation (KDIGO 2012). Targeted screening is the most cost-effective approach, and there is no evidence to justify screening asymptomatic individuals in the general population for CKD (see Table 79-2).8 Chronic kidney disease screening would best be associated with broader national strategies and programs to minimize obesity, diabetes, hypertension, and primarily CVD. This is the essence of the U.K. National Vascular Campaign strategy launched in 2009 and of the campaigns implemented by the Centers for Disease Control and Prevention (CDC) in the United States and in Australia. Incidence rates of ESRD refer to the number of patients per million population per year (pmp/yr) beginning renal replacement therapy (RRT). Incidence rates of ESRD in most national registries do not take into account patients not treated with RRT and therefore underestimate the true incidence of ESRD (CKD stage G5). This is true not only in countries where provision of RRT is limited or absent, but also in countries where there is an active conservative management program for patients who opt not to have RRT (Table 79-3). Table 79-3 Incidence and prevalence of ESRD in different countries. The prevalence rate of ESRD is the number of patients per million population (pmp) who have undergone treatment for ESRD. Prevalence rate is a function of the incidence rate (newly treated cases) and outcomes (i.e., mortality and return of ESRD after a failed renal transplant) in a given population. It is important to note that the eGFR at initiation of dialysis will have a marked impact on the prevalence of ESRD—indeed, most of the growth in the ESRD population in the United States in the last 15 years may be accounted for by earlier initiation of dialysis rather than by a true increased incidence of ESRD.9,10 Disparities in the incidence and prevalence of ESRD relate to cultural, socioeconomic, and demographic factors. Racial and ethnic diversity within societies affects not only the prevalence of diabetes and hypertension but also progression rates and ESRD prevalence. Differing referral patterns and quality of pre-ESRD care have all been linked to the heterogeneity of ESRD rates in different parts of the world. Developed countries with liberal access policies toward ESRD treatment will logically have the highest prevalence rates of treated ESRD,11 although economically emerging countries with historically low ESRD treatment rates can experience rapid growth rates when access to treatment improves. Presently, 90% of the global RRT population is from high-income economies, and more than 100 countries have no provision for RRT. During the forthcoming decades, even industrialized nations will struggle to meet the demands of expanding ESRD programs; in the United States, the annual expenditure on ESRD will likely reach more than $52 billion by 2030.12 The improving survival rate while patients are undergoing treatment (dialysis or transplantation) aggravates the spiraling cost of care. In the United Kingdom, expenditure on ESRD currently consumes about 2% of the National Health Service budget, even though the number of patients undergoing ESRD treatment is about 0.05% of the population. Globally, the number of individuals receiving RRT has risen from 426,000 in 1990 to 2.5 million in 2010, and the cumulative global cost for RRT is estimated to exceed $1 trillion during the current decade.12 The limited provision of RRT in some low and middle economies may also reflect the fact that CKD and ESRD are not health care priorities in these countries. This is a direct consequence of the fact that CKD and its associated mortality ranked as low as the 18th cause of death in 2010, well after coronary heart disease, chronic respiratory diseases, diabetes, hypertension, cancer, and major communicable diseases.13 Increased awareness of the detrimental and multiplicative effect of CKD on other major causes of global morbidity and mortality may in the future increase the awareness of the global health care impact of CKD. A decrease in eGFR below 60 ml/min/1.73 m2 and increased albuminuria are associated with increased cardiovascular as well as overall morbidity and mortality, and the effects of combined decreased GFR and increased albuminuria on mortality are synergistic (see Chapter 82).14 However, decreased GFR and increased albuminuria are markers of ill health, thus generally reflecting poor outcomes. Also, albuminuria is increasingly defined by a raised uACR. Interpretation of the predictive value of albuminuria as albumin-creatinine ratio (ACR) is confounded by the inclusion of urine creatinine because a fall in urinary creatinine excretion that causes a rise in ACR, may also reflect ill health and the associated sarcopenia. Sarcopenia may also be associated with a low serum creatinine and an elevation of eGFR (>120 ml/min) that has been associated with poor outcomes.14 The fall in GFR with age has been linked to underlying comorbidities such as lifelong hypertension and diabetes. The term cardio-kidney-damage has been coined to highlight the close links between cardiovascular and kidney damage.15 It is therefore not surprising that CKD in the elderly predicts cardiovascular morbidity and mortality. Nevertheless, when the predictive values of albuminuria and/or eGFR on morbidity and mortality have been compared with or when these values have been added to well-established cardiovascular prognostic markers and scores, such as the Framingham Risk Score (FRS), they were found to add very little to the accuracy of risk prediction.16 Describing the natural history of CKD calls for a distinction between CKD detected in the general population (community CKD) and in those who are referred to nephrology centers (referred CKD). Community CKD is to a large extent a disease of elderly individuals with comorbidities, associated with a reduced and very slow age-related decline in GFR, with the majority dying before reaching ESRD. In contrast, referred CKD patients often have significant acquired or inherited nephropathies causing early renal functional impairment and progression with time to ESRD. The cause and natural history of these two populations is likely to be considerably different. In the developed world, the majority of community CKD is identified in older people. The average rate of decline of GFR in this population is approximately 0.75 to 1 ml/min/yr after the age of 40 to 50 years.3 CKD affects those who have had a lifelong exposure to cardiovascular risk factors—hypertension and diabetes—that can also affect the kidneys. U.S. Medicare data demonstrate that 48% of patients with CKD have diabetes, 91% are hypertensive, and 46% have atherosclerotic heart disease. Given that more than one third of aging adults have systolic hypertension and about 20% have type 2 diabetes mellitus (T2DM), it is not surprising that up to 40% of such individuals have evidence of CKD. They also have a higher incidence of cardiovascular and atherosclerotic diseases. This has led to the formulation of prediction scores of incident community-based CKD, based on the presence of vascular risk factors such as hypertension and diabetes as well as peripheral vascular disease and heart failure—the SCORED model (Screening for Occult Renal Disease).17 In a large analysis of community-based CKD over 5 years, only 1% and 20% of patients with CKD G3 and G4 required RRT, whereas 24% and 45%, respectively, died, predominantly from CVD.18 Thus death rather than progression to ESRD is the predominant outcome in elderly community-based CKD.18 Community CKD in emerging countries is often multifactorial because of communicable and noncommunicable disease affecting the kidneys. In these countries, in addition to the poverty that has an impact on CKD, individuals often develop infections that can cause CKD (see Chapters 53 to 58). They are also subject to increased globalization and westernization of lifestyle that predispose them to obesity, diabetes, hypertension, and CVD, which can lead to CKD. The renal risk is increased further by unfavorable environmental factors, including maternal deprivation and malnutrition, which relate to CKD in later life19; air and water pollution; exposure to heavy metals and agricultural pollution; and aristolochic acid (see Chapter 64) and other herbal toxins, in particular in China and Taiwan (see Chapter 78). Reports of epidemics of CKD have emanated from a number of regions of the world, including Central American countries such as Salvador, among agricultural workers in sugar cane and cotton plantations who are exposed to excessive heat resulting in chronic dehydration, hypokalemia, and premature death.20 These effects may be compounded by exposure to pesticides and consumption of nonsteroidal anti-inflammatory drugs (NSAIDs). In contrast to community CKD, the causes and natural history of referred CKD vary considerably. Patients with referred CKD often present at an earlier age because of an underlying hereditary nephropathy (such as autosomal dominant polycystic kidney disease [ADPKD]) or acquired nephropathy (such as glomerulonephritis [GN], diabetic nephropathy, or tubulointerstitial disease) causing progressive damage and loss of function. Some present early with signs of kidney damage such as moderate albuminuria or hematuria in the absence of impaired kidney function (CKD stages G1 and G2, A1 and A2). The prognosis of such patients in the absence of hypertension, overt proteinuria, and/or impaired renal function is generally good because they can remain within these stages for years without progressing to CKD stage G3 or higher. However, some go on to progress with time, thus justifying vigilance and regular follow-up. The rate of progression of referred CKD varies according to the underlying nephropathy and between individual patients. Historically, the rate of decline in GFR of patients with diabetic nephropathy has been among the fastest, averaging around 10 ml/min/yr. Control of systemic hypertension, hyperglycemia, and other factors slows the rate of GFR decline (see Chapter 80). In nondiabetic nephropathies, the rate of progression of CKD is usually faster in patients with chronic proteinuric GN than in those with chronic interstitial nephritis and low-level proteinuria. It is slowest in those with hypertensive nephrosclerosis with good blood pressure (BP) control and minimal proteinuria. Patients with ADPKD and impaired renal function, CKD stage G3b and beyond, may also have a fast rate of progression compared with patients with other nephropathies. It is generally assumed that the majority of patients with underlying nephropathies reaching CKD stages G3 to G5 progress relentlessly to ESRD, yet even in the referred population progression is variable, with a sizable percentage of patients either having stable kidney function or dying prematurely of CVD. A Canadian study showed the natural history of referred CKD stages G3 and G4 to be variable, reflecting the patient’s risk factor profile.21,22 Even some patients with CKD stage G5 remain stable for a number of years.
Epidemiology, Natural History, and Pathophysiology of Chronic Kidney Disease
Definition and Classification of Chronic Kidney Disease
Limitations of Chronic Kidney Disease Classification
Estimating Glomerular Filtration Rate
Microalbuminuria (Moderately Increased Albuminuria) as a Definition for Chronic Kidney Disease
Age-Related Decline in Kidney Function
Further Considerations
Epidemiology of Chronic Kidney Disease
Chronic Kidney Disease Detection Recommendations
Epidemiology of End-Stage Renal Disease
Incidence and Prevalence of End-Stage Renal Disease (ESRD) in Different Countries (2010)
Country and Ethnicity
Incidence
Prevalence
United States
348
1752
Caucasians
295
1218
African Americans
924
5242
Asians
320
2000
Hispanics
480
2606
Australia
101
849
Aboriginal/Torres Strait
353
2151
Japan
288
2260
Taiwan
361
2584
Mexico
425
1402
Bangladesh
20
158
United Kingdom
107
832
France
149
1060
Russia
40
186
Impact of Chronic Kidney Disease on Morbidity and Mortality
Natural History of Chronic Kidney Disease
Causes and Natural History of Community Chronic Kidney Disease
Causes and Natural History of Referred Chronic Kidney Disease
Related posts:
![]()
Stay updated, free articles. Join our Telegram channel

Full access? Get Clinical Tree


Epidemiology, Natural History, and Pathophysiology of Chronic Kidney Disease
Chapter 79