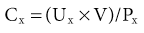
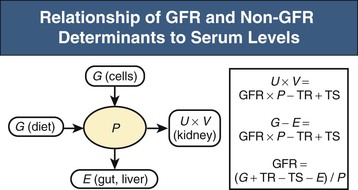
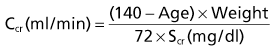
Lesley A. Inker, Li Fan, Andrew S. Levey Glomerular filtration rate (GFR) is a product of the average filtration rate of each nephron, the filtering unit of the kidneys, multiplied by the number of nephrons in both kidneys. The normal level for GFR is approximately 130 ml/min/1.73 m2 for men and 120 ml/min/1.73 m2 for women, with considerable variation among individuals according to age, gender, body size, physical activity, diet, pharmacotherapy, and physiologic states such as pregnancy. To standardize the function of the kidney for differences in kidney size, which is proportional to body size, GFR is adjusted for body surface area (BSA), computed from height and weight, and is expressed per 1.73 m2 BSA, the mean BSA of young men and women. Even after adjustment for BSA, GFR is approximately 8% higher in young men than in women and declines with age; the mean rate of decline is approximately 0.75 ml/min/yr after age 40 years, but the variation is wide, and the sources of variation are poorly understood. During pregnancy, GFR increases by about 50% in the first trimester and returns to normal immediately after delivery. GFR has a diurnal variation and is 10% lower at midnight compared with the afternoon. Within an individual, GFR is relatively constant over time but varies considerably among people, even after adjustment for the known variables. Reductions in GFR may result from a decline in the nephron number or in the single-nephron (SN) GFR from physiologic or hemodynamic alterations. An increase in SNGFR caused by increased glomerular capillary pressure or glomerular hypertrophy can compensate for a decrease in nephron number; therefore the level of GFR may not reflect the loss of nephrons. As a result, there may be substantial kidney damage before GFR decreases. The GFR cannot be measured directly. Instead, it is measured as the urinary clearance of an ideal filtration marker. Clearance of a substance is defined as the volume of plasma cleared of a marker by excretion per unit of time. The clearance of substance x (Cx) can be calculated as Cx = Ax/Px, where Ax is the amount of x eliminated from the plasma, Px is the average plasma concentration, and Cx is expressed in units of volume per time. Clearance does not represent an actual volume; rather, it is a virtual volume of plasma that is completely cleared of the substance per unit of time. The value for clearance is related to the efficiency of elimination: the greater the rate of elimination, the higher the clearance. Clearance of substance x is the sum of the urinary and extrarenal clearance; for substances that are eliminated by renal and extrarenal routes, plasma clearance exceeds urinary clearance. The amount of substance x excreted in the urine can be calculated as the product of the urinary flow rate (V) and the urinary concentration (Ux). Therefore urinary clearance is defined as follows: Urinary excretion of a substance depends on filtration, tubular secretion, and tubular reabsorption. Substances that are filtered but not secreted or reabsorbed by the tubules are ideal filtration markers because their urinary clearance can be used as a measure of GFR. For substances that are filtered and secreted, urinary clearance exceeds GFR; and for substances that are filtered and reabsorbed, urinary clearance is less than GFR. Measurement of urinary clearance requires a timed urine collection for measurement of urine volume, as well as urine and plasma concentrations of the filtration marker. Special care must be taken to avoid incomplete urine collections, which will limit the accuracy of the clearance calculation. Interest in measurement of plasma clearance continues because it avoids the need for a timed urine collection. GFR is calculated from plasma clearance (Cx) after a bolus intravenous injection of an exogenous filtration marker, with the clearance (Cx) computed from the amount of the marker administered (Ax) divided by the average plasma concentration (Px), which can be computed from the area under the curve of plasma concentration versus time. The decline in plasma levels is secondary to the immediate disappearance of the marker from the plasma into its volume of distribution (fast component) and to renal excretion (slow component). Plasma clearance is best estimated by use of a two-compartment model that requires blood sampling early (usually two or three time points until 60 minutes) and late (one to three time points from 120 minutes onward). As with urinary clearance, plasma clearance of a substance depends on filtration, tubular secretion, and tubular reabsorption, but in addition, extrarenal elimination. Inulin, an uncharged polymer of fructose with molecular weight of approximately 5000 daltons (d), was the first substance described as an ideal filtration marker and remains the reference (gold standard) against which other markers are evaluated. The classic protocol for inulin clearance requires a continuous intravenous (IV) infusion to achieve a steady state and bladder catheterization with multiple timed urine collections. Because this technique is cumbersome, and inulin measurement requires a difficult chemical assay, this method has not been used widely in clinical practice and remains a research tool. Alternative exogenous substances include iothalamate, iohexol, ethylenediaminetetraacetic acid, and diethylenetriaminepentaacetic acid, often chelated to radioisotopes for ease of detection (Table 3-1). Alternative protocols to assess clearance have also been validated, including subcutaneous injection and spontaneous bladder emptying. There are advantages to alternative exogenous filtration markers and methods, but also limitations. Understanding the strengths and limitations of each alternative marker and each clearance method will facilitate interpretation of measured GFR.1 Table 3-1 Exogenous filtration markers for estimation of glomerular filtration rate. 51Cr-EDTA, Chromium 51–labeled ethylenediaminetetraacetic acid; GFR, glomerular filtration rate; HPLC, high-performance liquid chromatography; IV, intravenous; 99mTc-DTPA, technetium 99m–labeled diethylenetriaminepentaacetic acid. Endogenous filtration markers are substances generated in the body at a relatively constant rate and eliminated largely by glomerular filtration. Therefore, the serum level correlates highly with measured GFR after accounting for factors other than GFR that influence the non-GFR determinants. Currently identified endogenous filtration markers include low-molecular-weight metabolites and serum proteins. Filtered metabolites may undergo reabsorption or secretion, which contribute to their urinary excretion. Comparison to urinary clearance of exogenous filtration markers enables inferences about the renal handling of endogenous filtration markers. By contrast, filtered serum proteins are reabsorbed and degraded within the tubule with minimal appearance in the urine. For filtration markers excreted in the urine, urinary clearance can be computed from a timed urine collection and a single measurement of serum concentration. If the serum level is not constant during the urine collection, as in acute kidney disease or when residual kidney function is assessed in dialysis patients, it is necessary to obtain additional blood samples during the urine collection to estimate the average serum concentration. Creatinine is the most frequently used endogenous filtration marker in clinical practice. Urea was widely used in the past, and cystatin C presently shows great promise (Table 3-2). Table 3-2 Comparison of creatinine, urea, and cystatin C as filtration markers. ELISA, Enzyme-linked immunosorbent assay; GFR, glomerular filtration rate; IDMS, isotope-dilution–mass spectroscopy; PENIA, particle-enhanced nephelometric immunoassay; PETIA, particle-enhanced turbidimetric immunoassay. (Modified with permission from reference 2.) Figure 3-1 shows the relationship of plasma concentration of substance x to its generation (Gx) by cells and dietary intake, urinary excretion (Ux × V), and extrarenal elimination (Ex) by gut and liver. The plasma level is related to the reciprocal of the level of GFR, but it is also influenced by generation, tubular secretion and reabsorption, and extrarenal elimination, collectively termed non-GFR determinants of the plasma level.1 In the steady state, a constant plasma level of substance x is maintained because generation is equal to urinary excretion and extrarenal elimination. Estimating equations incorporate demographic and clinical variables as surrogates for the non-GFR determinants and provide a more accurate estimate of GFR than the reciprocal of the plasma level alone. Estimating equations are derived from regression of measured GFR on measured values of the filtration marker and observed values of the demographic and clinical variables. Estimated GFR (eGFR) may differ from measured GFR in a patient if a discrepancy exists between the true and average values for the relationship of the surrogate to the non-GFR determinants of the filtration marker. Other sources of errors include measurement error in the filtration marker (e.g., failure to calibrate assay for filtration marker to assay used in development of equation), measurement error in GFR in development of the equation, and regression to the mean. In principle, all these errors are likely to be greater at higher values for GFR.2 Creatinine is a 113-d end product of muscle catabolism. Advantages of creatinine include its ease of measurement and the low cost and widespread availability of assays. Disadvantages include the large number of non-GFR determinants, leading to a wide range of GFR for a given serum creatinine level (see Table 3-2). For example, a serum creatinine level of 1.5 mg/dl (132 µmol/l) may correspond to a GFR from approximately 20 to 90 ml/min/1.73 m2. Creatinine is derived by the metabolism of phosphocreatine in muscle as well as from dietary meat intake or creatine supplements. Creatinine generation is proportional to muscle mass, which can be estimated from age, gender, race, and body size. Table 3-3 lists factors that can affect creatinine generation.3 Table 3-3 Factors affecting serum creatinine concentration. (Modified from reference 3.) Creatinine is released into the circulation at a constant rate during normal physiologic conditions. It is not protein bound and is freely filtered across the glomerulus and secreted by the tubules. Several medications, such as cimetidine and trimethoprim, competitively inhibit creatinine secretion and reduce creatinine clearance. These medications thus lead to a rise in the serum creatinine concentration without an effect on GFR (Table 3-3). In addition, creatinine is contained in intestinal secretions and can be degraded by bacteria. If GFR is reduced, the amount of creatinine eliminated through this extrarenal route is increased. Antibiotics can raise serum creatinine concentration by destroying intestinal flora, thereby interfering with extrarenal elimination, as well as by reducing the GFR. The rise in serum creatinine concentration after inhibition of tubular secretion and extrarenal elimination is greater in patients with a reduced GFR. Clinically, it can be difficult to distinguish a rise in serum creatinine concentration caused by inhibition of creatinine secretion or extrarenal elimination from a decline in GFR. However, processes other than a decrease in GFR should be suspected if serum urea concentration remains unchanged despite a significant change in serum creatinine concentration in a patient with an initially reduced GFR. Creatinine clearance is usually computed from the creatinine excretion in a 24-hour urine collection and single measurement of serum creatinine in the steady state. Creatinine excretion rates vary with age, gender, and race and are approximately 20 to 25 mg/kg/day and 15 to 20 mg/kg/day in a complete collection in healthy young men and women, respectively. Equations are available to estimate the creatinine excretion from age, gender, weight, and other variables.4 Deviations from these expected values can give some indication of errors in timing or completeness of urine collection. Creatinine clearance systematically overestimates GFR because of tubular creatinine secretion. In the past the amount of creatinine excreted by tubular secretion at normal levels of GFR was thought to be relatively small (10% to 15%), but with newer, more accurate assays for low values of serum creatinine, this difference may be substantially greater. At low values of GFR, the amount of creatinine excreted by tubular secretion may exceed the amount filtered.2 Historically, the most common assay for measurement of serum creatinine was the alkaline picrate (Jaffe) assay that generates a color reaction. Chromogens other than creatinine are known to interfere with the assay, giving rise to errors of up to approximately 20% in normal individuals. Modern enzymatic assays do not detect noncreatinine chromogens and yield lower serum levels than with the alkaline picrate assays. Until recently, calibration of assays to adjust for this interference was not standardized across laboratories, thereby limiting the estimation of GFR from serum creatinine concentrations, especially at higher GFR. To address the heterogeneity in creatinine assays, fresh-frozen serum pools with known creatinine levels traceable to an isotope-dilution–mass spectrometry (IDMS) reference are available for instrument manufacturers to standardize creatinine measurements.5 Use of standardized assays is recommended.6 Standardization will reduce, but not completely eliminate, the error in estimating GFR at higher levels (Table 3-3). Again, GFR can be estimated from serum creatinine by equations that use age, gender, race, and body size as surrogates for creatinine generation.1 Despite substantial advances in the accuracy of estimating equations based on creatinine during the past several years, GFR estimates remain imprecise, and no equation is likely to overcome the limitations of creatinine as a filtration marker. None of the equations is expected to work as well in patients with extreme levels for creatinine generation, such as amputees, large or small individuals, patients with muscle-wasting conditions, or people with high or low levels of dietary meat intake (Table 3-3). Because of differences among racial and ethnic groups according to muscle mass and diet, equations developed in one racial or ethnic group are unlikely to be accurate in multiethnic populations. As discussed later, further improvements will probably require additional filtration markers. The Cockcroft-Gault formula estimates creatinine clearance from age, gender, and body weight, in addition to serum creatinine (Box 3-1).7 An adjustment factor for women is based on a theoretical assumption of 15% lower creatinine generation because of lower muscle mass. Comparison to normal values for creatinine clearance requires computation of BSA and adjustment to 1.73 m2. Because of the inclusion of a term for “weight” in the numerator, this formula systematically overestimates creatinine clearance in edematous or obese patients. Box 3-1 Equations for estimating glomerular filtration rate. Age in years; weight in kg; Scr, serum creatinine; Scys, serum cystatin C. The Modification of Diet in Renal Disease (MDRD) study and Chronic Kidney Disease Epidemiology (CKD-EPI) equation calculator can also be found online at http://www.kidney.org/professionals/kdoqi/gfr_calculator.cfm. Equations for Estimating Glomerular Filtration Rate
Assessment of Renal Function
Glomerular Filtration Rate
Measurement of the Glomerular Filtration Rate
Concept of Clearance
Urinary Clearance
Plasma Clearance

Exogenous Filtration Markers
Exogenous Filtration Markers for Estimation of Glomerular Filtration Rate
Marker
Method of Administration
Comments
Inulin
Continuous IV infusion
Gold standard
Iothalamate
Bolus IV injection or subcutaneous injection
Can be administered as radioactive compound with iodine 125 (125I) as the tracer or in nonradioactive form, with assay using HPLC methods. In radioactive form, potential problem of thyroid uptake of 125I. Iothalamate is secreted, leading to overestimation of GFR
99mTc-DTPA
Bolus IV injection
Dissociation of 99mTc leads to plasma protein binding and underestimation of GFR
51Cr-EDTA
Bolus IV injection
10% lower clearance than inulin
Iohexol
Bolus IV injection
Low incidence of adverse effects; comparable to inulin; expensive and difficult to perform assay
Endogenous Filtration Markers
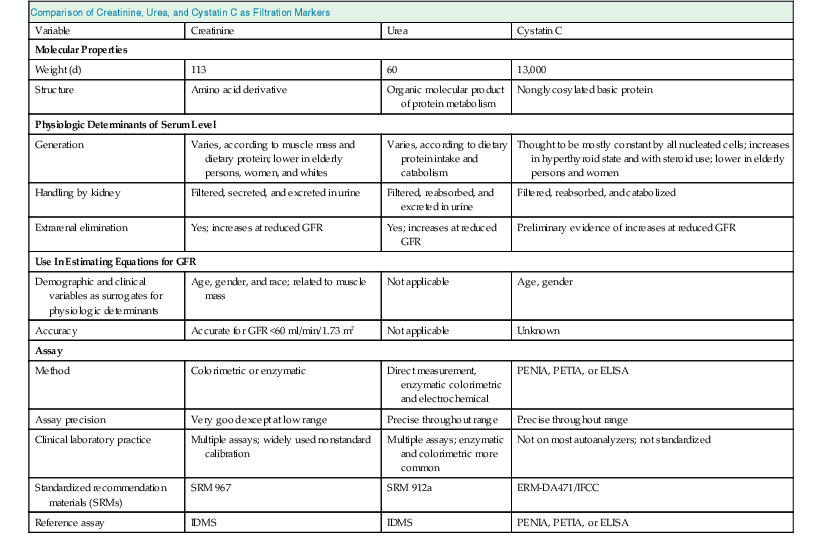
Comparison of Creatinine, Urea, and Cystatin C as Filtration Markers
Variable
Creatinine
Urea
Cystatin C
Molecular Properties
Weight (d)
113
60
13,000
Structure
Amino acid derivative
Organic molecular product of protein metabolism
Nonglycosylated basic protein
Physiologic Determinants of Serum Level
Generation
Varies, according to muscle mass and dietary protein; lower in elderly persons, women, and whites
Varies, according to dietary protein intake and catabolism
Thought to be mostly constant by all nucleated cells; increases in hyperthyroid state and with steroid use; lower in elderly persons and women
Handling by kidney
Filtered, secreted, and excreted in urine
Filtered, reabsorbed, and excreted in urine
Filtered, reabsorbed, and catabolized
Extrarenal elimination
Yes; increases at reduced GFR
Yes; increases at reduced GFR
Preliminary evidence of increases at reduced GFR
Use In Estimating Equations for GFR
Demographic and clinical variables as surrogates for physiologic determinants
Age, gender, and race; related to muscle mass
Not applicable
Age, gender
Accuracy
Accurate for GFR <60 ml/min/1.73 m2
Not applicable
Unknown
Assay
Method
Colorimetric or enzymatic
Direct measurement, enzymatic colorimetric and electrochemical
PENIA, PETIA, or ELISA
Assay precision
Very good except at low range
Precise throughout range
Precise throughout range
Clinical laboratory practice
Multiple assays; widely used nonstandard calibration
Multiple assays; enzymatic and colorimetric more common
Not on most autoanalyzers; not standardized
Standardized recommendation materials (SRMs)
SRM 967
SRM 912a
ERM-DA471/IFCC
Reference assay
IDMS
IDMS
PENIA, PETIA, or ELISA
Estimated Glomerular Filtration Rate from Plasma Levels
Creatinine
Metabolism and Excretion
Factors Affecting Serum Creatinine Concentration
Factors
Effect on Creatinine
Mechanism/Comment
Age
Decrease
Reduced creatinine generation caused by age-related decline in muscle mass
Female gender
Decrease
Reduced creatinine generation caused by reduced muscle mass
Race
African American
Increase
Higher creatinine generation caused by higher average muscle mass in African Americans; not known how muscle mass in other races compares with that of African Americans or Caucasians
Diet
Vegetarian
Decrease
Decrease in creatinine generation
Ingestion of cooked meats and creatinine supplements
Increase
Transient increase in creatinine generation, although this may be blunted by transient increase in GFR
Body Habitus
Muscular
Increase
Increased muscle generation caused by increased muscle mass and/or increased protein intake
Malnutrition, muscle wasting, amputation
Decrease
Reduced creatinine generation caused by reduced muscle mass and/or reduced protein intake
Obesity
No change
Excess mass is fat, not muscle mass, and does not contribute to increased creatinine generation.
Medications
Trimethoprim, cimetidine, fibric acid derivatives other than gemfibrozil
Increase
Reduced tubular secretion of creatinine
Keto acids, some cephalosporins
Increase
Interference with alkaline picrate assay for creatinine
Creatinine Assay
Estimated Glomerular Filtration Rate from Serum Creatinine
Cockcroft-Gault Formula
Cockroft-Gault Formula6
Male
or
Related posts:
![]()
Stay updated, free articles. Join our Telegram channel

Full access? Get Clinical Tree

 Get Clinical Tree app for offline access

Assessment of Renal Function
Chapter 3


