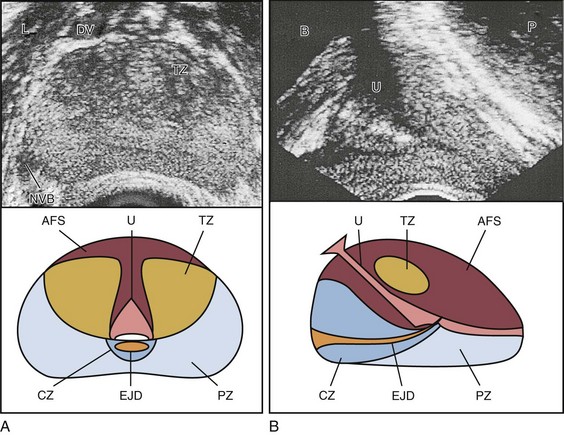
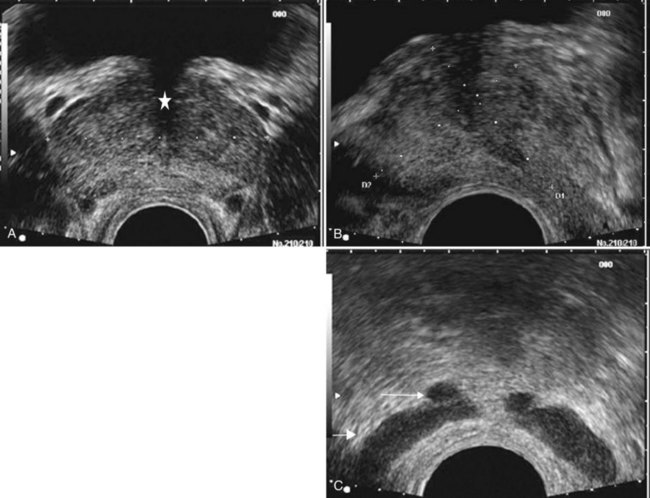
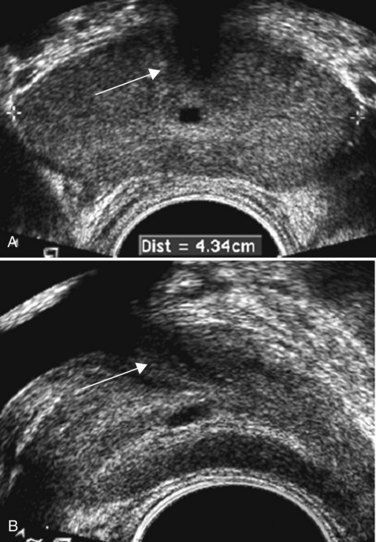
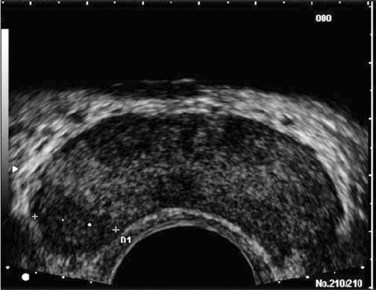
Edouard J. Trabulsi, MD, FACS, Ethan J. Halpern, MD, MSCE, Leonard G. Gomella, MD, FACS Deaths due to prostate cancer in the United States were estimated to be almost 29,000 in 2008, representing a 25% decrease in the mortality rate compared with a decade ago (Jemal et al, 2008). Although the reasons for this improvement are often debated, early prostate cancer detection programs have likely played a role. Early detection has benefited greatly from prostate-specific antigen (PSA) screening efforts, the introduction and refinement of systematic transrectal ultrasonography (TRUS)–guided prostate biopsy techniques, and increased public awareness about prostate cancer. TRUS of the prostate, first described by Watanabe and colleagues (1968), expanded to routine clinical use with improvements in ultrasound technology and the introduction of the TRUS-guided systematic sextant biopsy protocol by Hodge and associates (Hodge et al, 1989a, 1989b). Concurrent with improved biopsy techniques, the use of PSA screening increased the number of men undergoing early prostate cancer screening and prostate biopsy, with estimates as high as 800,000 biopsies annually in the United States alone (Halpern and Strup, 2000). Given the prevalence of prostate cancer and the frequency with which TRUS-guided prostate biopsies are performed, significant efforts have been focused on determining the appropriate indications for biopsy and the ideal technique by which to image and biopsy the prostate. TRUS technology has become a mainstay of many image-guided prostate interventions, including prostate biopsy, brachytherapy, cryotherapy, and high-intensity focused ultrasonography (HIFU), as well as being used in the evaluation of appropriate patients for treatment of benign prostatic hyperplasia (BPH) (Beerlage, 2003). Fiducial gold seeds are being placed under ultrasound guidance to verify and correct the position of the prostate during megavoltage irradiation (Linden et al, 2009). In this chapter our focus is primarily on the use of TRUS and biopsy techniques for the diagnosis of prostate cancer. The prostate lies between the bladder neck and the urogenital diaphragm, just anterior to the rectum, an ideal position to be imaged by TRUS. The prostate gland is traditionally described based on a pathologic zonal architecture. These divisions consist of the anterior fibromuscular stroma (AFS) that is devoid of glandular tissue, transition zone (TZ), central zone (CZ), periurethral zone, and peripheral zone (PZ). Unfortunately, these regions are not visible sonographically as distinct entities (Fig. 97–1). However, the TZ may often be discernible from the PZ and CZ, particularly in glands with significant BPH. Located posteriorly, the normal CZ and PZ, from which a majority of adenocarcinomas arise, have a homogeneous echogenic appearance, whereas the anteriorly situated TZ is more heterogeneous. Frequently, calcifications along the surgical capsule known as “corpora amylacea” highlight the plane between the PZ and TZ (Halpern, 2002). Small, multiple diffuse calcifications are a normal, often incidental ultrasonographic finding in the prostate and represent a result of age rather than a pathologic entity. Larger prostatic calculi associated with symptoms may be related to underlying inflammation and require further evaluation and, possibly, treatment (Geramoutsos et al, 2004). The prostatic urethra traverses the length of the gland in the midline and thus must be imaged in the sagittal plane to be simultaneously viewed along its entire course (Fig. 97–2A and B). The distended urethral lumen has a hypoechoic appearance, whereas periurethral calcifications may produce a thin echogenic outline. The smooth muscle of the internal sphincter extends from the bladder neck, encircling the urethra to the level of the verumontanum. These muscle fibers may be visualized sonographically as a hypoechoic ring around the upper prostatic urethra, giving it a funneled appearance proximally as it arises from the bladder neck. On reaching the verumontanum the urethra angles anteriorly and runs through the remainder of the gland to exit at the apex of the prostate. This angle gives the prostatic urethra an anteriorly concave appearance when viewed along its entire course in the sagittal plane. The paired seminal vesicles (SVs) are positioned posteriorly at the base of the prostate (Fig. 97–2C). They have a smooth, saccular appearance and should be symmetrical. The normal SV measures 4.5 to 5.5 cm in length and 2 cm in width. A cystic SV mass is presumptively benign, whereas a solid lesion has a small probability of being malignant, especially if the patient has a primary neoplasm elsewhere. Schistosomiasis should be considered when making a differential diagnosis in patients who live in areas where infestation is endemic with a solid SV mass (Al-Saeed et al, 2003). In the transverse plane, the vasa deferentia course just above their ipsilateral SV before diving caudally toward the prostate near the midline. Here they lie just medial to the tapering ipsilateral SV before the two structures fuse to form an ejaculatory duct. The ejaculatory ducts (occasionally seen as a hypoechoic structure) enter the gland posteriorly and empty into the urethra at the verumontanum (see Fig. 97–2C). Their course parallels that of the prostatic urethra distal to the verumontanum. Gray-scale TRUS has become the most common imaging modality for the prostate. Most commonly used for prostate cancer detection, TRUS may also be used in the evaluation of other conditions such as infertility (see Chapter 21). Although the role of TRUS is expanding in directing the biopsy of prostate cancer, the role of staging localized prostate cancer using TRUS is very limited (Onur et al, 2004). Commercially available endorectal probes are available in both side- and end-fire models and transmit frequencies of 6 to 10 MHz. Most modern ultrasound machines have optimized self-programming for TRUS and biopsy. Some newer biplane probes provide simultaneous sagittal and transverse imaging modes. Probes provide a scanning angle approaching 180 degrees to allow simultaneous visualization of the entire gland in both the transverse and sagittal planes. Increasing frequency yields increased resolution. As the frequency of the probe is increased, the portion of the image that is in focus (focal range) is closer to the transducer (Kossoff, 2000). The commonly used 7-MHz transducer produces a high-resolution image with a focal range from 1 to 4 cm from the transducer (best for PZ where most cancers arise). Lower-frequency transducers (e.g., older 4-MHz transducers) have a focal range from 2 to 8 cm but at lower resolution. Lower-frequency transducers improve anterior delineation of large glands, increasing the accuracy of volume measurements, but provide poor internal architecture visualization. Acoustic properties of soft tissue are similar to those of water, but clinically useful ultrasound energy does not propagate through air. For this reason, a water-density substance, termed a coupling medium, is used. The coupling medium, usually sonographic jelly or lubricant, is placed between the probe and the rectal surface. If the probe is covered with a protective condom, the coupling medium is placed between the probe and the condom, as well as between the condom and the rectal surface. Patients are typically scanned in the left lateral decubitus position (see Patient Positioning later). TRUS should be performed in both the transverse and the sagittal planes. There are two approaches to probe manipulation for transverse imaging (see Fig. 97–2A). With radial and some biplane probes, advancing the probe cephalad into the rectum images the prostate base, the SVs, and the bladder neck. Pulling the probe caudally toward the anal sphincter images the prostatic apex and proximal urethra. Transverse imaging with end-fire, side-fire, and some biplane probes is accomplished by angling the handle of the probe right or left using the anal sphincter as a fulcrum (see Fig. 97–2B). Angling the probe toward the scrotum produces more cephalad images, and angling the probe toward the sacrum produces more caudal images. There are also two approaches to probe manipulation for sagittal imaging. One method is rotation of the probe. Clockwise rotation yields images of the left side of the prostate, and counterclockwise rotation yields images of the right side. Alternatively, sagittal imaging can be accomplished by angling the probe up or down using the anal sphincter as a fulcrum. In the left lateral decubitus position, angling the handle of the probe down (toward the floor) images the right side of the prostate, and angling the handle of the probe up (toward the ceiling) images the left side. Urologists often prefer angling the probe because this method is similar to manipulation of a cystoscope and is less uncomfortable for the patient. Prostate volume can be calculated through a variety of formulas. Volume calculation requires measurement of up to three prostate dimensions. In the axial plane, the transverse and anteroposterior (AP) dimensions are measured at the point of widest transverse diameter (see Fig. 97–2A and B). The longitudinal dimension is measured in the sagittal plane just off the midline, because the bladder neck may obscure the cephalad extent of the gland (see Fig. 97–2B). Most formulas assume that the gland conforms to an ideal geometric shape: either an ellipse (π/6 × transverse diameter × AP diameter × longitudinal diameter), sphere (π/6 × transverse diameter3), or a prolate (egg-shaped) spheroid (π/6 × transverse diameter2 × AP diameter). Despite the inherent inaccuracies that arise from these geometric assumptions, all formulas reliably estimate gland volume and weight, with correlation coefficients greater than 0.90 with radical prostatectomy specimen weights, because 1 cm3 equals approximately 1 g of prostate tissue (Terris and Stamey, 1991). The mature average prostate is between 20 and 25 g and remains relatively constant until about age 50, when the gland enlarges in many men (Griffiths, 1996). Once gland volume has been obtained, one can calculate derivatives such as the PSA density (PSAD = serum PSA/gland volume). An elevated PSAD of the entire gland has been shown to have a sensitivity and specificity of 75% and 44%, respectively, for predicting a positive cancer diagnosis on repeat biopsy (Djavan et al, 2000). Unfortunately, there is high interoperator and intraoperator variability in PSAD determinations, and similar predictive information can now be obtained using serum free:total PSA (Djavan et al, 2003). Congenital prostatic cystic lesions may arise from either müllerian (müllerian duct cysts and prostatic utricles) or wolffian (ejaculatory duct and seminal vesicle cysts) structures. An enlarged prostatic utricle represents a diverticular projection from the posterior urethra at the level of the verumontanum (Cochlin, 2002) and appears as a midline anechoic structure. These are associated with genital anomalies, including hypospadias (most common), ambiguous genitalia, undescended testes, and congenital urethral polyps (Gregg and Sty, 1989). Müllerian duct cysts also appear as midline anechoic lesions that result from failure of the müllerian ducts to fuse with the urethra. They are generally ovoid to pear shaped with the cyst neck oriented toward the verumontanum. When müllerian duct cysts are present, men should be evaluated for unilateral renal agenesis (McDermott et al, 1993). Lateral paraprostatic cystic structures include seminal vesicle and vas deferens cysts (wolffian in origin). Ejaculatory duct cysts are typically small, lie off of the midline, and may accompany ejaculatory duct obstruction/obliteration with azoospermia (Fig. 97–3A and B). Seminal vesicle cysts can be caused by congenital or acquired obstruction of the ejaculatory duct and are associated with cystic renal disease; up to two thirds of men with seminal vesicle cysts may also have renal agenesis (King et al, 1991). Acquired cysts of the TZ result from hemorrhagic degeneration of BPH nodules (Hamper et al, 1990), whereas those of the outer gland have no proven etiology. All hypoechoic lesions within the PZ should be noted and included in the biopsy material (Fig. 97–4). The lack of a distinct hypoechoic focus does not preclude proceeding with biopsy, because 39% of all cancers are isoechoic and up to 1% of tumors may be hyperechoic on conventional gray-scale TRUS (Shinohara et al, 1989). Despite the higher prevalence of cancers discovered in prostates with hypoechoic areas, the hypoechoic lesion itself was not associated with increased cancer prevalence compared with biopsy cores from isoechoic areas in a contemporary series of almost 4000 patients (Onur et al, 2004). Furthermore, other disease processes, such as granulomatous prostatitis (Terris et al, 1997a), prostatic infarct (Purohit et al, 2003), and lymphoma (Varghese and Grossfeld, 2000), may all produce hypoechoic lesions. TZ BPH nodules are typically hypoechoic but may contain isoechoic or even hyperechoic foci. A hypoechoic lesion is malignant in 17% to 57% of cases (Frauscher et al, 2002), highlighting the need to biopsy these lesions but recognizing they are not pathognomonic for cancer as once thought. External-beam radiation therapy typically decreases volume by 6 months after treatment. Irradiated prostates are diffusely hypoechoic, with poorly defined anatomy. Large hypoechoic tumors, particularly those not responding to therapy, show little change in echogenicity once irradiated, but smaller foci responding well to therapy tend to become isoechoic (Egawa et al, 1991). In general, TRUS findings correlate poorly with pathologic findings and outcomes in irradiated prostates. With interstitial brachytherapy, there is initial postimplantation edema followed by long-term changes as with external-beam radiation therapy (Whittington et al, 1999). With an ideal permanent implant, seeds should be distributed evenly throughout the gland. These seeds are hyperechoic and demonstrate posterior shadowing. The prostate volume declines significantly after treatment, with a 37% size reduction at 1 year after treatment and over 50% reduction 8 years after implantation (Stone and Stock, 2007). This decline is unaffected by neoadjuvant hormonal therapy. Androgen ablation with luteinizing hormone–releasing hormone (LHRH) analogs will cause an average 30% volume decrease with androgen deprivation in prostates with and without cancer (Whittington et al, 1999). The decrease ranges up to 60% in large glands and as little as 10% in small glands. Volume decreases by approximately 21% at 6 months using agents such as finasteride (Marks et al, 1997). Postradical prostatectomy TRUS is considered normal if there is smooth tapering of the bladder neck to the urethra (Kapoor et al, 1993). Many patients demonstrate a nodule of tissue anterior to the anastomosis, representing the ligated dorsal vein complex (Goldenberg et al, 1992). Any other hyperechoic or hypoechoic lesions or interruptions of the retroanastomotic fat plane are considered suspicious (Kapoor et al, 1993). Hypoechoic lesions have been reported in 75% to 95% of patients with locally recurrent cancer, and color Doppler has been used to improve cancer detection in the prostatic fossa (Sudakoff et al, 1996; Tamsel et al, 2006). Patients with detectable PSA who are candidates for salvage radiation therapy were once considered for routine biopsy of the anastomotic area. Biopsy of the anastomotic region with PSA recurrence in the absence of a palpable nodule is not usually informative (Scattoni et al, 2004). However, biopsy of an abnormality seen on TRUS, even with a normal digital rectal exam (DRE), can be diagnostic of locally recurrent disease (Naya et al, 2005). Prostatic involvement with transitional cell carcinoma (TCC) from the bladder is generally not detectable by TRUS, but 71% of prostatic stromal TCC lesions are hypoechoic. Prostatic TCC detected by TRUS must be confirmed by biopsy, because granulomas resulting from instillation of bacille Calmette-Guérin are common in TCC patients and are also hypoechoic (Terris et al, 1997a). Extension to the prostate from the bladder, or urethral squamous cell carcinoma (SCC), is much more common than is primary prostatic SCC. Prostatic SCC appears as an irregular, anterior mass demonstrating relative hyperechogenicity (Terris, 1999). Adenoid cystic/basal cell carcinoma of the prostate is rare but potentially fatal. Histologically, cribriform or adenoid cystic patterns predominate. Numerous cystic glands give this tumor an unusual appearance on TRUS, characterized by multiple, evenly distributed, small, anechoic cysts (Iczkowski et al, 2003). Prostatic sarcoma is a rare complication of prostatic irradiation, and the TRUS appearance is typified by an irregular, hypoechoic mass with an anechoic area consistent with necrosis (Terris, 1998). Unlike radiation-induced sarcoma, the echogenicity of rhabdomyosarcoma is similar to that of normal prostate tissue. Hematologic and lymphoid malignancies involving the prostate are generally not visualized with TRUS (Terris and Freiha, 1998). Biopsies may demonstrate a lymphocytic infiltrate, but this is often attributed to chronic inflammation if no suspicion of nonprostate malignancy exists. Key Points: Gray-Scale Transrectal Ultrasonography (TRUS) Early prostate cancer detection has been markedly improved by PSA-based screening programs. These initiatives have been shown to significantly increase the rate of organ-confined and potentially curable disease (Catalona et al, 1993). Currently, most clinicians recommend biopsy once a patient’s serum PSA rises above 4.0 ng/mL, although significant research efforts are ongoing to identify the optimal PSA threshold to recommend prostate biopsy in the asymptomatic patient. Evidence for lowering the PSA threshold from work by Catalona’s group showed higher rates of organ-confined disease at the time of radical retropubic prostatectomy in samples from PSAs in the 2.6- to 4.0-ng/mL range (Krumholtz et al, 2002). These findings have led many urologists to now recommend prostate biopsy to men younger than 60 years of age once their PSA level rises above 2.5 ng/mL. Despite this downward shift in the PSA cutoff for younger men, there remains a general trend toward allowing older men (70 years or older) to have slightly higher “normal” PSAs, in the range of 5.5 to 6.5 ng/mL, although this is not universally accepted (American Urological Association, 2000; Scardino, 2005). Subsequent data from the Prostate Cancer Prevention Trial have shown that there is no safe PSA threshold that can rule out prostate cancer in any age range (Thompson et al, 2005). When examining men whose serum PSA was less than or equal to 4.0, significant numbers of men were diagnosed with prostate cancer at all PSA levels, with an overall prostate cancer detection rate of 15% for all men with a value less than 4.0, and nearly 15% having a Gleason score of 7 or greater (Thompson et al, 2004). Adjuncts to serum PSA testing have been advocated to improve the performance characteristics of PSA for prostate cancer detection, including measuring the free:total PSA, PSA velocity, PSA density (PSAD), and PSAD of the transition zone (PSAD-TZ) (Djavan et al, 2002). For patients with a serum PSA value between 4.0 and 10.0 ng/mL, using a percentage of free PSA threshold of less than 25% allowed detection of 95% of cancers while eliminating 20% unnecessary biopsies, and within this group the risk of prostate cancer increased dramatically as the percentage of free PSA level declined (Catalona et al, 1998). Regardless of initial PSA value, a PSA velocity greater than 0.75 ng/mL/year is frequently associated with prostate cancer and warrants biopsy (Carter et al, 1992). Lower PSA velocity ranges, as low as 0.35 ng/mL/year, may be indicative of occult prostate cancer (Carter et al, 2006). The clinical utility of PSA velocity to detect clinically significant prostate cancer remains controversial, however, with a recent European Organization for Research and Treatment of Cancer (EORTC) study indicating the PSA velocity, on multivariable analysis, was not an independent predictor of detecting prostate cancer or clinically significant prostate cancer on transrectal biopsy (Wolters et al, 2009). An elevated PSAD and PSAD-TZ have both been shown to increase the likelihood of diagnosing prostate cancer on repeat biopsy (Djavan et al, 2000). The indications for TRUS and prostate biopsy are rapidly evolving and being continually refined (Table 97–1). Details concerning screening for prostate cancer and the role of prostate biopsy are discussed in Chapter 99. Table 97–1 Commonly Cited Recommendations for Transrectal Ultrasonography (TRUS) and/or Biopsy ASAP, atypical small acinar proliferation; PIN, prostatic intraepithelial neoplasia; PSA, prostate-specific antigen. Data from American Urological Association (AUA, 2000) and National Comprehensive Cancer Network (Scardino, 2005). Prostate biopsy may also be indicated on the basis of the pathologic analysis of previous biopsy specimens. In men who have undergone prostate biopsy and are found to have only high-grade prostatic intraepithelial neoplasia (HGPIN) or atypical small acinar proliferation (ASAP), a follow-up biopsy should be performed. HGPIN represents a premalignant lesion and carries a 23% to 35% risk of diagnosing prostate cancer on subsequent biopsy (Davidson et al, 1995; Kronz et al, 2001). The natural history of ASAP is less well defined than that of HGPIN, but, if ASAP is present in the initial biopsy specimen, the risk of diagnosing prostate cancer on subsequent biopsy is significantly increased (Iczkowski et al, 1998
Ultrasonographic Anatomy of the Prostate
Gray-Scale Transrectal Ultrasonography (TRUS)
Techniques
Probe Manipulation
Volume Calculations
Cystic Lesions of the Prostate
Prostate Cancer Imaging on TRUS
TRUS Appearance after Treatment
TRUS and Other Malignancies
Prostate Biopsy Techniques and Outcomes
Indications for Prostate Biopsy
Related posts:
 Definitive Therapy for Localized Prostate Cancer: An Overview
 Tuberculosis and Other Opportunistic Infections of the Genitourinary System
 Prostate Cancer Tumor Markers
 Core Principles of Perioperative Management in Children
 Neuropathic Dysfunction of the Lower Urinary Tract
 Ectopic Ureter, Ureterocele, and Ureteral Anomalies
![]()
Stay updated, free articles. Join our Telegram channel

Full access? Get Clinical Tree


Ultrasonography and Biopsy of the Prostate
• TRUS technology has become a mainstay of many image-guided prostate interventions, including prostate biopsy, brachytherapy, cryotherapy, and high-intensity focused ultrasonography (HIFU).
