Fig. 1 a, b
a Axial opposed-phase T1-weighted magnetic resonance image (MRI) shows hyperintense mass in the upper pole of the left kidney. India ink artifact (arrows) is present at the interface of renal mass and kidney, which is diagnostic of angiomyolipomas (AML). b The mass loses signal on fat-suppression images, confirming the diagnosis of AML
Occasionally, AMLs can be highly exophytic and difficult to differentiate from perinephric liposarcomas. This is an important distinction given the different treatments and prognoses for these two neoplasms. Imaging features have been identified to facilitate differentiation. Fatty perinephric masses are more likely to be exophytic AMLs if they contain large vessels that extend to the renal cortex or if they are associated with a renal parenchymal defect [12].
Some AMLs do not contain easily identifiable macroscopic fat. Many studies attempted to identify small foci of fat in these minimal fat-containing AMLs (mfAMLs) in the hope that this might permit these lesions to be correctly distinguished from other solid renal neoplasms. The utility of unenhanced CT attenuation, CT histograms, and quantitatively assessed fat on MRI have been assessed in permitting such distinctions to be made [13–15]. However, results are mixed. In some studies, mfAMLs contained more measureable fat than RCC, whereas this was not the case in others.
Additional CT and MRI features independent of fat detection have also been evaluated. On CT, mfAMLs generally have higher unenhanced attenuation than normal renal parenchyma. However, papillary RCC can also demonstrate this feature, although usually not to as great an extent [16]. Unlike many papillary cancers, mfAMLs frequently demonstrate identifiable intratumoral vessels and pronounced enhancement after contrast material administration [16]. On MRI, a diagnosis of mfAML should be considered (albeit not definitively) if a solid mass demonstrates low signal intensity on T2-weighted sequences. Whereas these MRI characteristics are not seen in the majority of RCCs, they can also be encountered in papillary RCCs. As with CT, mfAMLs also usually demonstrate more contrast enhancement on MRI than do papillary renal neoplasms.
Differentiating Other Solid Renal Masses
Differences in Tumor Morphology
Nearly all malignant and many benign solid renal masses typically do not contain macroscopic fat. The malignancies include all RCC types, including clear cell (most common), papillary, chromophobe, collecting duct, and medullary cancers, and the more recently described XP11.2 translocation RCC. Upper-tract urothelial cancers and primitive neuroectodermal neoplasms also can present as solid renal masses.
Benign solid renal masses that contain little or no fat include the aforementioned mfAMLs, oncocytomas, papillary adenomas, and renomedullary interstitial cell tumors, and more rarely, metanephric neoplasms, hemangiomas and lymphangiomas, leiomyomas, juxtaglomerular tumors, and mixed epithelial and stromal tumors.
Many papers have attempted to distinguish among various non- or minimal-fat- containing solid renal masses on CT and MRI. A few characteristic imaging features for the different neoplasms are summarized here.
Oncocytoma
Oncocytomas may contain central scars that can be detected on imaging studies; however, this feature is not diagnostic. Necrosis in RCC and scars in oncocytomas are usually indistinguishable from one another. Further, most oncocytomas evaluated on CT do not contain identifiable central scars [17]. Following contrast material administration, on CMP images, most oncocytomas demonstrate less mean enhancement than do clear cell RCC; however, there is overlap [18]. In contrast to clear cell RCC, peak oncocytoma enhancement usually does not occur until the NP [19]. In one study of small renal masses (<4 cm), only oncocytomas demonstrated >50% washout on delayed-phase images [20].
Another imaging feature to differentiate oncocytoma from RCC is segmental enhancement inversion (SEI), in which two differently enhancing components identified on CMP images reverse their attenuation on EP images, with the initially higher attenuation briskly enhancing component becoming lower in attenuation than the initially lower attenuation less intensely enhancing component. In one study, SEI was seen in 17 of 33 small (<4 cm) oncocytomas [21]. Detecting this feature has not been consistent, however. In another publication, this finding was noted in only one of 16 small oncocytomas [22].
Clear Cell RCC
Clear cell cancers often present as heterogeneous, solid renal cortical masses, with low-attenuation cystic and brisky enhancing components (compared with other RCC cell types). On CT and MRI, clear cell carcinomas usually demonstrate considerably greater and peak enhancement on CMP images than papillary or chromophobe RCCs [18, 19, 23]. Clear cell carcinomas also commonly enhance more heterogeneously (Fig. 2).
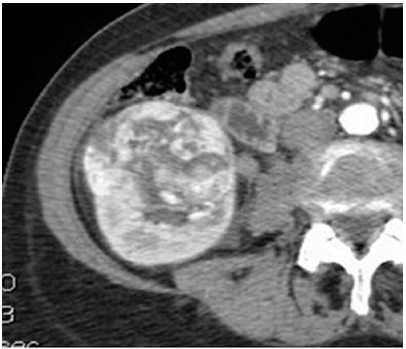
Fig. 2
Clear cell renal cell carcinoma (RCC). Contrast-enhanced computed tomography (CT) image during the corticomedullary phase (CMP) demonstrates a heterogeneously and briskly enhancing right renal mass, consistent with a clear cell RCC
Papillary RCC
On contrast-enhanced CT or MRI, the most common two papillary subtypes, the better-prognosis type 1 tumors and the more aggressive type II tumors both tend to demonstrate better well-defined margins, greater homogeneity, and lesser and greater delayed enhancement than other RCC cell types (Fig. 3) [24, 25]. Papillary cancers do not demonstrate peak enhancement until NP and/or EP. On MRI, many papillary cancers demonstrate characteristic T2-signal hypointensity [26]. In comparison, only a small minority of clear cell RCC are T2 hypointense [26].
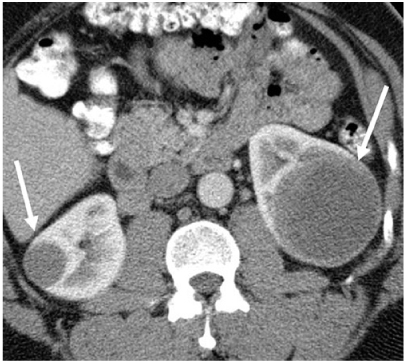
Fig. 3
Papillary renal cell carcinoma (RCC). Contrast-enhanced computed tomography (CT) image demonstrates bilateral renal masses (arrows) that are hypoenhancing and homogeneous, consistent with papillary RCC
Uncommon RCC Types
In comparison with other types of RCC, medullary, collecting duct, and XP11.2 translocation cancers generally arise in the medulla. Whereas collecting-duct cancers frequently occur in older adults, renal medullary and XP11.2 cancers are usually encountered in young patients, with XP11.2 RCC accounting for about one third of pediatric RCC [27]. Medullary RCC typically develops in patients with sickle cell trait [28].
Urothelial Neoplasms
It can occasionally be difficult to distinguish centrally located RCC from urothelial cancers; however, several features can be used to suggest that a centrally located renal mass is a urothelial rather than a RCC, including an epicenter in the renal collecting system, a renal pelvic-filling defect, preservation of normal renal contour, lack of cystic/necrotic areas, homogeneous enhancement with contrast material, and extension toward the ureteropelvic junction [29].
Other Types
Other abnormalities that can produce centrally located renal masses include renal lymphoma and renal artery aneurysms.
Solid Renal Mass Growth Rates
One cannot rely on differences in growth rates to distinguish among different RCC cell types. In one series, for example, neither the initial size of a detected RCC nor its cell type predicted the likelihood that the cancer would be more or less likely to grow quickly.
As with complex cystic renal masses, benign and malignant solid renal masses can remain stable in size or enlarge, with growth rates of both types of lesions usually being slow and similar [30]. It is suggested that growth of a renal mass can only be considered suggestive of malignancy when such growth is unusually rapid (>5 mm within 12 months) [31].
Current Status of Imaging for Solid Renal Mass Differentiation
Due to overlap of many of the above-described imaging findings, we believe that, at the present time, imaging differentiation of malignant from benign non-fatcontaining solid renal masses (or of various types of malignant solid renal masses) is not possible in any given case. This once was not felt to be an important problem, as it was believed that the vast majority of solid renal masses were RCC. It has become apparent that a sizeable minority of small solid renal masses are benign: about 20% of solid renal masses <4 cm in diameter are benign [32], with the frequency of benign tumors being even greater for smaller lesions [32].
Given the substantial overlap in imaging features of benign and malignant lesions, an increasing number of institutions perform biopsies of many, or even all, detected solid renal masses. Although there was some hesitation about performing biopsies of masses that could represent RCC due to concerns about diagnostic errors, tract seeding, or bleeding, it is now widely accepted that percutaneous biopsy of a solid renal mass can be performed accurately and safely in the vast majority of patients [33]. In particular, percutaneous biopsy differentiation of oncocytomas is now considered reliable in most patients, with only a few biopsies of oncocytic tumors being indeterminate [34, 35]. Even if biopsy is generally accurate in determining whether a renal mass is benign or malignant and in assessing RCC cell type, debate about whether a percutaneous biopsy might occasionally underestimate the grade of an RCC by failing to sample the portion that contains the most aggressive cells. It is not yet clear whether undergrading will be a clinically significant problem.
Pretreatment Assessment of RCC
CT and MRI (preferably obtained during the portal venous phase) are highly accurate in staging and localizing RCC, with specific TNM staging provided in Table 1.
Table 1
Tumor/note/metastasis (TNM) staging of renal cell carcinoma
Stage | Feature |
|---|---|
Tumor | |
T1a | ⩽4 cm in greatest dimension and limited to the kidney |
T1b | >4–7 cm in greatest dimension and limited to the kidney |
T2a | 7–10 cm in greatest dimension and limited to the kidney |
T2b | >10 cm in greatest dimension and limited to the kidney |
T3a | Gross extension into the renal vein or its segmental branches or invading perirenal or renal sinus fat |
T3b | Gross extension into the inferior vena cava (IVC) below the diaphragm |
T3c | Gross extension into the IVC above the diaphragm or invading the IVC wall |
T4 | Invasion beyond the perinephric fascia or into the ipsilateral adrenal gland |
Node | |
N0 | No lymph node metastases |
N1 | Regional lymph node metastases |
Metastasis | |
M0 | No distant metastases |
M1 | Distant metastasis |
Many urologists now recommend that renal nephrometry scoring be performed in addition to staging prior to surgery, as nephrometry can contribute to decisions concerning whether partial nephrectomy can be performed safely and may also predict the likelihood of posttreatment complications, with masses receiving higher scores being more problematic [37]. A recommended nephrometry scoring system is listed in Table 2.
Table 2
Recommended nephrometry scoring system


