HISTORICAL PERSPECTIVE
Hemodialysis was first successfully applied during the 1940s to support life in patients with acute kidney injury (1). Soon after, it was clear that life could be prolonged where previously death from uremia was certain. This seemingly miraculous therapy, touted by some as the most effective medical therapy introduced during the last century, was first deliberately used to manage end-stage chronic kidney disease (CKD5) in 1960 (2). It soon became clear that periodic dialysis treatments could sustain life indefinitely, but for the early pioneering patients, the frequency and intensity of treatments were limited by equipment availability and by adverse reactions. In addition, during these early development years, limited membrane permeability and patient intolerance of high blood flows necessitated prolonged treatments often for 8 to 10 hours. As maintenance dialysis was applied to larger numbers of patients, three treatments per week appeared to restore health, whereas two treatments per week regardless of treatment duration were inadequate in anephric patients.
Important developments in the next few decades led to further changes in long-term hemodialysis administration. In the late 1970s, the National Cooperative Dialysis Study (NCDS), sponsored by the National Institutes of Health (NIH), showed that a minimum small solute clearance per dialysis was required for thrice-weekly dialysis (3–5). This heralded a shift in emphasis of hemodialysis adequacy determination from blood solute levels to solute clearance (6). Tolerance of hemodialysis improved as more permeable and biocompatible synthetic membranes became available, as bicarbonate was substituted for acetate in the dialysate, as fluid removal was stabilized by using balance chambers and redundant conductivity monitors, and as severe anemia was reversed by treatment with recombinant erythropoietin (7–9). Notably, improvements in membrane biocompatibility and solute flux allowed shorter dialysis treatments to become feasible, a goal sought by many, especially the patients (10,11). The next major NIH-funded study of hemodialysis patients, the Hemodialysis (HEMO) study, showed that the previously accepted minimum dose standard is also the optimum dose for patients dialyzed three times weekly (12). One can conclude from this study that a minimum dose, based on small solute kinetics, is still required, but increasing the dose further would not provide any significant benefit to the patient whose life is already compromised by the demands of hemodialysis. More recently, the Frequent Hemodialysis Network trial examined the benefits of more frequent in-center hemodialysis as well as nocturnal hemodialysis compared to conventional thrice-weekly treatments (13,14). Analysis of data from those studies has given us improved methods to estimate small solute clearance at higher dialysis frequencies.
Today, the lives of more than 2 million patients across the globe are supported by long-term hemodialysis (15), which is a tribute to technique refinements that have improved patient tolerance of the treatments. In the United States, where the incident and prevalence rates remain high, concerns have been raised by clinical providers as well as governmental regulatory agencies about the unacceptably high mortality rate of hemodialysis patients compared to the general population and to hemodialysis patients in other countries where hemodialysis is also the predominant form of renal replacement therapy (16,17). Under such scrutiny, the dose and adequacy of dialysis continue to be a focus and benchmark of dialysis excellence (18–21). As a result, the practice of quantifying dialysis by measuring solute clearance has long since moved from the realm of scientific curiosity to acceptance by the dialysis community and a mandated requirement by dialysis sponsors. At present, a variety of options for long-term hemodialysis exists, including frequent home hemodialysis, short frequent in-center dialysis, and long nocturnal dialysis. With such an array of modalities, measuring the “dose” of dialysis is more important than ever to ensure optimal patient care.
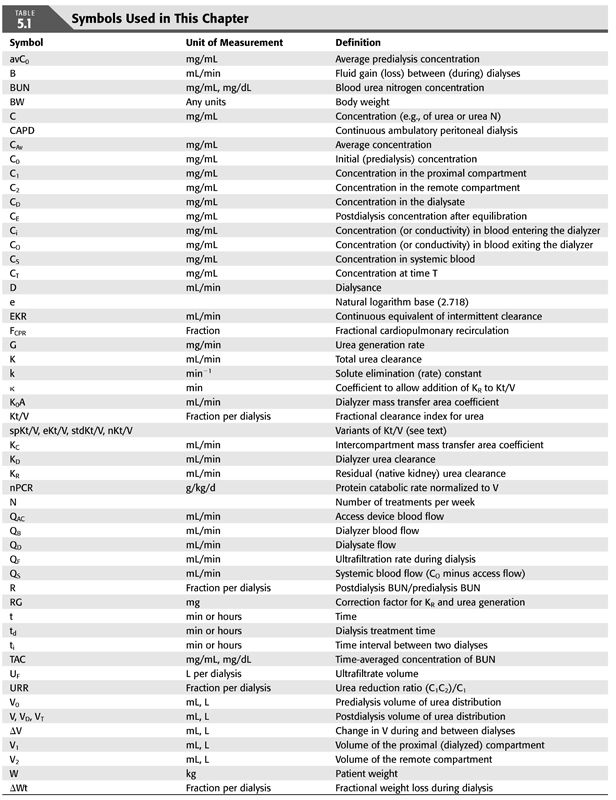
This chapter reviews what is known about mathematical models of solute kinetics currently used to measure hemodialysis, including how to implement them and how to interpret the patient-specific parameters generated by the models. Definitions of the symbols used throughout this chapter and their common units of measurement are displayed in TABLE 5.1.
 UREA, A MARKER FOR CLEARANCE AND PROTEIN CATABOLISM
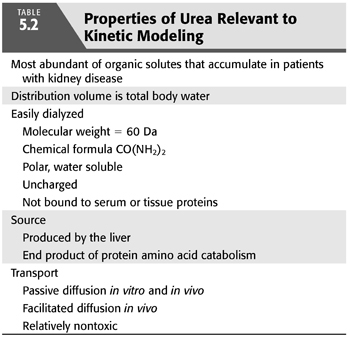
The properties that qualify urea as an indicator of dialysis efficiency and adequacy are listed in TABLE 5.2. Perhaps because of its low toxic potency, urea accumulates in the blood and tissues of patients with kidney disease to levels higher than any other organic solute. Its rate of production, dictated by net protein catabolism, is constant (zero order kinetics), independent of urea levels in the patient. Its ease of diffusion, most likely because of its small size and relative electrical neutrality, promotes swift movement across extracorporeal dialysis membranes. It also moves easily across most in vivo membranes, including erythrocyte membranes, along highly conserved pathways for facilitated transport (22–28). Because of these properties, measurement of urea transport across dialysis membranes is a sensitive index of small solute clearance, a fundamental goal of dialysis.
Urea generation correlates closely with protein catabolism, which, in steady-state, stable patients, reflects protein intake, a measure that can provide assistance with dietary management. A relatively precise relationship between urea generation and protein catabolism was found several years ago in two separate metabolic studies, each in a small number of CKD5 and CKD3 to CKD4 patients (29,30). Both studies showed essentially the same result (EQUATION 5.1):

where nPCR is the net normalized protein catabolic rate (g/kg/d) (29), G is the urea nitrogen generation rate (mg/min), and V is the urea distribution volume (mL). Protein catabolism is expressed per kilogram of lean or normalized body weight. The latter is derived from V, assuming that V is 58% of body weight.
Total protein catabolism exceeds net nPCR, often by several fold (31). Protein breakdown releases free amino acids that are mostly reincorporated into new protein. This anabolic resynthesis of protein is a large fraction of the total catabolic rate, the difference representing a smaller net rate of nitrogen loss from irreversible breakdown of amino acids to urea (32). Therefore, nPCR, determined from urea modeling, is a measure of net protein catabolism. Net protein catabolism is equal to protein intake in patients who are in stable nitrogen balance.
Single blood urea levels are difficult to interpret. In a patient not on dialysis, elevated urea levels may well correspond to the syndrome of kidney disease with all of its manifestations. Paradoxically, dialysis patients with low urea levels as a result of low urea generation rates have poorer outcomes (33). Reduced protein-derived urea generation results from poor nutritional intake that is usually due to suppression of the appetite. Appetite suppression is associated with either inadequate dialysis or with comorbid diseases such as infection or cardiovascular disease, the leading cause of death in dialysis patients (3,4,34–36). Low urea levels achieved by adequate dialysis are beneficial, while low levels due to poor nutrition and decreased protein intake are associated with higher morbidity and mortality. The studies of pregnancy in women on hemodialysis support this notion—pregnancy outcomes are improved in women with lower blood urea levels as achieved by hemodialysis (37–39).
Attempts to demonstrate a direct toxic effect of urea have led to the conclusion that urea is at best a mild toxin (40–42), levels of which serve only to mirror other easily dialyzed solutes that are more toxic and responsible for the uremic syndrome (43). Alternatively, an indirect effect of urea such as carbamylation of protein may mediate its toxicity (44–47). However, posttranslational carbamylation of proteins requires time to develop in the presence of high urea concentrations and, conversely, to reverse after lowering the urea concentration. Therefore, the immediate benefits of dialysis that are observed clinically are difficult to explain on this basis. Evidence that carbamylated albumin levels associate with adverse outcomes in a cohort of diabetic hemodialysis patients suggests that long-term effects of protein modification by urea may warrant further investigation (48).
An inescapable conclusion from these observations, and one that guides the clinical application of urea modeling today, is that urea is a poor marker of uremia but its clearance is a good marker of dialysis. Measurements of urea concentration before and following dialysis, when combined with an appropriate model of urea kinetics, provide vital clinical information about both the adequacy of dialysis and the nutritional status of the patient.
 FACTORS THAT DETERMINE THE REQUIREMENT FOR DIALYSIS
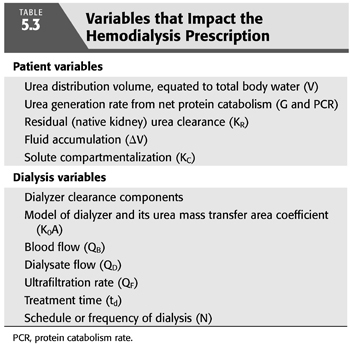
Several of the patient-specific factors listed in TABLE 5.3 determine how much dialysis is needed. These include the patient’s size, residual native kidney urea clearance, fluid gain between dialyses, and perhaps in the rare case of pregnancy (37,38,49,50). If adequate dialysis is provided, moderate increases in urea generation do not affect the need for dialysis but instead reflect improved protein nutrition (see section “Protein Catabolism”). Although solute compartmentalization (see section “Multi-Compartment Kinetic Model”) affects the delivery of dialysis, the effect is predictable as explained in the subsequent text, and relatively constant from patient to patient and from time to time, so periodic adjustments are not necessary.
Protein Catabolism
Adjusting the dose to the urea generation rate has been considered less important in recent years because patients on average receive higher doses of dialysis (19). Higher doses cause mean urea concentrations to fall below the ceiling that was originally suggested by the NCDS, so an additional adjustment for urea generation is less critical and is usually unnecessary. In addition, increasing evidence suggests that nutrition has a strong influence on patient outcome, so the emphasis has shifted from restricting protein to encouraging more protein and caloric intake (51–53). The United States multicentered Modification of Diet in Renal Disease (MDRD) study also raised concerns about protein restriction adversely influencing survival of patients in stages 3 and 4 of CKD (54,55).
Several investigators have reported a correlation between nPCR and the dose of dialysis expressed as Kt/V, suggesting that increasing the dose of dialysis will improve the appetite (56–59). This conclusion is subject to error for several reasons. First, if the dose of dialysis is not strictly controlled by urea modeling, physicians may simply give more dialysis to patients with high protein intake, creating a correlation that reflects a physician response to appetite rather than vice versa. Second, both nPCR and Kt/V are determined from the same set of blood urea nitrogen (BUN) values (see subsequent text); therefore, an artifactual mathematical correlation due to coupling is expected, the magnitude of which depends on the BUN measurement error (60,61). Third, observational studies of the curvilinear relationship between Kt/V and protein catabolism rate (PCR) are confounded by inclusion of very low doses. This causes a false exaggeration of the effect of increasing Kt/V above the range where the relationship reaches a plateau (58,62).
The above errors are important to avoid when interpreting nPCR. However, since appetite suppression is a well-known consequence of uremia and dialysis reverses uremia, we can expect that dialysis will improve the appetite in patients with overt uremia (63). The HEMO study showed no improvement in nutrition after increasing the dose above the current optimal target in patients dialyzed three times weekly (64,65). While some uncontrolled studies have suggested that increasing the frequency of hemodialysis to four to six per week may improve the appetite in some patients (66), the analysis of the Frequent Hemodialysis Network data did not show significant improvements in lean body mass or nutritional parameters in patients receiving six times a week in-center treatment or those on nocturnal dialysis (67).
Residual Native Kidney Clearance
Seemingly insignificant levels of residual native kidney urea clearance (e.g., 1 or 2 mL/min) can markedly decrease the need for dialysis, but most nephrologists do not compensate for residual function (KR) by prescribing a lower dialysis dose. Reasons for omitting this practice include the patient inconvenience and provider cost associated with collecting, measuring, analyzing urine, and calculating KR.Those opposed to the regular evaluation of residual urea clearance have also pointed to the potential negative psychological effect on the patient from stepwise increases in the dialysis treatment time as KR inevitably declines. It should also be noted that at the present time, regulatory agencies ignore the inclusion of KR in total clearance and require submission of delivered Kt/V (or urea reduction ratio) as the only accepted clearance measure when dialysis clinic adequacy is monitored. Therefore, a nephrologist who does incorporate KR in his or her dialysis prescriptions may place the dialysis clinic at risk for financial penalties. However, KR has a strong influence on patient mortality, both for peritoneal dialysis and for hemodialysis (68–70), so KR not only affects the required dialysis dose but it also has prognostic significance. In addition to an equivalent clearance of small solutes, residual renal function has other benefits that include removal of poorly dialyzable toxins (71,72). Since dialysis compromises a patient’s quality of life, and the primary goal of kidney replacement is improving the quality of life, adjusting the dose in patients with significant KR is worth considering. Acknowledging this benefit, the most recent Kidney Disease Outcomes Quality Initiative (KDOQI) 2015 guidelines have reemphasized the recommendation to adjust the dialysis prescription in patients who have substantial residual renal function, assuming KR is periodically updated. Methods for incorporating KR to create an expression of total depurative function are published in the KDOQI guidelines (73) and are briefly described later in the chapter (see section “How to Add KR to Kt/V”).
Body Size
Body size is an obvious modulator of dialysis need, but the precise denominator to use as an index of size is debated (74–76). Numerous isotope studies in animals and normal humans have shown that the urea distribution volume (V) is equivalent to total body water, which is proportionate to lean body mass (77–79). As discussed in the subsequent text, V is a mathematically convenient denominator, but it may not be appropriate, especially because body surface area (SA) has been used for several decades to normalize native creatinine or inulin clearances (80,81). Because outcome patterns in women and smaller patients differ from that of larger patients (82–84), and most metabolic functions vary with SA, not lean body mass, several investigators have attempted to convert V to SA by adjusting for body height using time-tested formulas for SA (85–87).
The concentrations of uremic toxins in body fluids are thought to modulate toxicity and therefore the need for dialysis (88), but for first-order processes, the concentration is a function of generation and removal and does not depend on the space of distribution. For a patient whose clearance (K) is constant, and whose toxin generation rate (G) is equal to the removal rate, changes in the volume of distribution (V) have no effect on concentration in the steady state (C = G/K). For example, an increase in V from edema formation or a decline in V from muscle loss would not affect steady-state concentrations if all else remain constant. It is unlikely that edema fluid is a source of uremic toxins, and analysis of outcomes suggests that muscle is also an unlikely source (89,90). Instead, individual solute generation rates modulate toxin concentrations and are therefore the most logical size variables to which the dose should be normalized. Unfortunately, the critical toxic compounds have not been identified, so the precise relationship between their generation rates and body size remains speculative (43).
Use of V as a normalizing denominator for the dialysis dose has also been questioned because observational studies have shown that V independently predicts and correlates positively with survival (91–94). Patients with lower body mass tend to have both a higher Kt/V and a higher mortality risk. African Americans with CKD5 tend to have a higher body mass and both a lower Kt/V and a lower mortality risk (95,96). These opposing effects of V confound the relationship between the V-normalized dose of dialysis and patient outcomes. Adjustment for the independent beneficial effect of V on survival creates an even steeper relationship between the survival benefit of increased dialysis dose (74). Larger patients likely have higher solute generation rates and require more clearance than smaller patients to achieve the same blood concentration. One possible explanation for the higher risk of mortality in smaller dialysis patients is use of V instead of SA, as noted earlier, which may overcorrect for body size, leading to inappropriately lower doses in smaller patients. Post hoc analysis of the HEMO study data suggested that women, who are generally smaller in body size, may benefit from the higher targeted Kt/V (97), lending some credence to the idea of underdosed dialysis in this subgroup. The higher risk of mortality may also result from the higher prevalence of malnutrition in smaller dialysis patients. While malnutrition alone portends a poor prognosis in the dialysis patient, it can also result from comorbid conditions including inflammatory states that may independently affect survival (98).
TABLE 5.3 also lists fluid accumulation between dialyses as a component of the dialysis prescription. Although it increases the requirement for fluid removal during each treatment, fluid accumulation actually decreases the need for dialysis both because of a dilution effect and because removing fluid during hemodialysis increases the efficiency of solute removal (99). See section “Effect of Fluid Gain” later in the chapter.
Hematocrit
Solutes other than urea do not always distribute in erythrocytes and transport out of the erythrocyte can be delayed as blood traverses the dialyzer within 10 to 30 seconds. As the red cell mass usually makes up 30% to 40% of a patient’s blood volume, distribution and transport of solutes in erythrocytes can have a significant effect on clearance. Red cell urea transporters are very robust, causing near instantaneous equilibration, so the presence of erythrocytes has little effect on urea clearance (22–28). However, creatinine equilibrates slowly and phosphorus apparently does not move at all across erythrocyte membranes during transit through the dialyzer (100,101). This in part explains the difference between in vitro and in vivo clearances, an effect that should be kept in mind when developing and applying kinetic models for solutes other than urea.
 TARGETING THE AMOUNT OF DIALYSIS
How to Measure Dialysis; How Much Is Enough?
The NCDS showed not only that higher urea levels are not tolerated but also that morbidity and mortality are inversely correlated with protein catabolism (4,102). Because the urea level is directly correlated with urea generation from net protein catabolism, factoring one for the other is the essence of a clearance (see subsequent text). A later mechanistic analysis of the data showed that providing a size-adjusted minimum clearance of urea per dialysis (Kt/V) would assure the best outcome (3). The subsequent HEMO trial showed that further increases in this dose parameter were met with no further improvement in morbidity or mortality, so the minimum dose for three dialyses per week also turned out to be the optimum dose (12). Some observational studies have shown that markedly prolonging the treatment time (e.g., doubling or tripling td) on a thrice-weekly schedule may improve survival and intermediary cardiac outcomes (103–105). Analysis of the Dialysis Outcomes and Practice Patterns Study (DOPPS) observational data also suggested that in patients dialyzed three times weekly, incremental increases in treatment time are associated with a lower relative risk of death (106,107). However, no randomized clinical trials have been conducted to test this hypothesis.
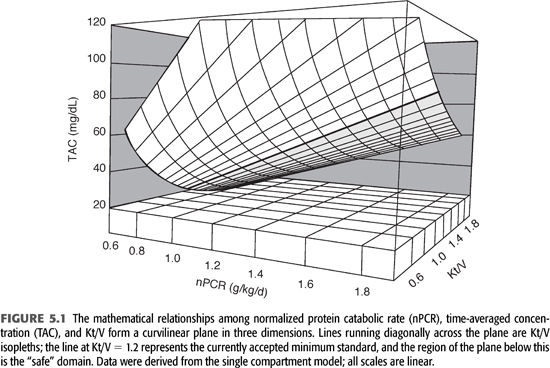
The relationships among time-averaged BUN, Kt/V, and nPCR are shown in FIGURE 5.1. The “safe zone” is shown below the heavy line representing the isopleth for a single pool Kt/V of 1.2 per dialysis. The curvilinear surface represents the mathematical relationship among the three variables time-averaged concentration of BUN (TAC), nPCR, and Kt/V, for patients dialyzed three times weekly. Note that only two of the three variables are required to find a point on the surface plot, which means that the three variables are mathematically interdependent and that arguments favoring one as more accurate than another are trivial. Note also that the depicted Kt/V values are specific for dialysis given three times weekly. For twice-weekly dialysis or another schedule, the Kt/V axis must be changed.
The NCDS showed that to achieve optimal patient outcome, one must guarantee that the dose of dialysis (delivered Kt/V) is constant and relatively independent of the BUN (3,6). These findings reflect the failure of the serum urea concentration as an indicator of both dialysis adequacy and uremia (63). This should not be surprising to nephrologists, who have long held a double-standard interpretation of the BUN in patients who do not yet require dialysis. The BUN has been considered important to measure, but when the patient is symptomatic and the BUN is low, it is ignored (102). Some patients have died a uremic death with a BUN as low as 50 mg/dL. Clearly, dialyzable toxins other than urea account for a major part if not all of the uremic syndrome, so control of the BUN is not enough to guarantee adequate dialysis (40–42,88,108).
A safety net, expressed as Kt/V, guarantees the average patient will receive a minimum amount of dialysis, relatively independent of BUN levels and protein catabolism. However, patients’ need for dialysis may differ, so if the patient is not improving or is failing for unknown reasons, it behooves the nephrologist to increase the dose of dialysis unless he or she is confident that the dose is already well above the level currently considered a safe minimum and that the patient’s symptoms are not related to uremia. This recommendation acknowledges our current inability to define the uremic state more precisely (63), our ignorance of factors that may mediate individual requirements for dialysis, and our concerns about the contribution of protein catabolism to uremia (109–113).
Interpreting Kt/V: Limitations
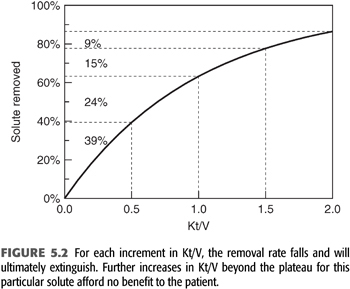
The term Kt/V describes the fractional clearance of urea during a single hemodialysis or the fractional volume cleared. As such, this is a term without units. The fraction can be greater than 1 because blood flow circulates from patient to dialyzer, which allows the body water compartment to be dialyzed more than once during a single treatment. Modeled Kt/V is a measure of the amount or dose of dialysis received by the patient. It correlates with outcome, but the correlation is nonlinear, as demonstrated by the NCDS and other outcome studies (3,4,114). Part of the reason for this nonlinearity is the curvilinear relationship between solute removal and Kt/V as shown in FIGURE 5.2. Because dialysis is a self-limiting process driven by diffusion, the amount of solute removed diminishes exponentially as the amount of dialysis is increased linearly. In other words, doubling Kt/V does not double the amount of solute removed and may accomplish very little if the critical solutes have already fallen to low levels or disequilibrium prevents further solute removal. This self-limiting or self-defeating aspect of intermittent hemodialysis is important to recognize when expressing the dose as Kt/V. Once the dose reaches the minimum standard for adequacy, increasing per dialysis Kt/V further does not necessarily improve outcome (12). Kt/V is not a direct measure of outcome or the effectiveness of the dose but is simply a method of assuring dialysis adequacy in the absence of knowledge about the critical toxins removed. As will be emphasized later, Kt/V should not be viewed as a parameter of the dialysis machine but rather as the patient response to a particular dialysis prescription.
 SINGLE-COMPARTMENT KINETIC MODEL
Clearance, a Better Measure of Dialysis
The clearance concept is intuitive, but its precise definition, origin, and application often escape nephrologists and even physiologists. It is probably best understood as a measure of the elimination process unencumbered by other variables, including the solute concentration. The solute removal rate is itself a measure of elimination, but for both filtration and dialysis, the rate is a linear function of (proportional to) the concentration. Expressing the elimination process as a clearance takes the effects of both the elimination rate and the concentration out of the rate term:
Clearance (removal rate) / concentration
For dialysis, if the index solute is present on both sides of the membrane, diffusion is proportional to the solute gradient, so we define “dialysance”:
Dialysance = (removal rate) / concentration gradient
When the removal rate is a linear function of concentration, the process is called first order, meaning that the removal rate is proportional to the first power of the concentration. In comparison, for zero order processes, the removal rate is constant, independent of the concentration, for example, urea generation by the liver. For both the native kidney, which uses convective clearance, and hemodialysis with diffusion-centered clearance, a generalized equation for a first-order process is (EQUATION 5.2):
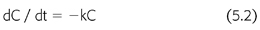
where C is the solute concentration at any time (t) and k is the elimination constant expressed as a fraction per unit of time. Rearranging EQUATION 5.2, and multiplying by the volume of solute distribution (V), clearance is defined as (EQUATION 5.3):
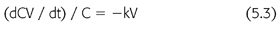
where dCV/dt is the solute removal rate and kV is the clearance. Because the removal rate divided by concentration is a flow, clearance is often described as the flow equivalent to complete removal of the solute. This definition is intuitive, but it bypasses the previous steps in the derivation of the clearance concept. Clearance is a useful expression only for first-order processes like diffusion and convection. We do not calculate the urinary clearance of sodium, for example, a non–first-order process.
Because removal of urea by the dialyzer is a first-order process, the rate of removal can be expressed mathematically using EQUATION 5.2. Integration over a period of time yields a familiar expression that describes the removal of drugs by a single exponential process (EQUATION 5.4) (115):
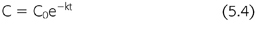
where C0 is the initial urea concentration and e is the base for natural logarithms (2.718). The rate of elimination falls with time because the concentration falls with time; that is, the process eventually extinguishes itself. However, the fractional rate of change in concentration, (dC/C)/dt, is constant (−k) and can be determined simply by measuring two timed concentrations, C0 and C (EQUATION 5.5):

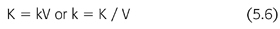
where t is the time interval between measurements of C0 and C and ln is the natural logarithm. When the fractional removal rate (k) is multiplied by the urea volume of distribution (V), the result is a clearance (K) (EQUATION 5.6):
By substituting EQUATION 5.6 into EQUATION 5.5 and rearranging, another familiar expression appears (EQUATION 5.7):

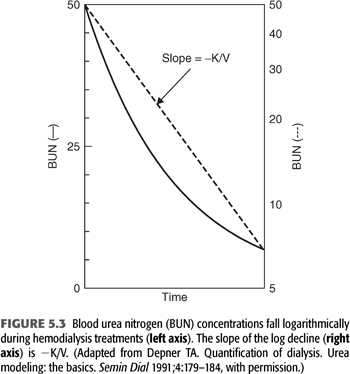
This equation shows that the log ratio of the starting urea concentration (C0) to the ending concentration (C) can be used as an index of the amount of dialysis delivered during a single dialysis treatment, circumventing the necessity for measuring each of the three components of the expression Kt/V. FIGURE 5.3 shows the relationship between time and C expressed as BUN on a linear scale to the left and on a logarithmic scale to the right (116). The slope of the logarithmic line is −k or −K/V. Note that this simplified graphic analysis of urea kinetics gives the ratio of clearance to urea volume (K/V). To resolve K, V must be determined independently and vice versa. Note also that the absolute values for C0 and C are not important; their relative values determine Kt/V. For example, if the BUN falls from 150 to 75 mg/dL or from 50 to 25 mg/dL during dialysis, Kt/V is the same. Because Kt/V is determined from BUN measurements in the patient, it is a patient-specific parameter, not a machine parameter; Kt/V is a measure of response to dialysis rather than a measure of the amount of dialysis prescribed (117).
Urea generation in milligrams per minute is derived from the change in urea concentration between dialyses in milligrams per milliliter multiplied by the urea volume in milliliters and divided by the time interval in minutes. Because the normalized protein catabolic rate is factored for patient volume (EQUATION 5.1), net protein catabolism can be determined from the changes in BUN between dialyses, provided there is no residual renal function or change in volume (EQUATION 5.8) (117,118):

where nPCR is the normalized protein catabolic rate (gram per kilogram body weight per day), C′0 is the second predialysis BUN (mg/mL), CT is the postdialysis BUN (mg/mL), and ti is the time interval between dialyses (min). It is important to note that the simplifications included in EQUATIONS 5.4 through 5.8 help illustrate fundamental relationships but preclude their use in the clinical setting. These equations should not be used to model urea kinetics in patients because they fail to include several important patient variables already mentioned, the most important of which are native kidney urea clearance and the change in body fluid content during and between dialyses. Both factors lower the predialysis BUN and reduce the required change in BUN during dialysis, complicating the computation of nPCR. A third parameter that has a slight but significant effect on Kt/V and V is the amount of urea generated during dialysis. A more precise mathematical expression of urea concentrations during dialysis includes these additional three parameters (EQUATIONS 5.9):
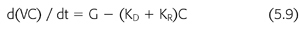
where V is the volume of urea distribution, G is the urea generation rate (presumed constant), KD is the dialyzer urea clearance, and KR is the patient’s native kidney (residual) urea clearance. Integration of EQUATION 5.9 gives a better, although more complex, expression of urea concentration during and between dialyses (EQUATION 5.10) (99,119):
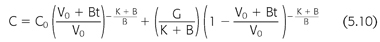
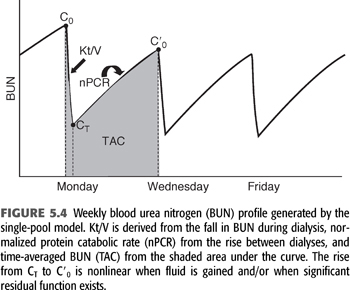
where V0 is the volume of urea distribution before dialysis, K during dialysis is the sum of KD + KR, K between dialyses is KR, and B is the rate of fluid gain between or during dialyses (a negative value during dialysis). EQUATION 5.10 can be used to predict a urea concentration profile during and between dialyses such as that shown in FIGURE 5.4. It is the fundamental equation used for single pool urea kinetic modeling, but in this case, it is used in reverse, that is, values for K/V and G are fit to measured values of C and C0 using an iterative computer-generated process. Kt/V is derived primarily from the fall in BUN during a single dialysis, and nPCR is determined primarily from the rise in BUN between dialyses, as indicated in FIGURE 5.4. The typical dialysis schedule, three treatments every 7 days, is asymmetric, with 2- and 3-day intervals between treatments. Most models can adjust for this or for any schedule.
Two–Blood Urea Nitrogen Method
When nPCR is determined from a postdialysis BUN and a subsequent predialysis BUN, only the difference between these two values enters into the calculation (EQUATION 5.8); their absolute values are ignored (116). Absolute values are also ignored for the calculation of Kt/V, which is derived mainly from the ratio of predialysis to postdialysis BUN (EQUATION 5.7). If the absolute values of the predialysis and postdialysis BUN are also included in the calculations, the third BUN measurement can be eliminated as shown in the subsequent text (99,102,120). This simplifies the urea modeling process without detracting from its accuracy.
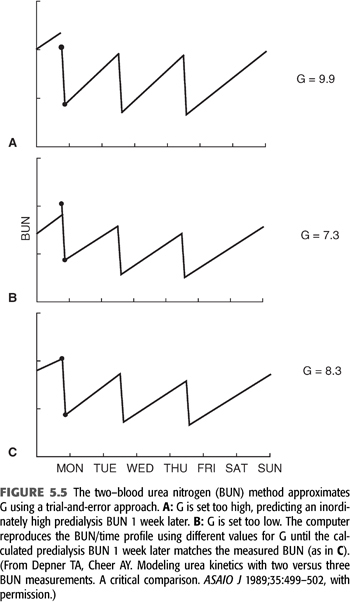
The technique for resolving G from only two-BUN measurements is shown in FIGURE 5.5. The method requires a weekly steady state of nitrogen balance—that is, a constant dialysis prescription and a constant dietary nitrogen intake from day to day for at least a week. We assume these parameters to be true, realizing the likelihood of wide protein intake variation from day to day in most people. Paradoxically, the two-BUN technique for measuring nPCR is less influenced by a dietary binge than is the three-BUN method, because the absolute value of the predialysis BUN (the major determinant of nPCR) is determined by more than a single interdialysis interval (120). The two-BUN method also offers the patient less opportunity to influence the result by altering his or her diet during the interval between the second and third blood samplings. However, even when nPCR is carefully measured, the variance is at least twice that of Kt/V.
How to Implement Modeling with Two–Blood Urea Nitrogens
The single-compartment, variable-volume model is the most commonly applied clinical tool for quantifying hemodialysis. Two of the modeling assumptions, single-pool distribution during dialysis and absence of rebound, cause errors that are offsetting (see section “Comparison with the Single-Compartment Model” later in the chapter), so the final calculations of V and Kt/V closely match those of more complex models (121).
The only two unknown variables in EQUATION 5.10 are G and V; K is measurable and is required to start the modeling process. As shown in the subsequent text, the value chosen for K need not be precisely accurate to determine Kt/V. To start the modeling process, arbitrary values for G and V are chosen and the predialysis BUN is substituted for C0 in EQUATION 5.10. V is then adjusted until the calculated value for C matches the measured postdialysis BUN using a repetitive (iterative) approach. Then KD is set to zero, the postdialysis BUN is substituted for C0 in EQUATION 5.10, and G is adjusted until C matches the predialysis BUN, using the technique described in FIGURE 5.5 for two-BUN modeling. The iterations are then repeated with the new values for G and V. The accuracy of V and G will depend on the accuracy of the chosen value for K, but K/V and G/V will be affected little by inaccuracies in K or V. nPCR can be calculated from G/V using EQUATION 5.1, and Kt/V is the product of K and t for the modeled dialysis divided by V. K between dialyses consists of KR only. Care should be taken to adjust B for asymmetric interdialysis intervals. Any schedule of dialysis treatments can be used, and the entire process takes less than a second of computer time.
The Prescribed Dose
Determinants of dialyzer clearance include the flow rates of blood and dialysate and properties of the membrane, primarily its SA, permeability, and geometry. Similar to the clearance concept, these encumbering variables can be removed from the expression of dialyzer function by defining the dialyzer mass transfer coefficient (EQUATION 5.11) (122):
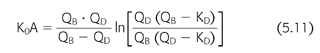
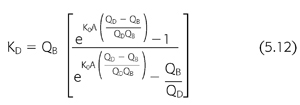
where K0A is the mass transfer area coefficient, QB is the blood flow rate, QD is the dialysate flow rate, KD is the dialyzer clearance, and “ln” is the natural logarithm. The mass transfer area coefficient, sometimes called the dialyzer intrinsic clearance, is also expressed as a flow and is considered the maximum clearance possible at infinite flow rates for the particular dialyzer model and solute. A rearrangement of EQUATION 5.11 has practical value for determining the prescribed dialyzer clearance from the machine settings of blood and dialysate flow and is a vital input parameter during the kinetic modeling process described in the subsequent text:
The dialysis center controls the dose by manipulating the dialysis variables listed in TABLE 5.3 and then calculating the dialyzer clearance using EQUATION 5.12. Although it is helpful to be able to measure each of these parameters precisely, standard urea kinetic modeling allows a retrospective estimate of the amount of dialysis delivered to the patient without the need for measuring the prescribed dialyzer clearance, flow rates, or even treatment time. This closes the loop of quality control by allowing a comparison between the amount of dialysis prescribed and that actually delivered (123). Discrepancies between the two can help to detect equipment failures including poorly calibrated or nonoccluding blood pumps, failure of dialysate pumps, problems with reuse devices, and vascular access recirculation.
Effect of Fluid Gain between and Consequent Ultrafiltration during Hemodialysis
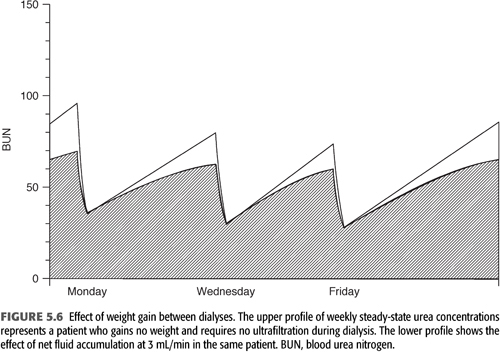
Ultrafiltration during standard hemodialysis, as currently practiced, adds a small increment to urea clearance or Kt/V. However, the fluid gains between treatments serve to dilute solute levels (FIGURE 5.6), potentially mitigating their toxicity. This effect and the additional clearance due to the ultrafiltration itself are incorporated in the formal modeling equation (“B” in EQUATION 5.10) and are most clearly seen when comparing urea reduction ratio values with Kt/V at differing levels of ultrafiltration (see section “The Urea Reduction Ratio” later in the chapter).
To add the small effect of ultrafiltration to the prescribed clearance during hemodialysis, an addition term must be added to KD (EQUATION 5.13):

where KD is the dialyzer clearance in the absence of ultrafiltration, QB is the dialyzer blood inflow rate, and QF is the ultrafiltration rate (mL/min). As the extraction ratio approaches 1, meaning that the clearance approaches the blood flow rate, the effect of QF diminishes and eventually extinguishes, because removal of solute across the dialyzer cannot exceed 100%.
Primary Hemofiltration Therapy
The same hollow fiber device used for hemodialysis can be used to filter the blood, eliminating the need for dialysate and providing clearance by convection akin to native kidney function. However, filtered electrolytes and fluid must be replaced, necessitating simultaneous infusion of a sterile physiologic salt solution in large volumes. To achieve adequate solute removal, primary hemofiltration and hemodiafiltration therapy require filtration rates that are much higher than required for standard hemodialysis. Filtration also follows the laws of first-order kinetics, so we can use the same mathematical model developed for hemodialysis to predict blood levels and measure the patient response to the dialysis treatment as Kt/V. The model makes no assumptions about how the urea was removed, only that the process was first order. The patient’s blood circulates between the filter and the patient just as it does for dialysis, and concurrent replacement of filtrate causes a rapid decline in solute concentration during treatment that diminishes the effect over time, similar to hemodialysis. The major determinants of the modeled clearance are the predialysis and postdialysis BUN. Some authorities see hemofiltration as a trend for the future because it mimics the native kidney and has potential for removing larger molecular weight (MW) solutes more efficiently (124). However, outcomes data have not fully supported an advantage to hemofiltration versus hemodialysis (125–129). Of interest, delayed diffusion within the patient, one of the limitations to effective hemodialysis, also appears to limit the effectiveness of hemofiltration (127). Therefore, diffusion plays a significant physiologic role, whether the extracorporeal removal process is diffusive or convective.
How to Add KR to Kt/V
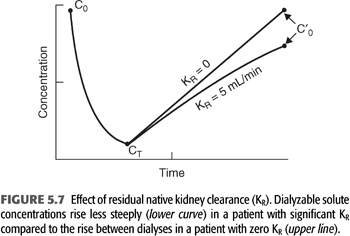
Considering that the dialyzer urea clearance is usually an order of magnitude higher than the urea clearance achieved by two normal kidneys, the much-reduced clearance (KR) contributed by the patient’s impaired kidneys adds little to total urea clearance during dialysis; its major effect is seen between treatments where it serves to attenuate the rise in BUN as shown in FIGURE 5.7. In addition, the continuous nature of KR makes it more efficient than intermittent hemodialyzer clearance, so simple addition of the two clearances is not possible. Two methods, both of which require formal urea kinetic modeling, have been used to generate a total clearance or total Kt/V that incorporates the effects of both clearances.
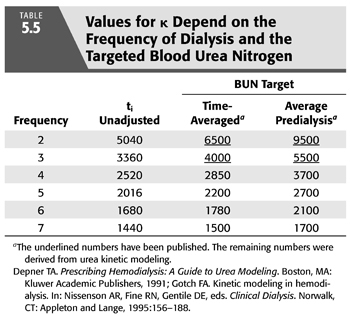
The first and oldest technique is based on and assumption of equivalent values for either the time-averaged concentration of BUN concentration (TAC) or the average predialysis BUN (avC0) (102). Any of the previously described models can be used to generate TAC or avC0 from the predialysis and postdialysis BUN while KR is included in the model. KR is then removed from the model to calculate the delivered KD that is required to produce the same TAC or avC0 in the patient with identical G and VD. In the absence of KR, KD must be increased to maintain the same TAC or avC0. The new value for Kt/V represents the total effect of both clearances. This approach is equivalent to inflating KR to a level that mimics the relatively inefficient effect of intermittent dialysis before adding the two clearances. A simplified method that does not require the second set of iterations has been published (99,102) and is discussed in a later section (with details in EQUATION 5.33 and TABLE 5.5). Also, see section “A Simplified Method for Incorporating KR”.
The second method takes the opposite approach by deflating the dialyzer clearance to a continuous equivalent clearance before adding the two. This method is described later in the section “A Continuous Equivalent Dose.”
A major barrier that discourages addition of KR to Kt/V is the inconvenience and expense of a timed urine collection. Non–urea-based methods of estimating KR may eliminate these barriers. The nuclear medicine isotope determination of kidney function used in patients with relatively preserved glomerular filtration has proven to be inaccurate in more advanced CKD (130). Determining KR in dialysis patients, using serum cystatin C levels when weekly or standard Kt/V is also known, has shown some promise (131,132). Recent KDOQI guidelines (73) have placed more emphasis on adjusting the dialysis prescription to patient KR, and we may see more research in this area.
 MULTIPLE-COMPARTMENT KINETIC MODEL
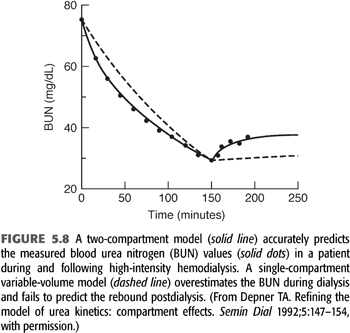
As the intensity of hemodialysis is increased and time is shortened, the potential for development of solute concentration gradients, called solute disequilibrium, increases. Evidence that disequilibrium develops during hemodialysis derives mainly from the rebound in solute concentration following dialysis (121,133). Even urea, which is a highly diffusible solute, has an easily detected rebound, indicating that the simple, single-compartment model has shortcomings. FIGURE 5.8 shows a series of BUN measurements in a patient undergoing high-flux hemodialysis. The dashed line, representing the best fit of a single-compartment model, misses the data points by a significant margin, especially early into and immediately following the treatment. Two kinds of solute disequilibrium have been described: diffusion-dependent disequilibrium and flow-dependent disequilibrium; both reduce the effectiveness of hemodialysis.
Related posts:
Stay updated, free articles. Join our Telegram channel

Full access? Get Clinical Tree


