HISTORICAL PERSPECTIVE
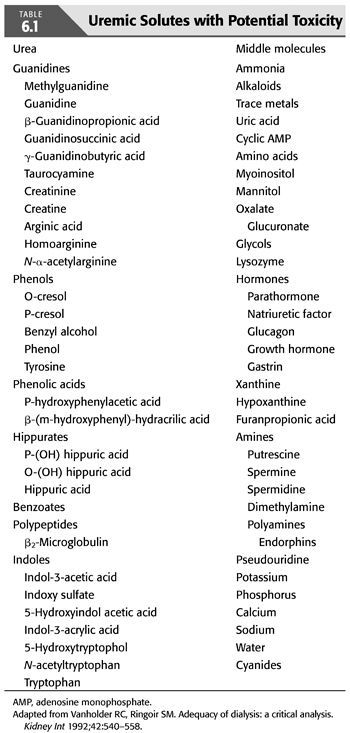
Until 1974, nephrologists frequently prescribed hemodialysis regimens based on clinical judgment, often paying more attention to fluid balance than to the need to remove metabolic waste products. Amelioration of uremic signs and symptoms was the goal of the latter, but this was invariably subjective. The pathogenesis of the uremic syndrome was not clearly understood, although the paradigm that dialysis clears the blood of a responsible metabolic waste product(s) provided the framework of therapy (4). Multiple toxins have been proposed (TABLE 6.1) (5,6), some being linked to specific manifestations of the uremic syndrome; yet, the correlation of uremic symptoms to blood levels of these substances has not been clearly demonstrated. Even today, the true nature of the uremic syndrome remains incompletely understood.
Although it is inherently not a very toxic molecule (7), urea, a 60-Da solute widely distributed in total body water, has been used as the surrogate for other uremic toxins because of its size, abundance, ease of measurement, and dialyzability. This has often led to confusion by nephrologists and non-nephrologists, believing that the blood urea nitrogen (BUN) level causes uremic signs and symptoms and that dialysis is essential for BUN levels above 100 mg/dL. Historically, the clearance of urea has formed the cornerstone of measuring the efficacy and, by inference, the adequacy of dialysis therapy.
Poor outcomes, despite intensive dialysis treatments and “adequate” urea removal, led researchers familiar with solute kinetics to theorize that larger molecules with molecular weights of 500 to 5,000 Da, “middle molecules,” may be responsible for the uremic syndrome (8). The smaller pores of standard cellulosic membranes of the 1960s and 1970s were able to clear urea, but urea clearance often failed to accurately predict patient outcomes. Despite the removal of urea by these membranes, many patients continued to experience symptoms attributable to the lack of removal of some undefined toxic metabolite (9,10). Furthermore, peritoneal dialysis (PD) patients seemed to fare better than hemodialysis patients despite increased levels of BUN and, by inference, less dialysis. This was ascribed to the larger pore size of the peritoneal membrane as compared to cellulosic hemodialysis membranes and the removal of some larger, ill-defined, middle molecule(s). These observations evolved into what is now known as the middle molecule hypothesis (8,11).
In 1974 under the guidance of the NIH, a consensus conference was held to discuss the nature of the uremic syndrome, as well the development of a clinically useful and meaningful marker of dialysis therapy. During this conference, various aspects of dialysis care were examined including the nature and pathogenesis of the uremic syndrome, quantification of dialysis therapy, nutritional status, renal osteodystrophy, as well as several other abnormalities commonly observed in hemodialysis patients.
The stage was set to test whether the clearance of urea or the as-yet-unidentified middle molecule correlated better with outcomes in hemodialysis patients. With the sponsorship of the NIH, a multicenter prospective randomized study was designed and implemented to target BUN levels by varying dialysate and blood flows while affecting the clearance of hypothetical middle molecules by varying the dialysis duration. This landmark study is known as the National Cooperative Dialysis Study (NCDS) (12–14).
National Cooperative Dialysis Study
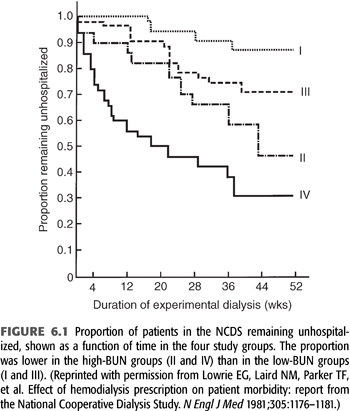
A total of 160 patients were randomized into four groups, with each group targeting either a low or high BUN level (50 mg/dL vs. 100 mg/dL average) measured over a time-averaged period [“time-averaged concentration (TAC) urea”] and a short or long dialysis time (3 ± 0.5 hours vs. 4.5 to 5.0 hours). After a follow-up of 6 months, medical dropouts and hospitalization rates were measured. Subsequently, 12-month mortality rates were measured in follow-up studies (12–14). The results demonstrated that patients dialyzed with high BUNs and short times clearly had poor outcomes, with up to a 70% hospitalization rate (FIGURE 6.1) (15). Overall, this initial analysis of the data suggested that BUN was the major factor leading to morbidity. As a result of the findings of this study, for several years after the publication of this study, many nephrologists focused on control of BUN and did not consider the dose of dialysis when prescribing and delivering dialysis therapy (16).
Despite a number of aspects of the NCDS that persist as controversial, it was the largest multicenter trial for determining dialysis adequacy prior to the Hemodialysis (HEMO) study. Its enduring lesson, which was not learned until subsequent analyses of the NCDS data were published over several years following the study, is that quantifying and providing an adequate delivered dose of dialysis is of utmost importance for a positive impact on outcome. The NCDS also validated the importance of small molecule clearance, which forms the basis of current standards of adequacy (17).
The enormous contribution of the NCDS and its subsequent reanalysis to the current thinking regarding hemodialysis therapy cannot be overstated. Several weaknesses of the NCDS, however, preclude our applying the results universally into clinical practice. These issues point out the need for caution in the interpretation of the NCDS results, and a review of these should help place the study in proper perspective.
Age of the National Cooperative Dialysis Study Cohort
The NCDS study population had an average age range of 18 to 70 years with a mean age of 51 ± 12.9 years (12–14). The dialysis population has since grown older, and the elderly population have different causes of ESKD (18), have varied and more comorbid conditions (19), and have been shown to die sooner regardless of dialysis prescription (20). In fact, after a mean age of 59 years, each year of advancing age has been associated with an approximately 3% increase in the odds ratio for death (20). Elderly patients generally have poorer nutrition, less opportunity for social rehabilitation, and less physical activity. They also have a greater chance of being demented and unable to influence their own treatment, let alone follow prescribed therapy (21,22). All of these factors highlight the changing demographics of the “typical” American dialysis patient and limit the application of the NCDS in determining how to dialyze an aging population.
Comorbid Conditions
Patients who had advanced atherosclerotic cardiovascular disease, pulmonary disease, recurrent infections, cancer, or other significant comorbid conditions were excluded from the NCDS to achieve the expected follow-up period of 1 to 3 years (12–14). However, comorbidity with multiple conditions has increased among patients with ESKD from 1976 to the present (23). Interestingly, a survey of the primary causes of death of dialysis patients highlights cardiovascular disease as the leading cause of death among dialysis patients. Internationally, this pattern of acceptance of older patients with increasing numbers and severity of comorbid illness also holds true (24). Thus, the application of the NCDS data to patients with multiple comorbidities is questionable.
Diabetes Mellitus
Patients with diabetes were excluded from the NCDS. Diabetic nephropathy is the single most common cause of ESKD in the United States (25). The effect of diabetes on survival has been suggested in a report by Collins et al. (19), where higher doses of dialysis may be beneficial in diabetic patients. The application of the NCDS data to a diabetic population is limited.
Duration of Dialysis
The patients entering the NCDS had a mean duration of dialysis of 4.3 hours, while the range studied was 2.5 to 5.5 hours (12–14). There are no data points below 2.5 hours and few data points below 3 hours. As a result of the NCDS findings, duration of dialysis was not considered as important as the BUN. In response to this, manufacturers of dialysis membranes began developing ways to achieve better urea clearance with shorter dialysis duration, as the dialysis facilities preferred to treat more patients for shorter time periods to maximize the efficiency of the facility and personnel (25,26).
It is predictable that as time for diffusion (i.e., dialysis) is shortened, there will be a point at which highly diffusible substances such as urea cease to predict adequate removal of other uremic waste products and an increase in morbidity, if not mortality, may result. Consequently, the role of duration of dialysis as an independent determinant of adequacy is being revisited. Studies have demonstrated a decreased survival in patients with dialysis time shorter than 3.5 hours (26,27). The NCDS data also revealed a trend toward increased morbidity with shorter dialysis times, although it was not as strong a correlation as with high BUN levels (15).
While the NCDS data do not address how to weigh the independent effect of dialysis duration in setting of current high-efficiency and high-flux dialysis membrane technology, observational outcomes have demonstrated the independence of dialysis treatment duration as a predictor of improved mortality rates. In fact, a few dialysis cohort studies have demonstrated that treatment time and dialysis dose are independent predictors of survival. In an Australian and New Zealand cohort, a dialysis time of 4.5 to 5 hours together with a Kt/V (a measure of dialysis dose, see subsequent text) of 1.3 to 1.4 was associated with better overall survival (28). Based on the lack of a statistical interaction between dialysis dose (Kt/V) and session length, the authors further suggest that the optimal “dialysis dose” may be a combination of a Kt/V of more than 1.3 and a treatment time greater than or equal to 4.5 hours, although they do concede that the retrospective nature of their patient cohort limits their ability to imply causation. The association between these “standard” doses of dialysis combined with a longer individual treatment has also been demonstrated by Saran et al. (29) in a large multinational observational cohort of patients. Importantly though, this analysis clearly demonstrated a mathematical interaction between higher Kt/V and longer session length and further demonstrated that an ultrafiltration rate greater than 10 mL/kg/h was associated with higher risk of both intradialytic hypotension and, more importantly, short-term patient mortality (29). On the other extreme of duration of dialysis treatment, the Centre de Rein Artificiel in Tassin, France, has reported excellent 10-year survival rates, as well as unparalleled anemia and hypertension control in their patient population. The directors of this unit attribute their success primarily to the technique of prolonged daily dialysis treatments (30,31). This form of dialysis therapy, so-called prolonged hemodialysis (PHD), does offer several documented advantages to the prevalent form of in-center, three times per week therapy practiced in the United States. However, the findings of the HEMO study (discussed in further detail in subsequent text) point out that simply increasing the delivered dose of dialysis may not lead to improved outcomes among hemodialysis patients (32). As a modification of daily therapy, the same group from Tassin has proposed thrice-weekly long nocturnal dialysis as a form of therapy that may be more acceptable to a larger number of patients with potentially equivalent outcomes (33). Therefore, in order to achieve patient outcomes similar to those in Tassin, what may be required is a fundamental rethinking of how to deliver dialysis therapy and whether treatment settings other than “in-center” would facilitate improved patient outcomes.
Dialyzer Membrane
The NCDS was performed using purely cellulosic membranes that have been replaced with newer, large-pore, high-flux, and more biocompatible membranes. Applicability of dialysis prescription in the NCDS to current synthetic membranes may be limited.
Quantity of Dialysis
The retrospectively computed dialysis dose (Kt/V, to be discussed later in this chapter) for the NCDS cohort in groups I and III, with target BUN levels of 50 mg/dL on average, was between 0.9 and 1.3 (12). Given that no groups in the NCDS received a greater dialysis dose, it is difficult to determine from the NCDS alone whether this dose is adequate, and impossible to determine whether this dose is optimal.
In another study using urea reduction ratio (URR) to quantify dialysis dose, it was demonstrated that patients receiving a URR of 60% or more had a lower mortality than patients receiving the NCDS URR of 50% or more (20). The HEMO study confirmed that doses of dialysis significantly greater [a single-pool Kt/V (SKt/V) of 1.71] than those currently recommended by the National Kidney Foundation’s Kidney Disease Outcomes Quality Initiative (NKF-KDOQI) guideline (i.e., a single pool or spKt/V of 1.2) failed to provide additional survival benefit in a representative group of hemodialysis patients on a three times per week treatment regimen. Specifically what was shown in the HEMO study was that with a “standard dose” of dialysis (achieved spKt/V of 1.32), the overall mortality was 17.1%. In the “high-dose” group (achieved spKt/V of 1.71), the mortality was 16.2%, a nonsignificant difference. Reviewing these findings, it is notable that these excellent clearance rates were achieved with mean dialysis times of 190 ± 23 minutes (standard dose) and 219 ± 23 minutes (high-dose group) (34). This finding speaks to the ability of modern dialysis technology to deliver adequate clearance of small molecules with only a modest increase in dialysis time.
Duration of the Study
The patients in the NCDS were studied for approximately 48 weeks, and most of the data were analyzed at 26 weeks (12). This may not have been enough longitudinal follow-up (19), especially as mortality actually increased approximately 1 year after the study was terminated (27,35). The report by Eknoyan et al. (34) from the HEMO study suggests that in a subgroup of female patients, a higher dose of dialysis may lead to a decrease in the risk of death and hospitalization, but this benefit of increased dose of dialysis did not appear for almost 3 years. Also in a separate subgroup of patients who had been on dialysis greater than 3.5 years at the start of the trial, the use of a high-flux dialysis filter appeared to reduce the risk of death (32,36). Also in the NCDS era, techniques such as ultrafiltration control, bicarbonate dialysate, and variable dialysate sodium programming were not in widespread use. Furthermore, the NCDS outcome measured was morbidity, not mortality (15), as is more commonly used in contemporary studies.
Nutrition
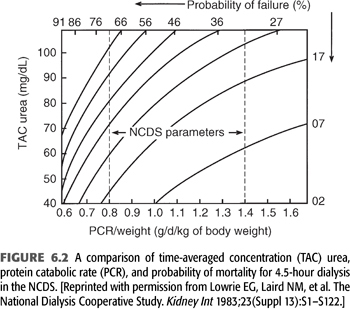
Notwithstanding the previously held misconception that a low BUN is always good, it was shown in the NCDS that the protein catabolic rate (PCR), which is computed to represent dietary protein intake, is a strong and independent predictor of poor outcome (13). This became evident despite the NCDS protocol, which was designed to provide patients with a constant protein intake of 1.1 ± 0.3 g/d/kg body weight. In the final analysis, the actual PCR range was more in the range of 0.6 to 1.5 g/d/kg body weight. Within this range, a strong negative correlation between the PCR and probability of failure (i.e., morbidity such as hospitalization) became evident, as demonstrated graphically in FIGURE 6.2. This relationship of increasing probability of failure, with declines in PCR, held true irrespective of randomization to the low BUN (50 mg/dL) or long duration (4.5 hours) dialysis groups. FIGURE 6.2 shows how patients with very low PCR (0.6 g/d/kg body weight) will have at least a 35% probability of failure despite 4.5-hour dialysis treatment and a low (40 mg/dL) TAC urea. Conversely, a patient with a high PCR (1.2 g/d/kg body weight) will have less than a 15% probability of failure, even with a higher TAC urea of 60 mg/dL and the same dialysis duration.
Subsequent studies have demonstrated how nutrition affects survival in dialysis patients when serum albumin is used as a marker for prognosis. Lowrie (37) reported this with his National Medical Care [now Fresenius Medical Care (FMC)] database in 1990 and again in 1994 (38), which demonstrated a marked increase in mortality as the serum albumin falls. This albumin–mortality relationship has also been noted by Owen et al. in 1993 (20), as well as several other authors.
Several authors and investigators have given increasing attention to the role that overall nutritional status plays in the survival of dialysis patients, as well as the relationship between adequacy of dialysis, nutritional status, and patient survival. Specifically, in a secondary analysis of the HEMO study, poor nutritional status predicted a high risk for mortality regardless of the targeted (or achieved) dialysis adequacy. In addition to albumin levels, other biochemical indices such as serum creatinine, total cholesterol, anthropometry [i.e., a low body mass index (BMI)] and Karnofsky functional index were each independently associated with higher risk for death. The association of most of these markers with outcome was nonlinear; with the risk of mortality increasing more steeply at lower levels, suggesting that as dialysis patients become progressively malnourished, the risk of short-term mortality escalates. Consistent with these reports, Chertow et al. (39) showed that decreasing serum prealbumin level is associated with all-cause hospitalization and increased mortality independent of dialysis dose. These findings reinforce the need for longitudinally monitoring both nutritional status and adequacy of therapy in all dialysis patients.
Another aspect of this nutrition–mortality relationship that has been explored by Chertow et al. (40) is the complexity of the relationship between dialysis dose, as measured by urea removal, and mortality. One of the most important aspects of the NCDS study came not from the study itself but rather from a reanalysis of the data several years later by Gotch and Sargent (12). In this mechanistic analysis of the data, a method of quantifying dialysis treatment by means of a dynamic rather than the static measure of urea removal was developed and verified as a valid measure of dialysis dose. However, even with the use of this dynamic measure, a complex relationship between dialysis dose and mortality is evident. Subsequently, several authors have independently noted a “reverse J”–shaped relationship between the dose of hemodialysis, as measured by either URR, or Kt/V (both terms are defined in subsequent text). What is meant by “reverse J” is that with both extreme low and high values of urea removal, as measured by URR or Kt/V, there is an unexpected increase in the relative mortality of patients (41,42).
This complexity of the dose–mortality relationship has led some authors to propose that urea distribution volume, V, is a surrogate marker for nutritional fitness. As such, urea distribution volume may possess survival characteristics of its own (40,43–45). Technologic advances have also allowed for the continuous and near instantaneous measurement of ionic or online dialysis clearance and the calculation of a “real-time” Kt/V (46). The advantages of this method include no requirement for blood sampling and that it can be used with each dialysis treatment to predict the delivered Kt/V in real time before the treatment is finished. Among the disadvantages of this technique, however, is that in order to calculate Kt/V, time on dialysis and V must be determined accurately. The latter is a potential problem if anthropometric formulas are used to estimate V because these formulas are estimates that often differ significantly from the true value. Based on these potential shortcomings as well as the lack of outcomes data using this technique, most guidelines for adequacy continue to recommend blood side monitoring of dialysis dose.
The fine balance between trying to delay progression of kidney disease versus inducing malnutrition and the consequent adverse effects on mortality has created substantial confusion and variation in clinical practice, especially with regard to the appropriate timing of initiation of chronic dialysis therapy. Although the Modification of Diet in Renal Disease (MDRD) study (47) had provided some support for the hypothesis that dietary protein restriction slows the progression of kidney disease, studies have raised concern regarding the effects of pre-ESKD dietary protein restriction on patient mortality after ESKD supervenes. Kopple et al. (48) have concluded that 0.8 g/d/kg body weight of protein is safe for at least 2 to 3 years but recommend that additional indices of nutritional status such as serum transferrin, body weight, urine creatinine, and caloric intake be monitored regularly. The NIH Consensus in 1994 (49) recommended an initial diet of 0.7 to 0.8 g/d/kg body weight in pre-ESKD patients but cautioned to regularly assess for signs of malnutrition. Should such signs become evident, an increase of protein intake to 1 to 1.2 g/d/kg body weight as well as increased caloric intake is recommended. It is notable that decline in protein and energy intake and in indices of nutritional status have been documented in patients with a glomerular filtration rate (GFR) below about 50 mL/min when ingesting uncontrolled diets, suggesting that prescription of this level of protein restriction outside of a clinical trials setting may lead to ingestion of inadequate energy and insufficient protein. Lowrie and Lew (37) have demonstrated a strong correlation between higher serum creatinine levels and improved survival in hemodialysis patients, reflecting better muscle mass, which is likely a marker for nutritional status and may be independent of dialysis dose. All these studies compliment the NCDS and are reflections of the changing emphasis on nutrition in dialysis patients (50–53).
The earlier-noted controversy is further compounded when chronic kidney disease (CKD) patients progress to ESKD and are confronted by a multitude of factors affecting nutrition, such as anorexia due to uremia or underdialysis, the inconvenience of thrice-weekly dialysis schedules, comorbid conditions such as diabetic gastroparesis, hormonal factors, depression, and frequent hospitalizations (54). Indeed, more than one-third of dialysis patients report a poor or very poor appetite, and low self-reported appetite is associated with lower dietary energy and protein intakes, poorer nutritional status, higher comorbidity, and lower quality of life. Secondary analysis of the HEMO study indicated that low self-reported appetite is independently associated with increased hospitalizations, but the association of appetite with death in this study was confounded by comorbidity (55,56). In addition, depression is believed to be the most common psychiatric disorder in patients with ESKD, with previous studies reporting up to 25% of prevalent dialysis patients having a Beck Depression Inventory score in the moderate range of depression (57). Given the prevalence and associations between depression, treatment adherence, malnutrition, and mortality, it is clear that screening for mental health issues is an important part of the care of dialysis patients.
 TIMING OF DIALYSIS INITIATION
In 2012, over 90% of new patients (98,954) began ESKD therapy with hemodialysis, 9,175 with PD, and 2,803 received a preemptive kidney transplant (these data exclude patients with missing demographic information). Use of PD and preemptive kidney transplant were relatively more common in younger age groups. Use of home dialysis therapies among incident ESKD patients has increased notably in recent years (3).
The appropriate timing of initiation of chronic dialysis therapy is also closely tied to nutritional markers in dialysis patients. This relationship has been demonstrated in a number of observational studies in which spontaneous dietary protein restriction was observed with declining GFRs (58,59). Concern regarding the long-term consequences of such dietary restriction as well as the long-term effects of long-standing uremic toxicity has prompted several groups to investigate the appropriate timing of initiation of dialysis therapy. Initially, multiple investigators showed that earlier initiation of dialysis therapy led to prolonged duration of life, increased potential for rehabilitation, and decreases in hospitalization (60–62). The Canada–United States of America (CANUSA) study likewise showed that for patients with weekly creatinine clearances less than 38 L/wk, 12- and 24-month survival was 82% and 74%, respectively. However, in a group of patients with creatinine clearance greater than 38 L/wk, 94.7% of patients survived 12 months and 90.8% of patients survived 24 months (63). While the CANUSA results demonstrate the survival benefit of residual renal function among PD patients, the role of diuretics and residual renal function was investigated among an international cohort of subjects through the Dialysis Outcomes and Practice Patterns Study (DOPPS). In this cohort of subjects, both diuretic use and residual renal function were positively associated with improvements in all-cause as well as cardiac mortality, potentially related to lower interdialytic weight gain and a reduced incidence of intradialytic hypotension. Other authors have postulated, however, that the benefits of residual renal function may be related to improved clearance of uremic toxins with a molecular weight higher than urea and other “small uremic molecules” (64,65). Prompted by these studies, as well as expert opinion, the NKF-KDOQI guidelines advise the initiation of dialysis therapy of some type when the weekly kidney (residual) Kt/V falls below a level of 2.0 (an approximate creatinine clearance of 9 to 14 mL/min/1.73 m2). Clinical considerations that dialysis may not need to be imminently initiated were (a) stable or increasing edema-free body weight or (b) complete absence of clinical signs or symptoms attributable to uremia (66).
Despite these convincing arguments that earlier initiation of dialysis leads to improvements in patient outcomes, the relationship is still debated. The DOPPS, which compares a large cohort of American dialysis patients to groups of patients from Europe (France, Germany, Great Britain, Italy, Spain) and Japan, has shown that despite earlier initiation of dialysis among the American cohort of patients, the survival of this group of patients was actually worse than those of Europe and Japan. Even after consideration of potential confounding factors such as coexistent comorbidities and nutritional status as measured by serum albumin level, this increase in mortality persisted (67). The Netherlands Cooperative Study on the Adequacy of Dialysis phase-2 (NECOSAD-2) is a large multicenter study in the Netherlands. In this prospective analysis, patient’s health-related quality of life (HRQOL) was measured by means of the Kidney Disease and Quality of Life Short Form repeatedly over the first year of dialysis therapy. Of 237 patients who had measurements of residual renal function measured between 0 and 4 weeks prior to the initiation of dialysis therapy, 38% were classified as late starters based on the NKF-KDOQI guidelines. At baseline, the HRQOL for this group of patients was statistically lower in the realms of physical role functioning, bodily pain, and vitality than those patients who initiated timely dialysis per the NKF-KDOQI guidelines. However, after a follow-up of 12 months, the differences among groups disappeared (68). Another study examined the effects of lead-time bias in perceived increased longevity with an earlier start of dialysis, that is, a perceived prolongation of survival due to longer monitoring of those patients who initiated dialysis at an earlier time in their disease process. In order to overcome the potential effects of lead-time bias, these authors assembled their cohort of patients on the basis of a residual creatinine clearance of 20 mL/min. Early and late start of hemodialysis was defined by a creatinine clearance cutoff of 8.0 mL/min. This analysis clearly showed that lead-time bias is a real phenomenon in dialysis patients and that by monitoring patients from a defined starting point that predates the initiation of dialysis, there was no difference in 10-year survival among the two groups of patients (69). Together, these studies underscore the need to individualize the timing of initiation of chronic dialysis therapy.
Initiating Dialysis Early and Late Study
Another trial examining the relationship of the timing of dialysis initiation is the Initiating Dialysis Early and Late (IDEAL) study. Published in August 2010, the IDEAL study was a randomized controlled trial of early versus late initiation of dialysis (70). Thirty-two centers in Australia and New Zealand examined whether the timing of maintenance dialysis initiation influenced survival in patients with CKD. Patients at least 18 years old with progressive CKD and an estimated glomerular filtration rate (eGFR) between 10.0 and 15.0 mL/min/1.73 m2 of body surface area (BSA) (calculated with the use of the Cockcroft–Gault equation) were randomly assigned to planned initiation of dialysis when the eGFR was 10.0 to 14.0 mL/min (early start) or when the eGFR was 5.0 to 7.0 mL/min (late start). Between July 2000 and November 2008, 828 patients underwent randomization, and the mean age was 60.4 years. The primary outcome was death from any cause. Important to note that 75.9% of the patients in the late-start group initiated dialysis when the eGFR was above the target of 7.0 mL/min due to the development of symptoms. The decision to start was at the discretion of the patient’s nephrologist. The mean duration of follow-up was 3.64 years in the early-start group as compared to 3.57 years in the late-start group.
The study found that early initiation was not associated with an improvement in survival, the primary outcome, or in several secondary clinical outcomes such as cardiovascular or infectious events. The median time from randomization to initiation of dialysis was 1.8 months in the early-start group and 7.40 months in the late-start group. The mean eGFR, using Cockcroft–Gault equation, was 12.0 mL/min in the early-start group and 9.8 mL/min in the late-start group. In the early-start group, 18.6% started dialysis with eGFR of less than 10.0 mL/min. This population was also unique when compared to the dialysis patients in the United States because PD was the initial method in 195 patients in the early-start group and 171 patients in the late-start group. Baseline characteristics were similar between the early- and late-start groups. The authors conclude that early initiation of dialysis had no significant effect on the rate of death or on the secondary clinical outcomes. Although there was only a 2.2 mL/min difference in actual achieved eGFR in the study, there was a 6-month time difference in time to dialysis initiation between the two groups, and 6 months off hemodialysis is a recognizable opportunity as well as a substantial financial cost savings without a change in survival.
A 6-month delay in initiation of dialysis seems beneficial, but one has to acknowledge that patients need to be very carefully monitored in the interim. The previously cited NECOSAD study clearly shows that HRQOL at the time of initiation of dialysis is significantly lower in those patients who are maintained off of dialysis therapy. Given this and the often subtle symptoms of uremic toxicity, patients with impending dialysis needs will require close monitoring in order to avoid untoward effects of uremia and to make the transition to dialysis therapy as smooth as possible. The decision when to initiate renal replacement therapy should be based on the patient’s overall clinical status, not just the GFR, but when the GFR falls below 15 mL/min, the patient should be followed even more closely for signs and symptoms of uremia, and placement of dialysis vascular access for those choosing hemodialysis should certainly be completed at that level of kidney function.
There is not a consensus regarding the modality with which to initiate renal replacement therapy. In an article by Kalantar-Zadeh et al. (71) published in 2014, the authors propose further investigation to compare twice-weekly hemodialysis versus thrice-weekly hemodialysis in the initiation of renal replacement therapy in patients with ESKD. It is well established that mortality in incident dialysis patients and that the loss of residual renal function is higher in patients on hemodialysis therapy than PD. Erythropoiesis-stimulating agent (ESA) use is higher as well during the first months of dialysis therapy. In the Frequent Hemodialysis Network (FHN) nocturnal trial, there was a more rapid loss of residual renal function in the nocturnal hemodialysis group compared to the standard group (72). In a Taiwanese study, patients on twice-weekly hemodialysis had a slower decline in residual renal function as compared to the thrice-weekly group (73). To date, there are no randomized controlled trials to evaluate if there is a survival advantage with twice-weekly dialysis at initiation. A major confounder in the past in retrospective analyses has been insufficient data regarding baseline and/or subsequent residual renal function. The impetus for twice-weekly dialysis may include theoretical preservation of residual renal function, less frequent cannulations, and possibly complications of arteriovenous access as well as patient quality of life with less time spent on dialysis. However, some concerns include prolonging the interdialytic interval, which may increase the incidence of hyperkalemia, volume overload, and sudden death. In their 2014 publication, Kalantar-Zadeh et al. (71) have proposed 10 criteria including, but not limited to, urine output greater than 500 mL/day, potassium usually less than 5.5 mg/dL, phosphorus commonly below 5.5 mg/dL, and hemoglobin greater than 8 g/dL to ascertain eligible candidates for twice-weekly hemodialysis therapy. They do not specify a particular GFR among the designated 10 criteria. The residual renal function needs to be reassessed monthly along with typical hemodialysis adequacy parameters. The validity of these proposals should be tested in clinical trials. These authors also advocate PD first before hemodialysis, highlighting the benefit of preservation of residual renal function (71).
The choice of an incremental dialysis prescription will require periodic measurement of urine output and endogenous kidney function, which can be an eGFR based on the average of creatinine and urea clearances on an interdialytic urine collection, or a weekly Kt/V for urea based on the predialysis BUN. The dialysis dose will need to be increased as endogenous kidney function inevitably declines. Because hemodialysis is an intermittent therapy compared to the continuous nature of residual renal function, the dialysis Kt/V cannot be simply added to the endogenous Kt/V to obtain the total weekly Kt/V as can be done for PD patients. The use of an “equivalent” Kt/V transformation is required, which is also required to calculate the “equivalent” Kt/V of hemodialysis therapies administered more or less frequently than three times per week. In this context, it is important to recall that the target Kt/V of greater than 1.2 for hemodialysis applies only to thrice-weekly therapy.
O’Hare et al. (74) have reviewed the epidemiologic trends in the timing and the clinical context of dialysis initiation based on reviewing United States Department of Veterans Affairs data in fiscal years 2000 to 2009 (72). In 2000 to 2004, as compared to 2005 to 2009, the mean eGFR at dialysis start increased from 9.8 ± 5.8 to 11.0 ± 5.5 mL/min/1.73 m2 (p <0.001), and after stratification by illness acuity and a number of symptoms, there was still a significant increase in mean eGFR at initiation over time for all subgroups. The upward trend of eGFR at time of initiation appears to reflect changes in timing of initiation rather than variation in the clinical context or changing indications. The reason for the uptrending eGFR at initiation is unclear, but there are numerous speculations including, but not limited to, the adaptation of more liberal KDOQI guidelines allowing for dialysis initiation at higher levels of eGFR.
Although there are trends and general guidelines, the approach to dialysis initiation must be individualized. Bargman (75) describes an interesting patient interaction which highlights the many nuances of dialysis initiation and modality selection. Effective predialysis education is essential to allow for a smooth transition, and decisions such as whether to even pursue dialysis versus nondialysis supportive care are paramount. In a prospective observational study published in 2015, authors found that elderly patients with advanced CKD managed via a nondialysis pathway that included conservative and at times palliative kidney supportive care survived a median of 16 months with a 53% 1-year survival from the time of referral to a kidney supportive care clinic with mean eGFR of 16 mL/min/1.73 m2 (76).
When dialysis is selected, the initial question should be in-center versus home therapies. Patients who start dialysis in a nonemergent setting may be candidates for incremental dialysis which could mean fewer sessions of hemodialysis per week or fewer hours per session or both; in the realm of PD, this could translate into just a couple of exchanges per day. Incremental dialysis could potentially ease patients into the transition from a patient with CKD to someone who relies on renal replacement therapy. There is potentially a practical benefit to early-start dialysis in that technical aspects such as malfunctioning PD catheters or needle infiltration of a fistula could be addressed in less dire situations than late-start dialysis. It has also been suggested that the institution of PD is associated with a slowing decline of residual renal function (75). The 2015 KDOQI adequacy update suggests that the decision to initiate maintenance dialysis should rely on a clinical assessment of signs and symptoms rather than a certain level of kidney function (17). The time to initiate dialysis is truly a collaborative process among the patient, medical staff, and any caretakers, and the plan of care should be individualized to allow for the best experience.
 DIALYSIS QUANTIFICATION
The most important contribution of the NCDS is the concept that the delivered dose of dialysis can and should be quantified. With urea as the marker for most small molecular weight uremic toxins, the NCDS targeted the dose of dialysis by maintaining a certain TAC urea or midweek predialysis BUN, with the caveat that protein nutrition must be maintained. It is important to note, however, that in this study, which forms the basis for our current measurement and monitoring of hemodialysis therapy, the currently accepted measure of hemodialysis dose, Kt/V, was neither monitored nor was a specific Kt/V “target” measured. Rather, the lasting impact of the NCDS came from a mathematical analysis of the data approximately 5 years after the completion of the study by Gotch and Sargent (12). The conceptual shift that resulted from this analysis moved physicians prescribing dialytic therapies from viewing urea not from a static model (single midweek or averaged blood levels) but from a kinetic model (the change in urea during the course of a hemodialysis procedure). The most familiar kinetic urea model today is Kt/V, which is the paradigm that evolved from analysis of the data consisting of the actual delivered dose of dialysis from the patients in the NCDS (12).
K is the dialyzer urea clearance in milliliters per minute.
t is the time (i.e., duration) of the dialysis therapy in minutes.
V is representative of the volume of distribution of urea (approximately equal to total body water).
This expression attempts to express the dose of dialysis as fractional urea clearance and is analogous to the effects of normal body clearance mechanisms on the blood level of an administered drug.
Measuring the Dose of Hemodialysis
Many methods have been proposed to measure the dose of dialysis a patient receives. The square meter hour hypothesis and dialysis index intended to address this issue (8) but did not take into consideration the volume of distribution of solute (e.g., urea). Teschan in the 1970s proposed a target dialytic clearance of 3,000 mL/wk/L of body water (20). This took into consideration urea distribution volume and, at a regimen of three dialysis treatments per week, a target of 1,000 mL/dialysis/L body water translating to the dialysis index of 1, which was used as the reference point. Certainly, other terms have been devised such as probability of failure in the NCDS (14), URR (20), and, as discussed earlier, the Kt/V (12). The latter two are currently the methods of choice for most institutions. In a large cohort of incident dialysis patients representative of the U.S. hemodialysis population, the overall predictive ability of URR, spKt/V, double pool or equilibrated Kt/V (dpKt/V), and Kt are all essentially the same (77).
Urea Reduction Ratio
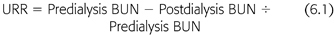
The URR is an approximation of the fraction of BUN removed in a single dialysis session. The numerator is the difference between the pre- and postdialysis BUN, and the denominator is the predialysis BUN (EQUATION 6.1):
Related posts:
Stay updated, free articles. Join our Telegram channel

Full access? Get Clinical Tree


