Chapter 16 Computed tomography of the liver, biliary tract, and pancreas
Imaging Overview
Technologic advances have dramatically expanded the role of computed tomography (CT) in hepatobiliary and pancreatic imaging. New developments in CT technology, image display, and three-dimensional postprocessing have broadened the role of CT in patients with hepatobiliary and pancreatic disease. The role of imaging has extended beyond lesion detection to vascular mapping, assessment of tumor vascularity, and surgical planning (see Chapter 90A, Chapter 90B, Chapter 90C, Chapter 90D, Chapter 90E, Chapter 90F ). As technology continues to be refined, CT remains the main imaging modality for evaluating the liver and pancreas.
Technical Advances
Helical CT has undergone another major advance with the development of a new class of multidetector array scanners (MDCTs), which use a substantially greater percentage of the x-rays emitted from the tube cathode. This improves tube efficiency and permits even faster scanning. Multiple acquisitions through the liver may be obtained in a single breath hold to obtain images in the early and late arterial phases. Early arterial phase images are useful to identify variant vascular anatomy before hepatic arterial embolization, prior to placement of a hepatic arterial chemoinfusion pump, or before hepatic resection. Late arterial phase images are useful in the detection of hypervascular hepatic lesions. MDCT also allows thinner collimation (submillimeter), which improves resolution and increases detection of small hepatic lesions by 46% (Weg et al, 1998).
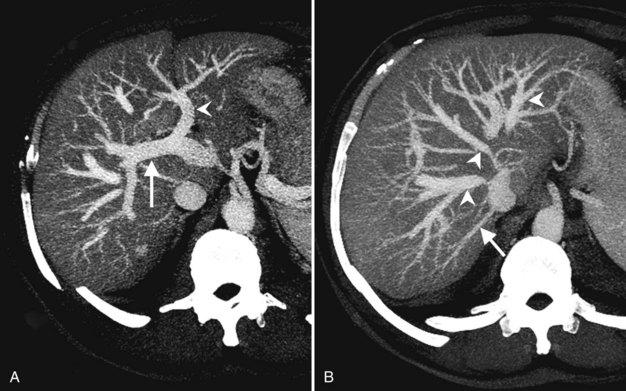
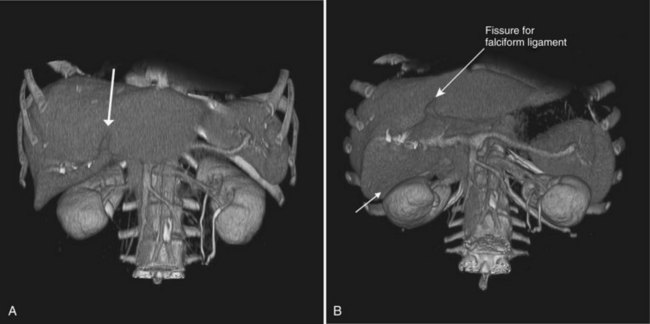
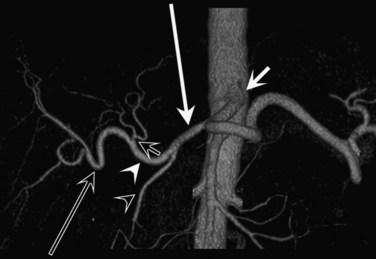
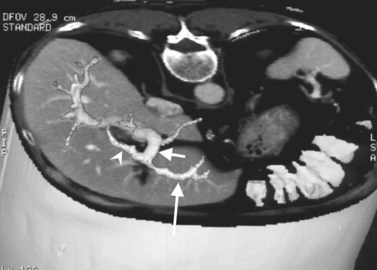
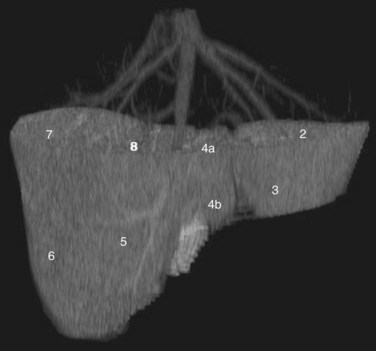
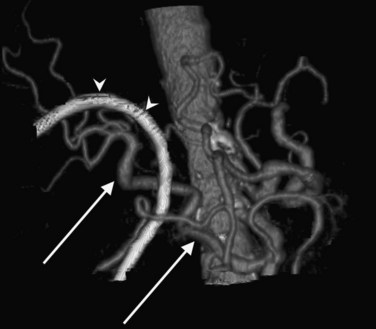
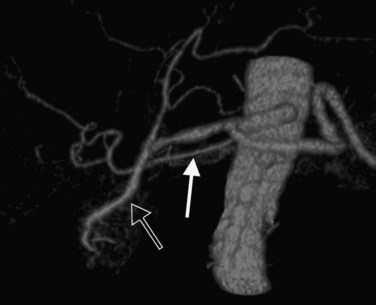
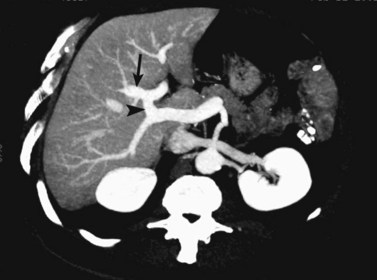
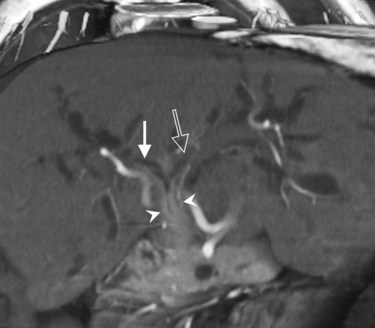
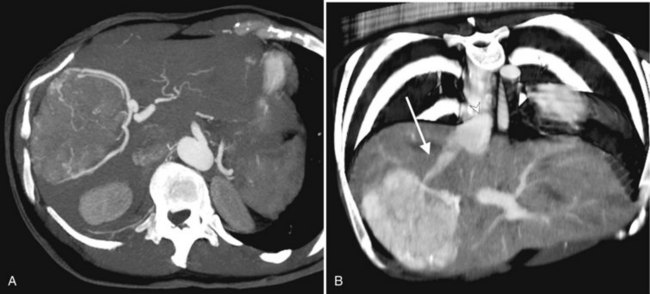
CT data are acquired in volumetric data sets that can be postprocessed on a three-dimensional workstation. The generation of 16-slice MDCT scanners acquires isotropic voxels that are essentially perfect cubes of information, resulting in three-dimensional models without image distortion. Several different types of postprocessing techniques are available (Salgado et al, 2003). Maximum intensity projection (MIP) images depict only the brightest structures within the volume of data (Johnson et al, 1996, 2003; Magnusson et al, 1991; Rubin, 2003; Salgado et al, 2003; Zeman et al, 1994). When focusing on the liver in the portal venous phase of contrast enhancement, MIP images produce a concise depiction of portal venous and hepatic venous anatomy (Fig. 16.1). Volume-rendered reconstructions provide a lifelike three-dimensional model of complex anatomy that can be rotated in any direction (Fig. 16.2; Johnson et al, 1996, 2003; Rubin, 2003; Zeman et al, 1994). This type of reformatting transforms the numerous axial images into an interactive three-dimensional model. Hepatic arterial anatomy can be displayed with a three-dimensional model composed of reconstructed axial images (Fig. 16.3). The relationship of tortuous vessels to the hepatic parenchyma and lobar anatomy can be depicted clearly (Fig. 16.4). It is also possible to view a rotating model that depicts the relationship of a mass to the adjacent vessels from any angle to help the surgeon conceptualize preoperatively what would be encountered at surgery (Fig. 16.5; see Chapter 90A, Chapter 90B, Chapter 90C, Chapter 90D, Chapter 90E, Chapter 90F, Chapter 92 ).
Role of Computed Tomography in Liver and Biliary Imaging
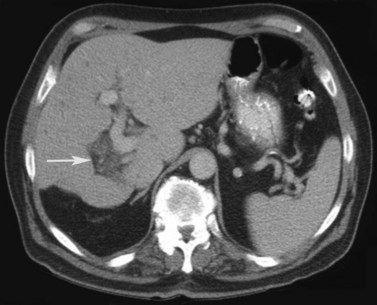
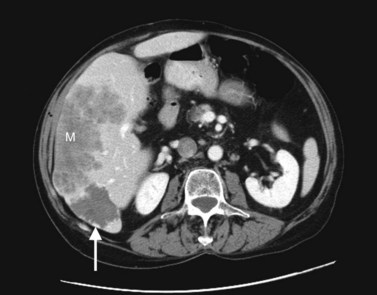
CT is particularly valuable in planning for hepatic resection. Using the contrast-enhanced portal and hepatic veins as anatomic landmarks, the radiologist can localize tumors into the specific hepatic segments (Fig. 16.6). The proximity of tumor to the major portal pedicles, hepatic veins, and inferior vena cava (IVC) is evident, and this information determines the extent of hepatic resection required to achieve clear surgical margins (Figs 16.7 and 16.8). CT can also help predict whether sufficient hepatic reserve will exist after hepatic resection (see Chapter 90A, Chapter 90B, Chapter 90C, Chapter 90D, Chapter 90E, Chapter 90F, Chapter 92 ). Hepatic atrophy (Fig. 16.9), resulting from biliary obstruction with or without portal venous occlusion, and compensatory hypertrophy can be identified on CT. Fatty infiltration and hepatic cirrhosis, processes that affect the remnant liver’s ability to regenerate, are apparent. CT angiography can identify the arterial supply to tumor and can delineate the extent of tumor involvement along the arteries.
An important additional role of CT angiography for evaluating patients with hepatobiliary malignancy is the delineation of variant arterial anatomy, which occurrs in more than half of the population (Michels, 1955). Visualization of the surgical field often can be limited in patients with hepatobiliary malignancy, especially with prior surgery, if the patient is obese, or when local inflammation is present, such as that accompanying a biliary stent. Preoperative knowledge of variant anatomy can assist in surgical planning (see Chapter 90, 92 ), facilitate surgical dissection, and help avoid iatrogenic injury (Winston et al, 2007). CT angiography is a noninvasive alternative to direct catheter angiography for preoperative planning before placement of an intraarterial chemoinfusion pump (Kapoor et al, 2003; see Chapter 86).
Technique
State-of-the-art CT evaluation of the liver for hepatic resection includes contrast-enhanced CT and CT angiography. The specific protocols vary with the specific tumor type being evaluated, but most hepatic neoplasms are low attenuation on contrast-enhanced CT and are evaluated best during the portal venous phase of imaging. Hypervascular neoplasms, such as hepatocellular carcinoma (HCC) and metastatic neuroendocrine tumors, are evaluated using a triphasic protocol including non–contrast-enhanced CT, hepatic arterial phase images, and portal venous phase images (Fig. 16.10). Oral contrast medium is administered routinely for CT, but water is substituted when CT angiography is performed. Routine hepatic parenchymal imaging generally is performed using 5-mm slices.
Non–Contrast-Enhanced Computed Tomography of the Liver
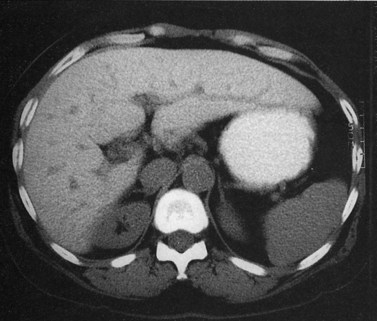
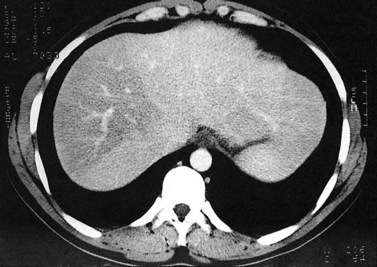
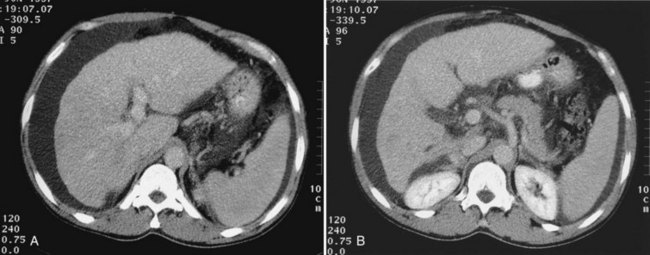
The attenuation value of the normal liver typically varies between 54 and 60 Hounsfield units (HU), which is approximately 8 HU greater than that of the spleen, owing to glycogen and iron stores in the liver. Increased density may be seen in hemochromatosis, glycogen storage disease, Wilson disease, β-thalassemia, sickle cell disease, and with certain drugs (amiodarone, cisplatin). A false appearance of increased hepatic density may occur in anemia, in which the decreased attenuation of the blood pool gives the impression of increased hepatic density relative to the intrahepatic vessels. Decreased hepatic density most frequently is related to fatty infiltration of the liver or occasionally secondary to hepatic edema. Noncontrast CT is useful for detecting diffuse abnormalities, such as hemochromatosis or fatty infiltration (Figs. 16.11 and 16.12), in which the attenuation of the liver is increased (hemochromatosis) or decreased (fatty infiltration). Both of these processes may be obscured by the administration of intravascular contrast medium. Hemorrhage or faint calcifications also are better visualized on unenhanced CT (Fig. 16.13).
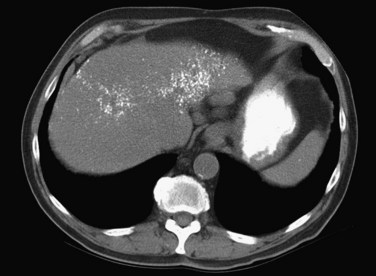
FIGURE 16.13 Unenhanced computed tomography reveals numerous calcifications in a patient with amyloid.
Hepatic neoplasms usually have a high water content, resulting in relative hypoattenuation compared with liver parenchyma. The portal veins and bile ducts also are of lower attenuation than liver parenchyma, and a vessel running vertically through a section may mimic a small tumor, leading to errors in diagnosis. On unenhanced studies, the attenuation difference between liver and tumor may be subtle and may require viewing at very narrow window widths to allow focal lesion detection, but much higher lesion-to-liver attenuation difference can be achieved by the administration of intravenous contrast medium (Tidebrant et al, 1990).
Contrast-Enhanced Computed Tomography of the Liver
The administration of an iodinated contrast agent serves many purposes in hepatic CT imaging, including improved lesion detection and characterization and better vascular mapping. Because a precise rate of injection is essential to image quality, a dedicated power injector is required. Different methods are commercially available to determine the time of maximal arterial enhancement for each patient, depending on factors such as cardiac function and state of hydration (Sica et al, 2000).
Lesion conspicuity is enhanced when there is maximal contrast between a lesion and the surrounding parenchyma. The liver receives 75% to 80% of its blood supply from the portal venous system and only 20% to 25% from the hepatic artery; however, the majority of liver tumors receive most of their blood supply from the hepatic arterial system (Honda et al, 1992). The noncirrhotic liver displays maximal contrast enhancement at approximately 70 seconds from the start of the intravenous administration of contrast medium. At this time, referred to as the portal venous phase of enhancement, maximal contrast between a liver lesion and the surrounding parenchyma is seen with clear delineation of the portal and hepatic veins. Routine evaluation of the liver should be performed using portal venous phase imaging.
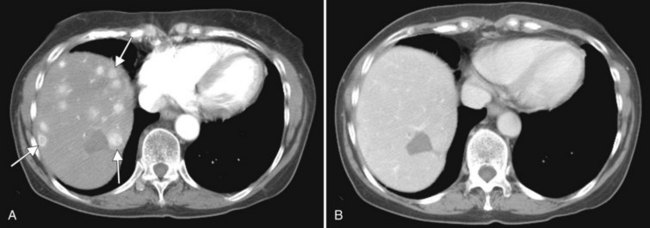
The pattern of contrast enhancement also is important for lesion characterization. Certain lesions, such as focal nodular hyperplasia (FNH) and hemangiomata (discussed in greater detail later in this chapter), have specific patterns of enhancement on arterial phase and portal venous phase images. Hypervascular malignant neoplasms, such as HCC and metastatic neuroendocrine carcinoma, display prominent contrast enhancement and increased lesion conspicuity on the arterial phase images, but these lesions may become isodense to the remaining liver and and may be invisible on the portal venous phase images (Fig. 16.14). When HCC or neuroendocrine mestastases are suspected, arterial phase images should be acquired in addition to the routine portal venous phase images.
Lesion Evaluation
In a patient with multiple hepatic lesions, each lesion should be evaluated independently, because benign and malignant lesions may coexist (Fig. 16.15). Mistaking an incidental benign lesion for a malignant mass has clear and potentially important implications in patient management, perhaps leading to unnecessary invasive procedures or resulting in a diagnosis of metastatic disease that alters treatment recommendations. When assessing lesion size for treatment response on serial CT scans, it is important to compare serial, unenhanced CT scans with unenhanced CT scans and to also compare contrast-enhanced scans with contrast-enhanced scans. Nazarian and colleagues (1999) showed that colorectal metastases appeared different in size on pre–contrast-enhanced and post–contrast-enhanced CT scans obtained as part of the same examination. On average, hepatic metastases from colorectal carcinoma appeared significantly smaller after contrast media administration (Nazarian et al, 1999).
Anatomy
Gross Morphology
Three scissurae interrupt the surface of the liver and help define its segmentation (see Chapter 1B). The interlobar fissure is an incomplete structure that defines the inferior separation between the right and the left liver; the scissura here is generally difficult to identify on axial CT, but its position may be estimated, because it is orientated in a vertical plane defined by the gallbladder fossa inferiorly (Fig. 16.16) and the middle hepatic vein superiorly. The gallbladder lies in the main interlobar scissura on the inferior surface of the liver. Three-dimensional reformatting of axial CT data provides a clear depiction of the interlobar scissura and its relationship to the hepatic segments (see Fig. 16.6).
Segmental Anatomy
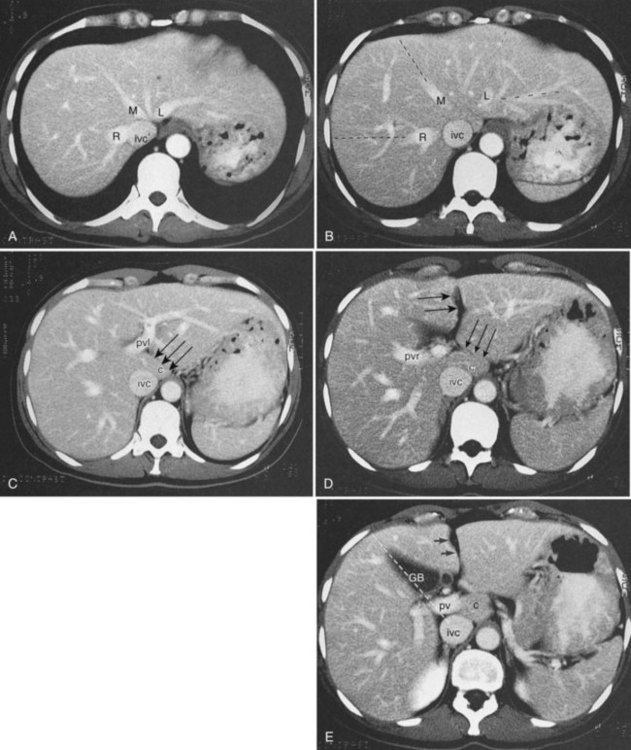
The segmental anatomy of the liver is based on both the hepatic venous outflow and the inflow pedicles. A functional scheme that corresponds to the liver anatomy and is useful surgically has been described (Bismuth, 1982). The three main hepatic veins divide the liver into four sectors, each of which is independent in that it receives a separate portal venous and hepatic arterial supply and is drained by a separate bile duct. The middle hepatic vein divides the liver into a right and left liver. The right liver is divided into two sectors by the right hepatic vein, and the left liver is divided similarly by the left hepatic vein. Because axial CT readily shows the course of all three major hepatic veins on contrast-enhanced scans obtained near the diaphragm, the major hepatic sectors are easy to identify at this level. The inferior boundary between the anterior and posterior sectors of the right lobe has to be estimated by extrapolating the line of the right hepatic vein onto lower sections. An imaginary line drawn between the IVC and the gallbladder divides the right and left liver on caudal sections and corresponds to the line of the middle hepatic vein. Three-dimensional reformatting can assist in localization of the hepatic segments (see Fig. 16.6). The fissure for the ligamentum teres divides the medial and lateral segments of the left liver and corresponds to the line of the left hepatic vein. The anterior and posterior sectors of the right lobe are subdivided into inferior (V and VI) and superior (VIII and VII) segments. The right portal vein runs horizontally as it enters the right liver, and this level demarcates the anterior and posterior sectors.
Vascular Anatomy
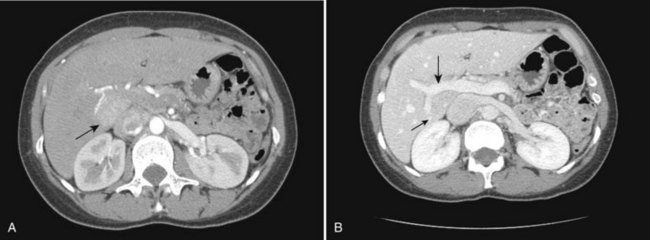
In classic arterial anatomy (see Chapter 1B), the celiac axis gives rise to the common hepatic artery, which bifurcates into the proper hepatic artery and the gastroduodenal artery (see Fig. 16.3). The proper hepatic artery divides into the right and left branches before entering the liver, but the point at which the proper hepatic artery gives rise to the left and right hepatic arteries varies. Although classic arterial anatomy is the most common pattern seen, variant hepatic and celiac arterial anatomy has been reported in 55% of patients based on initial cadaveric dissections by Michels (1955). Many of these variants have significance for preoperative planning and surgical management. Preoperative knowledge of variant anatomy can assist in selection of treatment options and in surgical planning, and it facilitates surgical dissection and may help avoid iatrogenic injury (Figs. 16.17 and 16.18).
The portal vein originates at the junction of the splenic vein (SV) and superior mesenteric vein (SMV), immediately posterior to the neck of the pancreas. It courses toward the right and cephalad, as it enters the hepatoduodenal ligament. Within this ligament, the portal vein courses parallel to the proper hepatic artery, which lies on its anteromedial surface, and the common bile duct, which lies on its anterolateral surface. After entering the hepatic parenchyma, the portal vein branches to supply each portal sector (see Fig. 16.1A) and subsequently each segment. A spectrum of portal venous variants has been described, many of which have major implications for safe and efficacious hepatic resection and percutaneous hepatobiliary intervention. Covey and colleagues (2004) reported the presence of variant portal venous anatomy in 35% of a group of 200 patients studied. CT is ideally suited to display these variants, an awareness of which may help avoid iatrogenic injury (Fig. 16.19).
The hepatic veins course between the hepatic sectors and have a short extrahepatic course before joining the IVC (Blumgart et al, 2001). The right hepatic vein drains directly into the IVC, and the middle hepatic vein and left hepatic vein usually join before draining into the IVC. A variable number of retrohepatic veins drain from the posterior aspect of the liver into the IVC, and a large inferior right hepatic vein, referred to as an accessory right hepatic vein, may be present in some patients (see Fig. 16.1B).
Biliary Anatomy
The intrahepatic biliary tree branches in a fashion nearly identical to the portal system (Fig. 16.20; see Chapter 1B). The left and right hepatic ducts form the common hepatic duct, near the lateral margin of the main portal vein, near its junction with the right portal vein. The common hepatic duct continues inferiorly toward the left and posteriorly, and it maintains its anterolateral position with respect to the portal vein throughout its course within the hepatoduodenal ligament. It becomes retroperitoneal at the level of the head of the pancreas and occupies a position on the posterolateral surface of the pancreas, until it joins the pancreatic duct immediately before entering the ampulla of Vater. The confluence of the right and left hepatic ducts is often seen lying anterior to the portal venous confluence.
Visualization of the intrahepatic bile ducts with CT originally was considered to be evidence of biliary obstruction; but with newer scanners and thin collimation, peripheral bile ducts measuring 1 to 3 mm may be seen in normal subjects (Liddell et al, 1990). The common duct, which measures 3 to 6 mm in cross-sectional diameter, is seen as a circular structure of near-water density posterolateral to the head of the pancreas on a postcontrast scan. The CT diagnosis of biliary obstruction is based on the demonstration of dilated intrahepatic or extrahepatic bile ducts. Dilated intrahepatic ducts appear on CT as linear branching or circular structures of near-water density that enlarge as they approach the junction of the left and right hepatic ducts in the porta hepatis. The extrahepatic bile duct is considered unequivocally dilated if it is 9 mm or more in diameter; less than 7 mm is considered normal. High-resolution images and reformatting techniques allow for depiction of the biliary tree on CT that was once impossible (Fig. 16.21).
Benign Tumors and Tumorlike Conditions of the Liver
Cyst (See Chapter 69A, Chapter 69B, Chapter 79A, Chapter 79B )
Hepatic cysts are common and occurr in 2% to 7% of the population (Horton et al, 1999). Hepatic cysts may be either congenital or acquired. Congenital cysts are more common and are thought to be caused by a malformation of a bile duct that has lost its communication with the remainder of the biliary tree. Lined by a single layer of cuboidal or columnar epithelium that secretes fluid, the cyst fills with serous fluid (Blumgart et al, 2001). The acquired type of hepatic cyst is usually secondary to inflammation, trauma, or parasitic disease. Hepatic cysts typically are discovered incidentally and have no malignant potential.
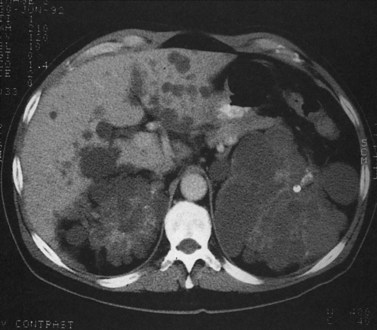
At CT, a hepatic cyst is round or ovoid and sharply defined with an imperceptible wall; it shows water attenuation and does not enhance after administration of an intravenous contrast agent. Although small cysts do not affect the adjacent hepatic parenchyma, very large cysts may result in lobar atrophy with contralateral compensatory hypertrophy (Blumgart et al, 2001).
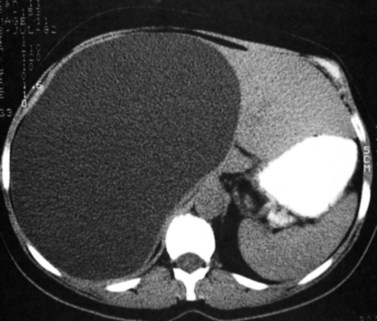
Multiple hepatic cysts may be associated with polycystic renal disease (Fig. 16.22) but may occur in the absence of renal cysts. Occasionally, patients may present with discomfort or biliary obstruction secondary to a large cyst (Fig. 16.23). In such cases, therapeutic intervention may be indicated.
Hemangioma
Hemangiomas (see Chapter 79A, Chapter 79B ) are the most benign solid tumors of the liver (Blumgart et al, 2001). The incidence of cavernous hemangiomata has been reported as 7% in an autopsy series (Karhunen, 1986). Cavernous hemangiomata may range in size from less than 1 cm to greater than 40 cm, referred to as giant hemangiomata (Blumgart et al, 2001). Hemangiomata usually are incidentally detected lesions seen in women (Horton et al, 1999).
Hemangiomata are composed of endothelium-lined vascular spaces separated by fibrous septa, and they derive their blood supply from the hepatic artery (Horton et al, 1999). On unenhanced CT, a hemangioma has low attenuation compared with the adjacent hepatic parenchyma. After the intravenous administration of contrast material, peripheral globular enhancement is seen on the arterial phase images. The attenuation of the peripheral nodules equals that of the aorta (Quinn & Benjamin, 1992), and venous phase images reveal centripetal enhancement to the center of the lesion (Leslie et al, 1995; Nelson & Chezmar, 1990). Because the peripheral, nodular, clumplike enhancement is seen best on arterial phase images, it is important to acquire images during this phase (Fig. 16.24).
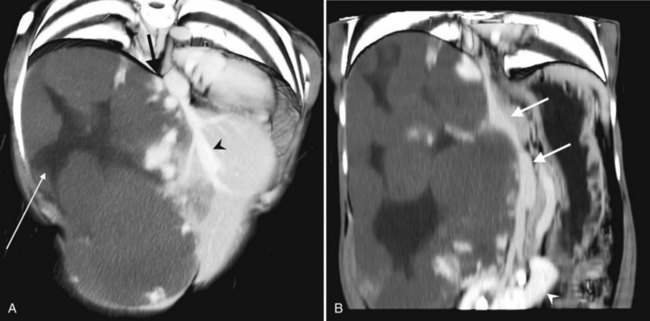
Giant hemangiomata (>6 to 10 cm; Bouras et al, 1996; Mitsudo et al, 1995; Ros et al, 1987) have a heterogeneous appearance with a low-attenuation central scar on unenhanced CT. The low attenuation is attributed to thrombosis, hyalinization, and fibrosis (Ros et al, 1987). The typical early, peripheral, nodular, clumplike enhancement is observed on the arterial phase images, but giant hemangiomata often do not completely fill in with contrast material on delayed images (Fig. 16.25; Vilgrain et al, 2000).
Most hemangiomata do not cause clinical symptoms. However, larger tumors are more likely to cause symptoms such as abdominal pain, increasing abdominal girth, early satiety, and nausea and vomiting (Blumgart et al, 2001). These symptoms are attributed to the rapid expansion of the tumor or thrombosis and infarction resulting in stretching or inflammation of the Glisson capsule (Blumgart et al, 2001). Large hemangiomata can lead to complications such as an inflammatory process manifested by low-grade fever, weight loss, abdominal pain, and elevated erythrocyte sedimentation rate (Takayasu et al, 1990). Other complications include Kasabach-Merritt syndrome, a coagulopathy with systemic fibrinolysis and thrombocytopenia (Maceyko & Camisa, 1991), intratumoral hemorrhage, spontaneous rupture resulting in hemoperitoneum (Vilgrain et al, 2000), and volvulus of a pedunculated hemangioma (Tran-Minh et al, 1991). Pain or secondary complications may necessitate surgical intervention. CT angiography can play an important role in delineating the arterial supply to these tumors, facilitating surgical enucleation or hepatic resection.
Focal Nodular Hyperplasia
FNH (see Chapter 79A, Chapter 79B ) is the second most common benign liver tumor, with a reported prevalence ranging from 0.9% (Nguyen et al, 1999) to 3% (Karhunen, 1986). FNH usually is incidentally detected when patients are scanned for other reasons (Carlson et al, 2000). With the increased use of CT and faster scan protocols, FNH is being detected more frequently (Carlson et al, 2000). FNH is more commonly seen in women, and it occurs in relatively young patients (Nguyen et al, 1999). At histopathologic analysis, classic FNH contains nodular hyperplastic parenchyma that is at least partially surrounded by fibrous septa and a central scar. The central scar contains fibrous connective tissue, cholangiolar proliferation with surrounding inflammatory infiltrates, and malformed vessels (Nguyen et al, 1999; Wanless et al, 1985).
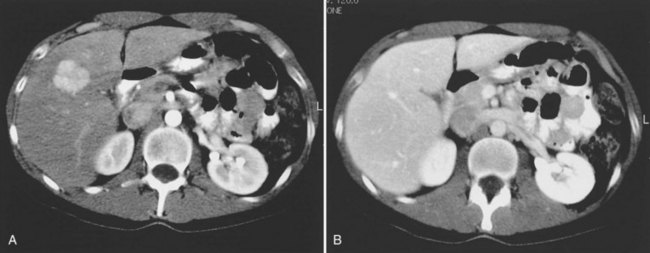
On unenhanced CT, FNH has the same or slightly lower attenuation than the liver. When FNH has the same attenuation as the liver, the lesion may be invisible or may be detectable only because of the central, low-attenuation scar or mass effect on the adjacent structures (Carlson et al, 2000). The value of unenhanced images is to ensure the absence of intralesional hemorrhage, intratumoral fat, and calcifications, findings atypical of FNH (Carlson et al, 2000). During the early phases (arterial, early portal venous), the typical pattern of FNH is diffuse, immediate, homogeneous, hyperdense contrast enhancement. The prompt, diffuse arterial enhancement is due to the rich arterial supply. Rapid washout of contrast material is seen in the late portal venous phase and on delayed images, as lesions tend to become isodense to the liver on these views (Figs. 16.26 and 16.27; Carlson et al, 2000).
A central scar is thought to be present at histopathology in almost all cases of FNH, but on CT, scars are less frequently visualized, seen in approximately one third of patients (Shamsi et al, 1993; Welch et al, 1985). The central scar is usually hypodense to the liver on unenhanced and early contrast-enhanced images, and it displays gradual fill-in on the portal venous phase and delayed images owing to diffusion of contrast material into the myxomatous stroma.
Adenoma
Hepatic adenoma (see Chapter 79A, Chapter 79B ) is an uncommon benign neoplasm usually discovered in women. A causative link has been described between the use of oral contraceptives and the development of hepatic adenomas (Blumgart et al, 2001). Other risk factors for the development of this neoplasm are androgen-containing steroids (Soe et al, 1992) and type I glycogen storage disease (Labrune et al, 1997). Adenomas are usually solitary but may be multiple in 30% of patients (Foster & Berman, 1977). A distinct entity referred to as liver adenomatosis, a term coined in 1985, refers to multiple (>10) adenomas in a patient without other known risk factors (Flejou et al, 1985).
Adenomas contain large plates of hepatocytes separated by dilated sinusoids perfused solely by peripheral arterial feeding vessels (adenomas lack a portal venous supply) under arterial pressure. Adenomas have poor connective tissue support, and the combination of poor connective tissue support and arterial pressure predisposes to hemorrhage. Multiple and large adenomas are more prone to spontaneous hemorrhage (Leese et al, 1988). Intracellular and intercellular lipids manifest as macroscopic fat within the tumor (Ichikawa et al, 2000).
The imaging appearance of adenomas parallels the histopathologic appearance. Unenhanced CT may be valuable in detecting the presence of intralesional hemorrhage or fat. Calcifications have been reported in 10% of lesions (Grazioli et al, 2000, 2001). Adenomas tend to be isoattenuating relative to normal liver on unenhanced CT and on portal venous phase images. Small adenomas usually enhance homogeneously in the arterial phase and are hyperattenuating to the liver (Grazioli et al, 2001). Larger adenomas are more heterogeneous in appearance than smaller lesions (Grazioli et al, 2001), presumably because of the presence of acute or prior hemorrhage. Peripheral enhancement reflects the presence of large subcapsular feeding vessels, with a resultant centripetal pattern of enhancement.
Biliary Hamartoma
Bile duct hamartoma (see Chapter 79A, Chapter 79B ), also known as von Meyenburg complex, is a common benign tumor composed of disorganized bile ducts and ductules with a fibrocollagenous stroma (Horton et al, 1999). The tumors usually range from 1 to 15 mm, do not communicate with the biliary tree, and are scattered throughout the liver (Wei et al, 1997). Bile duct hamartomas may be single, although they are often multiple (Blumgart et al, 2001), and they have a nonspecific imaging appearance such that they may be mistaken for metastases or microabscesses (Eisenberg et al, 1986; Lev-Toaff et al, 1995; Sada & Ramakrishna, 1994).
Bile Duct Adenoma
Bile duct adenomas are usually incidentally detected, benign, asymptomatic lesions (Welch et al, 1985). Bile duct adenomas are usually solitary and subcapsular, ranging in size from 1 mm to 1 cm. On unenhanced CT, a bile duct adenoma appears as a well-defined hypoattenuating or isoattenuating mass. Usually, little or no enhancement is seen after contrast administration. There is no specific imaging finding, however, and definitive diagnosis can be made only at histologic analysis (Horton et al, 1999).
Inflammatory Conditions
Pyogenic Abscess
Recent surgery, biliary disease, diverticulitis, Crohn disease, and alcoholism all predispose to pyogenic hepatic abscess (see Chapter 66), commonly caused by Clostridium species and gram-negative bacteria such as Escherichia coli and Bacteroides, which enter the liver via the biliary tree or portal venous system (Mergo & Ros, 1997). Ascending cholangitis and portal phlebitis are the most common causes of pyogenic hepatic abscesses (Murphy et al, 1989).
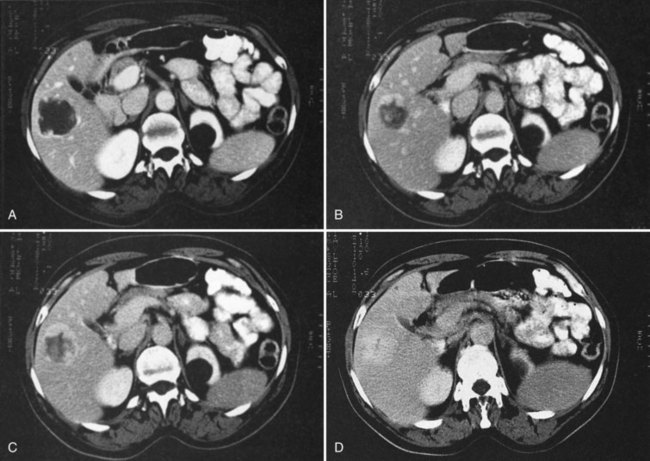
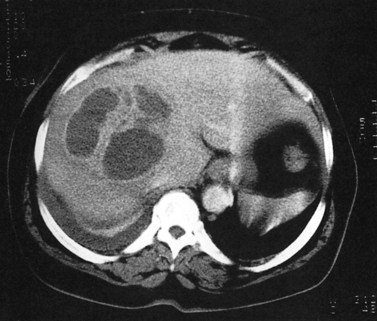
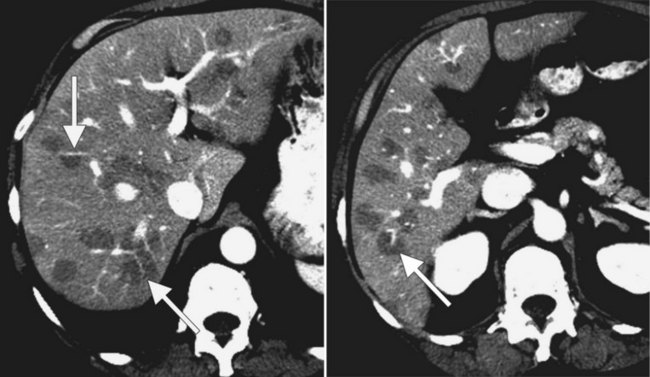
As a result of the widespread use of broad-spectrum antibiotics, the clinical presentation and CT appearance vary widely (Halvorsen et al, 1984). Pyogenic hepatic abscesses may be classified as either microabscesses (<2 cm) or macroabscesses, larger confluent lesions. Microabscesses appear as small, well-defined, hypodense lesions on contrast-enhanced CT. They may be widely scattered or clustered with a tendency to coalesce (Jeffrey et al, 1988). Larger pyogenic abscesses range in appearance from unilocular cavities with smooth outer margins to highly complex and septated structures with internal debris and irregular contours. Most large pyogenic abscesses appear as a well-defined mass of low attenuation on unenhanced CT. The attenuation value of the abscess cavity depends on the age of the abscess; it becomes lower as the abscess matures. Gas bubbles may be seen if anaerobic bacteria are present, and the periphery and internal septa may enhance after contrast agent administration. Abscesses often have a thick wall, which enhances with contrast administration (Fig. 16.28). In addition, there may be hepatic enhancement peripheral to the enhancing wall, secondary to increased capillary permeability. This is referred to as the double-target sign (Mendez et al, 1994; Murphy et al, 1989).
Fungal Abscesses
Fungal hepatic abscesses generally are disseminated microabscesses that occur in immunosuppressed patients. The most common fungal organism implicated is Candida albicans. Other fungal infections that cause microabscesses include cryptococcus, histoplasmosis, and mucormycosis. With contrast-enhanced CT, hepatic microabscesses appear as small, hypodense lesions ranging from several millimeters to 1.5 cm in size. A bull’s-eye appearance may be identified, with a small, high-attenuation focus centrally surrounded by a low-attenuation zone. Authors have reported significant increase in the sensitivity and lesion conspicuity using arterial phase CT, compared with portal venous phase CT, when evaluating liver lesions in immunocompromised patients suspected to have hepatosplenic fungal infections (Metser et al, 2005).
Echinococcus
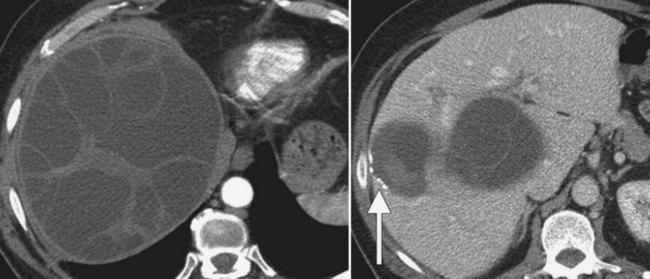
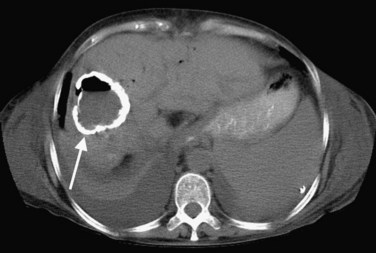
In endemic areas, involvement of the liver by hydatid disease is a common finding. Echinococcus granulosus (see Chapter 68) presents with a large solitary mass or multiple well-defined cystic lesions, which often contain internal “daughter” cysts (Fig. 16.29). Coarse calcifications of the wall are present in 50% of patients (Fig. 16.30), and daughter cysts are identified in approximately 75% (de Diego Choliz et al, 1982; Murphy et al, 1989). Communication between the cysts and the biliary tree is found in approximately 25% of patients (de Diego Choliz et al, 1982), and frank rupture of cyst contents into the bile ducts occurs in 5% to 10%, accompanied by clinical features of cholangitis. In contrast, Echinococcus alveolaris infection resembles an infiltrating hepatic tumor clinically and radiographically with its irregular margins and heterogeneous density (Didier et al, 1985).
Amebic Abscess (See Chapter 67)
The protozoan Entamoeba histolytica infects 10% of the world’s population. Hepatic abscess is the most common extraintestinal complication of amebiasis and occurs in approximately 8.5% of all patients with amebic infection (Ralls, 1998). On CT, amebic abscesses appear as well-defined masses of near-water attenuation with a thick enhancing rim. One or more internal septations may be present. A feature of amebic liver abscess that may aid in distinguishing it from other focal hepatic lesions is its tendency to extend beyond the surface of the liver (Radin et al, 1988). The CT findings are not specific, however, and serologic tests are necessary to confirm the diagnosis.
Diffuse Hepatocellular Diseases
Fatty Infiltration
Fatty infiltration (see Chapter 65), as seen in patients on chemotherapy or in patients with systemic disorders, such as diabetes mellitus, cystic fibrosis, or malnourishment, results in a decrease in hepatic density. Mild degrees of fatty change may be subtle, unless liver density is compared carefully with the density of the spleen. The liver is normally 6 to 12 HU higher in attenuation than the spleen, and reversal of this relationship is the earliest CT indication of fatty infiltration. With more advanced changes, the hepatic parenchyma becomes less dense than the intrahepatic vessels. In most instances, fatty infiltration is diffuse and uniform (see Fig. 16.12), but a nonuniform, focal distribution also can occur and occasionally may mimic a mass (Fig. 16.31). Fatty infiltration should be suspected if blood vessels can be seen passing through the focal area in a normal pattern (Fig. 16.32).
An awareness of the common locations of focal fatty infiltration and focal fatty sparing is important, so as not to mistake these for tumor. Common locations for focal fatty infiltration include segment IV adjacent to the falciform ligament (Ohashi et al, 1995; Paulson et al, 1993) and around the gallbladder (Yoshimitsu et al, 1997). A common location for focal fatty sparing is in the posterior aspect of segment IV (Matsui et al, 1995; White et al, 1987) or along the gallbladder fossa. It has been suggested that areas of focal fatty sparing are due to aberrant venous drainage to the liver, because these areas do not receive portal venous flow from the main portal trunk (Gabata et al, 1997; Marchal et al, 1986; Matsui et al, 1995).
It has been shown that focal fatty sparing in a fatty infiltrated liver may occur secondary to a mass. This occurrence is presumably due to regionally decreased portal blood flow caused by compression of the adjacent portal venous branch distal to a mass. This fatty sparing can appear as wedge shaped, peripheral, segmental, or lobar, depending on the site of the portal venous compression (Grossholz et al, 1998).
Assessment for fatty infiltration is better performed with unenhanced CT than with contrast-enhanced CT, because factors such as the rate of contrast injection and timing of measurements significantly influence the optimal liver-to-spleen ratio threshold for diagnosing fatty liver. The required ratios are protocol specific, which limits the clinical usefulness of such measurements (Jacobs et al, 1998; Johnston et al, 1998). If it is unclear based on the CT findings whether an area of focal low attenuation represents a mass, magnetic resonance imaging (MRI) using opposed-phase gradient echo images may make a definitive diagnosis.
Cirrhosis (See Chapter 70A, Chapter 70B )
CT is capable of showing morphologic changes associated with advanced hepatic cirrhosis. Typical CT features are a nodular hepatic outline (in macronodular cirrhosis) caused by regenerative nodules of variable size, bands or regions of confluent fibrosis, relative atrophy of the right hepatic and quadrate lobes, and hypertrophy of the left lateral segment and caudate lobe (Fig. 16.33; Torres et al, 1986). Measurement of the transverse dimension of the caudate lobe compared with the adjacent right lobe provides an index of right hepatic lobe shrinkage and a relatively specific morphologic measurement of hepatic cirrhosis (Harbin et al, 1980). A caudate/right lobe ratio greater than 0.65, using the bifurcation of the main portal vein to divide the lobes provides 96% confidence in the diagnosis of cirrhosis. An MRI study suggested that using the right portal vein to set the lateral boundary of the caudate lobe when assessing the caudate/right lobe ratio was more accurate for diagnosing cirrhosis than using the main portal vein (Awaya et al, 2002). Evidence of coexistent portal hypertension is found with ascites, splenomegaly, and portal-systemic varices. MDCT combined with three-dimensional reformatting can help determine the extent of portosystemic collateral vessels, such as the left gastric vein, short gastric vein, esophageal and paraesophageal varices, splenorenal and gastrorenal shunts, and paraumbilical and abdominal wall veins (Kang et al, 2002).
Budd-Chiari Syndrome
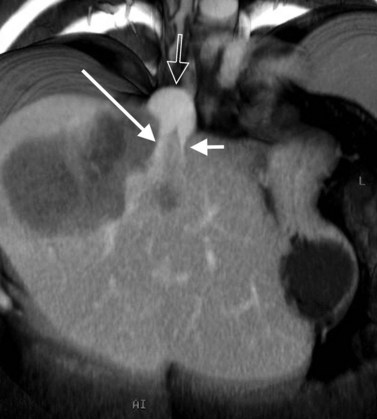
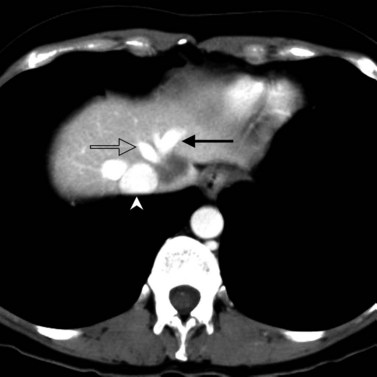
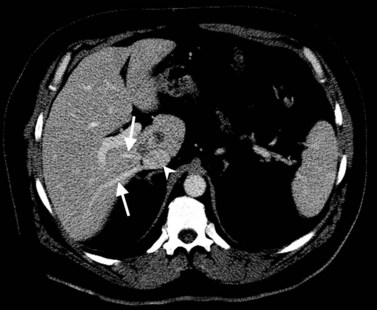
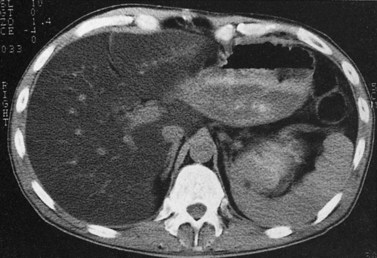
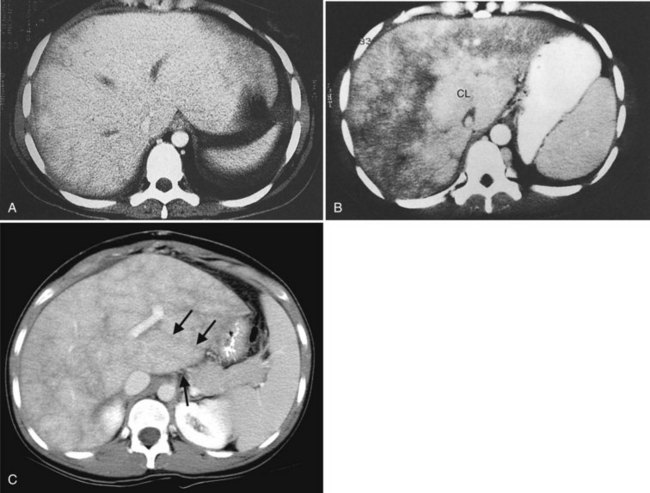
Budd-Chiari syndrome (see Chapter 77) is caused by chronic hepatic venous congestion secondary to obstruction to hepatic venous outflow. The CT appearance is characterized by hepatomegaly and ascites; the hepatic veins are either obliterated and not seen, or they contain thrombus (Fig. 16.34). Precontrast scans show decreased attenuation of hepatic parenchyma because of congestion; postcontrast scans show normal enhancement of the caudate lobe, which is hypertrophied in chronic cases, and patchy enhancement of the remainder of the liver (Vogelzang et al, 1987). Concomitant portal vein thrombosis is present in 20% of patients with Budd-Chiari syndrome. A similar CT appearance of the liver, with patchy enhancement, is seen in patients with congestive heart failure; in contrast to patients with true Budd-Chiari syndrome, these patients have patent and enlarged hepatic veins (Moulton et al, 1988).

