Essentials of Diagnosis
General Considerations
In patients with chronic kidney disease (CKD), as the glomerular filtration rate (GFR) declines, numerous nutritional and metabolic disorders develop, and the dietary requirements for many nutrients are altered. These disorders and alterations include (1) diminished appetite or anorexia; (2) abnormalities in intestinal absorption of certain minerals (eg, calcium) and other nutrients including some trace elements (eg, iron and possibly zinc) and vitamins (eg, riboflavin); (3) abnormalities in urinary, intestinal, and dermal excretion of nutrients; and (4) disorders of nutrient metabolism.
Patients with renal insufficiency also are prone to accumulate toxins that normally are eaten in small amounts and would readily be excreted by the kidneys, such as aluminum. There are alterations in the concentrations and/or composition of certain lipoproteins, with an abnormal proportion of individual lipids and altered structure of some apolipoproteins. Potentially toxic oxidants and reactive carbonyl compounds accumulate in plasma and tissues. Deficiencies of antioxidants, including vitamins C and E and possibly selenium, may increase oxidative stress. Oxidative stress, along with the occurrence of inflammation in renal insufficiency, increases the risk of endothelial injury and atherosclerosis, leading to cardiovascular disease and higher death rates usually observed in patients with advanced CKD.
Pathogenesis
Patients with advanced CKD (stages 4 and 5) frequently suffer from protein–energy malnutrition. Protein–energy malnutrition is defined as a state of decreased body protein mass with or without fat depletion or a state of diminished functional capacity due to protein–energy depletion, which is usually caused at least partly by inadequate nutrient intake relative to nutrient demand and/or which is improved by nutritional repletion. In CKD, several conditions may contribute to protein–energy malnutrition or wasting. Because these conditions may be caused by factors in addition to inadequate nutrient intake, the term “wasting” (or protein–energy wasting) can also be used instead of protein–energy malnutrition. It is important to recognize that in advanced chronic renal insufficiency (CRI), ie, stages 4–5 CKD, there are other types of wasting or malnutrition. This is particularly likely to occur for calcium, iron, zinc, and vitamins C, B6, folic acid, and 1,25-dihydroxycholecalciferol.
Approximately one-third to one-half of patients with advanced CKD including those undergoing maintenance dialysis have mild to moderate malnutrition and 5–10% more have severe malnutrition. In malnourished CKD patients, decreased relative body weight or body mass index (BMI, body weight (kg) divided by the square of body height in meters2), skinfold thickness (an estimate of body fat), arm muscle diameter area (a reflection of muscle mass), total body nitrogen and potassium, and increased total body water and extracellular water (Table 21–1) are usually observed. Malnutrition is also manifested by decreased concentrations of many serum proteins including albumin, prealbumin, and transferrin. Serum lipoprotein concentrations including total cholesterol may also be reduced. Low growth rates are observed in children with advanced CKD. Increased levels of proinflammatory cytokines occur frequently.
Decreased food intake |
Low body weight (body mass index or standardized height for weight) |
Decreased total body fat percent and skinfold thickness |
Decreased muscle mass and arm circumference |
Low growth rate in children |
Decreased total body nitrogen |
Increased levels of acute phase proteins and proinflammatory cytokines |
Decreased levels of albumin, prealbumin, transferrin, and cholesterol |
Decreased levels of plasma amino acids |
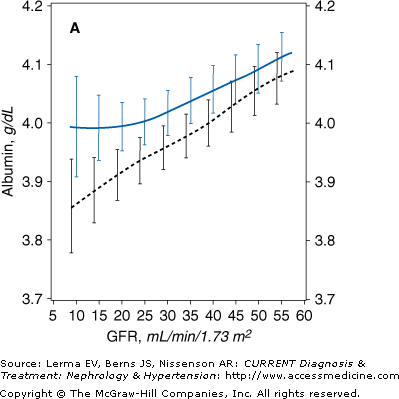
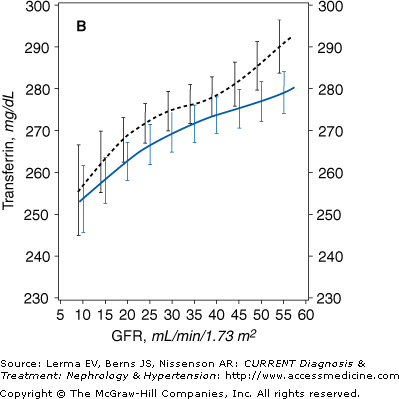
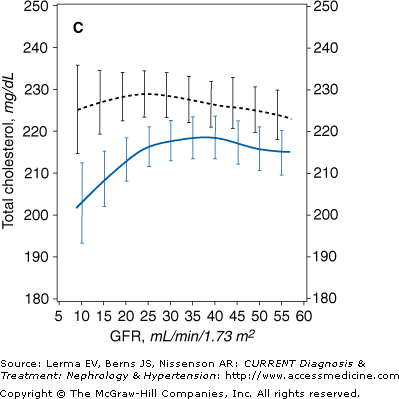
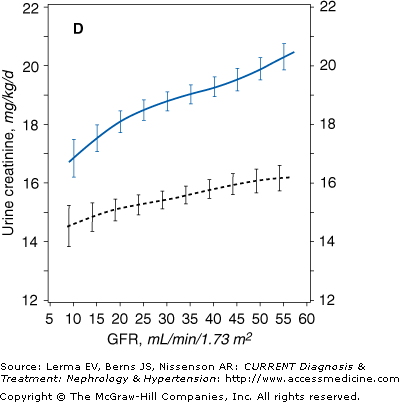
The Modification of Diet in Renal Disease (MDRD) Study indicated that the dietary protein and energy intake and the nutritional status begin to decline when the GFR is about 25–38 mL/minute/1.73 m2. In a cross-sectional analysis of the baseline data obtained in over 1700 individuals with stage 3–5 CKD, a gradual but persistent decline in serum transferrin and albumin concentrations (Figure 21–1), body weight, mid-arm muscle circumference, and percent body fat was observed parallel to the reduction in the GFR. Decreased energy intake was also observed when the GFR was reduced below about 25–35 mL/minute/1.73 m2.
Figure 21–1.
Mean levels of biochemical measures of nutritional status as a function of glomerular filtration rate (GFR) in the Modification of Diet in Renal Disease (MDRD) Study. The estimated mean levels with 95% confidence limits of biochemical nutritional markers are shown as a function of GFR (males, solid line; females, dashed line) controlling for age, race, and use of protein and energy–restricted diets. In men, the slope of the relationship was greater at GFR = 12 than GFR = 55 mL/minute/1.73 m2 for serum total cholesterol (p = 0.014). A: Males, N = 1065 (p = 0.004); females, N = 698 (p < 0.001). B: Males, N = 1065 (p < 0.001); females, N = 698 (p < 0.001). C: Males, N = 1063 (p = 0.052); females, N = 694 (p = 0.63). D: Males, N = 1017 (p < 0.001); females, N = 664 (p < 0.001). (Reprinted with permission from Kopple J et al: Relationship between nutritional status and the glomerular filtration rate: results from the MDRD Study. Kidney Int 2000;57:1688.)
Table 21–2 lists potential causes of malnutrition in chronic renal insufficiency.
|
Anorexia, a salient manifestation of CRI, worsens as CKD progresses and is thought to be engendered by uremic toxins. Levels of serum leptin, a hormone known to induce anorexia, are also elevated in uremia. Several studies describe an inverse relationship between serum leptin and dietary protein intake or a direct relationship between serum leptin and weight loss in patients on dialysis. Elevated serum leptin levels in CKD can be caused by impaired degradation by the diseased kidney and possibly also by insulin stimulation of leptin synthesis in CRI patients who are often hyperinsulinemic. Inflammation, which is commonly present in renal insufficiency, is associated with increased levels of proinflammatory cytokines, including interleukin-1 (IL-1), interleukin-6 (IL-6), and tumor necrosis factor α (TNF-α), each of which is known to induce anorexia.
Other reasons for inadequate food intake include the debilitating effects of renal failure and underlying illnesses (eg, diabetes mellitus, lupus erythematosus), the impact of the progressive illness on the patient’s ability to eat, and emotional disorders. Also, the fact that physicians and dietitians usually recommend a low protein diet for CKD patients plays a role. Moreover, imposing restrictions on intake of potassium and phosphorus may lead to nutrients that are less palatable to the patient and more difficult to prepare.
The dialysis procedure itself may promote wasting by removing nutrients. During routine hemodialysis there are losses of about 6–10 g of free amino acids when patients are postabsorptive (fasting) and about 8–10 g when they are postprandial. Approximately 2–3 g of peptides or bound amino acids is also removed. The use of high flux polysulfone hemodialyzers may lead to greater losses of amino acids. During peritoneal dialysis, about 2–3.5 g of free amino acids, 8–9 g of total protein, and 5–6 g of albumin are lost into the dialysate per day. With mild peritonitis, the quantity of protein removed increases to an average of 15 g/day. Peritoneal protein losses as high as 100 g/day have been reported in severe peritonitis. Protein losses fall rapidly with antibiotic therapy but may remain elevated for many days to weeks.
Water-soluble vitamins and other bioactive compounds are also removed by both hemodialysis and peritoneal dialysis. Although these vitamin losses can be theoretically replaced from the diet or by multivitamin supplementations, these measures may be suboptimal in patients with poor nutrient intake due to a myriad of clinical, social, or financial barriers.
Finally, many CRI patients often lose substantial quantities of blood secondary to occult gastrointestinal bleeding, frequent blood sampling for laboratory testing, and the sequestration of blood in the hemodialyzer. Since blood is rich in protein, these blood losses may contribute to additional protein wasting. For example, a person with a hemoglobin of 12 g/dL and a serum total protein of 7 g/dL will lose approximately 16.5 g of protein in each 100 mL of blood removed.
CKD patients usually suffer from additional concurrent comorbid conditions, which often induce a hypercatabolic state and also may physically prevent ingestion, gastrointestinal absorption, or assimilation of foods (eg, pancreatitis, gastrointestinal surgery). Hemodialysis per se can enhance net protein breakdown and promote negative nitrogen balance. More bioincompatible hemodialysis membranes, such as cuprophane, are more likely to stimulate the release of interleukins and promote net protein degradation than are more biocompatible membranes. The accumulation of endogenously formed uremic toxins might engender wasting more directly. In renal failure, there are increased plasma or tissue concentrations of probably hundreds of metabolic products. Some of these compounds are bioactive and may have catabolic or antianabolic actions.
Acidemia enhances decarboxylation of branched chain amino acids and engenders protein catabolism in skeletal muscle, bone reabsorption, and negative nitrogen balance. The endocrine disorders of uremia may also promote wasting. Resistance to the actions of insulin and insulin-like growth factor-1 and hyperglucagonemia may promote protein wasting. Parathyroid hormone increases hepatic gluconeogenesis, and may lead ultimately to protein wasting. The findings that 1,25-dihydroxycholecalciferol has pervasive effects on calcium metabolism, that vitamin D deficiency may cause a proximal myopathy, and that 25-hydroxycholecalciferol stimulates muscle protein synthesis in vitro suggest that deficiency of 1,25-dihydroxycholecalciferol might be another cause of muscle protein wasting.
Exogenously derived uremic toxins may cause debility (eg, aluminum) and possibly wasting. Finally, since the kidney synthesizes or degrades many biologically active compounds including certain amino acids, peptide hormones, other peptides, glucose, and fatty acids, it is possible that loss of these metabolic activities of the kidney in renal failure may disrupt the body’s metabolism and promote protein–energy wasting.
Advanced CKD and the dialysis treatment process may sustain inflammation and an associated acute phase response with elevation of serum acute phase proteins and reduction in negative acute phase proteins. Potential causes of inflammation in CKD patients are listed in Table 21–3. In patients on maintenance dialysis, indicators of inflammation are correlated with anorexia, wasting, and malnutrition. These findings, together with the known catabolic effects of some proinflammatory cytokines, have bolstered the conclusion that inflammation promotes wasting. With inflammation, serum concentrations of negative acute phase proteins decrease; these include albumin, transferrin, retinol binding protein, transthyretin (prealbumin), and certain lipoproteins. Most surveys suggest that the serum concentration of C-reactive protein (CRP), a marker of inflammation, is increased in about 30–50% of American and European patients on dialysis and perhaps in a lower proportion of Asian patients. It has been argued that these elevated cytokines may promote protein–energy wasting in CKD patients both by inducing anorexia and also by engendering protein catabolism, eg, by activation of proteolytic enzymes released from granulocytes, or by suppressing protein synthesis. Indeed, albumin synthesis is often suppressed when serum CRP is elevated.
Causes of inflammation due to CKD or decreased GFR
|
Coexistence of comorbid conditions
|
Additional inflammatory factors related to dialysis treatment Hemodialysis
|
Peritoneal dialysis
|
Both biocompatible as well as bioincompatible hemodialysis membranes, hemodialysis tubing and filters, both functioning and old thrombosed arteriovenous synthetic grafts, other vascular accesses and peritoneal dialysis catheters, hemodialysate and possibly peritoneal dialysate solutions, and low grade infections, such as caused by Chlamydia, may stimulate the inflammatory response in CKD patients by activating monocytes and/or macrophages. These inflammatory cells then release the cytokines (eg, IL-1, IL-6, and TNF-α) that stimulate the acute phase response. Finally, both oxidants and carbonyl compounds, as well as a deficiency of antioxidants, may cause tissue injury and inflammation and possibly engender a catabolic state.
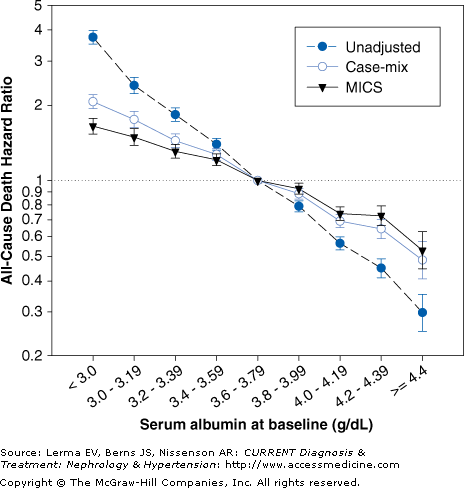
Nutritional status is a powerful predictor of morbidity and mortality and quality of life in CKD patients. Low dietary protein intake, decreased body weight for a given height such as BMI, and low serum concentrations of albumin, transthyretin, urea, creatinine, cholesterol, bicarbonate, and phosphorus are also associated with a higher death risk in patients on dialysis. Serum albumin is probably the strongest predictor of mortality in patients on maintenance dialysis (Figure 21–2). Some of these measurements such as daily protein intake [as determined by the normalized protein equivalent of total nitrogen appearance (nPNA)] and serum concentrations of cholesterol, phosphorus, and bicarbonate have a “J” or “U” curve relationship with mortality, in that both low and very high values are associated with a poor survival.
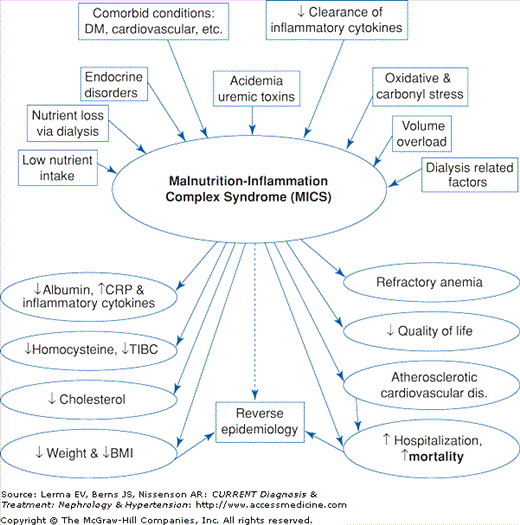
Since obesity and hypercholesterolemia are paradoxically associated with better survival and lower cardiovascular death in patients on maintenance dialysis, a reverse epidemiology of cardiovascular risk factors has been described. This phenomenon is believed to be mostly due to the overwhelming effect of malnutrition and inflammation, both of which are common in CRI. Indeed, according to some investigators, the strong association observed between malnutrition and mortality in CKD patients is the result of the atherogenetic role of inflammation. Because the causes and consequences of malnutrition and inflammation overlap considerably and many of the clinical manifestations of malnutrition and inflammation are identical, the term malnutrition–inflammation complex syndrome (MICS) has been suggested to indicate the close associations between malnutrition and inflammation in CKD patients and their link to clinical outcome (Figure 21–3).
The occurrence of measures indicating the presence of either malnutrition or inflammation in CKD patients or patients on maintenance dialysis has become of great concern to researchers and clinicians, because there is a strong association between the markers of MICS such as hypoalbuminemia, hypocholesterolemia, and underweight, and an increased risk of death. This issue is of particular importance because in patients on maintenance dialysis in the United States the mortality rate, especially due to cardiovascular disease, has remained inappropriately high, over 20% per year, and because traditional cardiovascular risk factors such as hypertension, hypercholesterolemia, and obesity not only do not appear to be associated with this high death risk, but paradoxically show a protective effect, ie, the reverse epidemiology. The time discrepancy between competing risk factors may play a role; it is possible that the deleterious effects associated with undernutrition can be manifested within a much shorter period of time when compared to the consequences of overnutrition, which usually requires a longer time to become manifest. According to this theory, many patients on dialysis may die prematurely of undernutrition before they can experience the cardiovascular consequences of overnutrition.
Clinical Findings
Classically, three major lines of inquiries, ie, dietary intake, biochemical measurements, and body composition, are used to assess the protein–energy nutritional status in CKD patients. Composite scores based on assessment measures within these categories are also utilized. These include subjective global assessment (SGA) of nutrition and malnutrition inflammation score (MIS). More technologically based nutritional measures that have been used in CKD patients include dual energy x-ray absorptiometry (DEXA), total body nitrogen or potassium measurements, underwater weighing, bioelectrical impedance analysis, and near infrared interactance. These four categories of nutritional assessment tools are described in Table 21–2. As indicated in Table 21–4, many of these also respond to inflammation and provide a measure of its severity. Hence, the overlap between malnutrition and inflammation exists both at the diagnostic and at the etiologic level. Currently, no uniform approach has been agreed upon for rating the severity of malnutrition in CRI patients.
Nutritional intake
|
Body composition
|
Scoring systems
|
Laboratory values
|
The National Kidney Foundation Kidney Disease Outcomes Quality Initiative (K/DOQI) Clinical Procedure Guidelines on Nutrition in Chronic Renal Disease and Renal Failure recommends that nondialyzed CKD patients with a GFR less than 20 mL/minute undergo periodic nutritional assessments by serial measurements of a panel of markers including at least one measure from each of the following clusters: (1) serum albumin, (2) edema-free actual body weight and % standard body weight, (3) SGA, and (4) the nPNA or dietary interviews and diaries.
In CKD patients dietary protein intake can be estimated by both dietary interviews and diaries and the nPNA, ie, protein equivalent of total nitrogen appearance normalized to the volume of distribution of urea or some other function of body mass; this measure is also known as the normalized protein catabolic rate (nPCR) in patients on dialysis. Since the control of protein intake is central to the nutritional management of patients with renal insufficiency, it is important to accurately monitor nitrogen intake.
A simple and practical method to evaluate the compliance of patient’s actual protein intake with the prescribed dietary protein intake is the following formula:
where UUN is urine urea nitrogen measured in a 24-hour urine collection. If the patient’s proteinuria is 5 g/day or higher, this quantity needs to be added to the estimated protein intake.
Different methods to slow the rate of progression of chronic renal insufficiency in CKD patients are discussed in Chapter 22. Low protein diets are one method. In recent years, three types of low nitrogen diets have primarily been used for the treatment of patients with CRI: (1) A low protein diet providing about 0.55–0.60 g protein/kg body weight/day; (2) a very low protein diet providing approximately 16–20 g/day of protein of miscellaneous quality (ie, about 0.28 g protein/kg/day) supplemented with about 10–20 g/day of the nine essential amino acids; and (3) a similar 16–20 g protein diet generally supplemented with four essential amino acids—histidine, lysine, threonine, and tryptophan—and the ketoacid or hydroxyacid analogs of the other five essential amino acids sometimes with a few other amino acids added.
Several meta-analyses indicate that low protein diets are effective is slowing the rate of progression of CKD to renal replacement therapy (maintenance dialysis or renal transplantation). On average, this effect, although clearcut, is not dramatic and often requires many months of treatment to become evident.
An unresolved issue is whether a low protein diet will retard the progression of renal failure in patients receiving angiotensin-converting enzyme inhibitors (ACEIs) and/or angiotensin receptor blockers (ARBs). Since dietary protein restriction exerts many of the same hemodynamic and other physiologic effects on the kidney as do ACEIs and ARBs, it is possible that the renal-protective effects of a low protein diet, when combined with ACEIs and ARBs, are replicative, rather than additive.
For CKD stages 1 and 2 (GFR >60 mL/minute) there is almost no information concerning the most desirable dietary protein and phosphorus prescription. Currently protein intake is usually not restricted for these patients except possibly to 0.80–1 g protein and 1200–1400 mg phosphorus/kg/day unless there is evidence that renal function is continuing to decline. Under these circumstances, the patient is treated as indicated below.
For CKD stage 3, low protein, low phosphorus diets may retard progression. A diet providing about 0.60–0.75 g protein/kg/day, of which at least 0.35 g/kg/day is high biologic value protein, is needed to ensure a sufficient intake of the essential amino acids.
Stay updated, free articles. Join our Telegram channel

Full access? Get Clinical Tree


