Owing to improved technology and the decline in peritonitis rates, ultrafiltration failure (UFF)/membrane failure has now become one of the major factors leading to technique failure in PD patients. Typically, alterations in peritoneal membrane function have a disproportionately greater effect on fluid removal than solute removal and therefore the most overwhelming cases of membrane failure are due to inability to achieve adequate ultrafiltration (UF), whereas the inability to achieve adequate solute removal is relatively uncommon. In most patients maintained on PD for 4 or more years, peritoneal clearance of small solutes is stable or increases, whereas net UF has been shown to decrease by as much as 40% from baseline (3–5).
Although UFF can occur in any stage of PD, it develops over time, and is, therefore, especially important in long-term PD. The exact prevalence of UFF in patients treated with PD is not known. Heimbürger et al. (6) demonstrated the cumulative risk for permanent loss of net UF capacity to be 2.6% at 1 year, 9.5% at 3 years, and in excess of 30% for those patients on continuous ambulatory peritoneal dialysis (CAPD) for 6 years or more. Similarly, in a Japanese long-term study, dropout because of UFF was as high as 51% after 6 years (7). Over an 18-month period, Davies et al. (8) observed UFF in 14% of their patients. Inadequate dialysis including UFF was responsible for transfer to HD in 18% of the patients in one series, whereas infection was responsible for 28% of the transfers (9). All the studies were based on clinical signs of UFF and not on a standardized test.
The definition of UFF had been under discussion over the past years. Some applied a clinical definition: the inability to remain at a certain dry weight and the use of more than two hypertonic (3.86%) bags per day had been considered as UFF (10–12). Others used a definition based on a standardized exchange and considered UFF to be present, for instance, when there was negative net UF with a 1.36% glucose dwell (13,14). In 2000, the International Society for Peritoneal Dialysis (ISPD) committee on UFF advised performing a standardized test with 3.86% glucose and considered a net UF of less than 400 mL after a 4-hour dwell as UFF (15). A cross-sectional study in a small number of PD patients, using the 400 mL/4 h on 3.86% glucose definition, reported a prevalence of 23% (14). Smit et al. (16) reported prevalence of 36% in 55 patients after a median period of 61 months.
Although the inability to achieve adequate solute and fluid removal is often attributed to a “failure” of the peritoneal membrane, it must be remembered that this is but one of several factors that affect the efficiency of PD (TABLE 13.1). It is therefore critical that nephrologists consider and understand these issues when evaluating patients with signs and symptoms of UFF. In this chapter, we review the factors that influence UF efficiency and present an approach to evaluating and treating these patients in clinical practice.
 SOLUTE AND FLUID TRANSPORT IN PERITONEAL DIALYSIS
The Peritoneal Membrane
Solute and fluid transport in PD results from the development of concentration and pressure (hydrostatic and osmotic) gradients between blood and dialysate across the semipermeable peritoneal “membrane.” Therefore, the physical characteristics (surface area and permeability) of the peritoneal membrane become major determinants in solute and fluid transport. The physical features of HD membranes are known by design; however, these properties are unknown for the peritoneal membrane and have largely been determined indirectly based on conceptual models and mathematical analyses. From these efforts, our concept of the transport physiology of the peritoneal membrane is evolving.
Originally, peritoneal transport properties were based on a “membrane model” in which the peritoneum was simply viewed as a single membrane comprising capillary wall, interstitium, and mesothelium. In this model, a concentration gradient exists from the capillary lumen on one side of the membrane to the peritoneal cavity on the other (17). More recently, the concept of a “distributed model” was proposed to better explain the observed transport properties of the peritoneum. Here, the capillaries are viewed as “distributed” throughout the interstitium, resulting in varying distances between capillary lumens and the peritoneal cavity (18). The contribution of a given capillary depends on the proximity of that capillary to the dialysate interface.
The “anatomic” surface area of the peritoneal membrane correlates best with body surface area (BSA) and is estimated to range from 1.7 to 2.0 m2 (19). However, it is the “effective” surface area of the peritoneal membrane that is important in determining solute and fluid transport in PD. The effective peritoneal surface area is defined as that area of peritoneal membrane perfused by capillaries that comes into contact with dialysate and contributes to solute and fluid transport (20–22). The effective peritoneal surface area therefore depends not only on the volume of dialysate used but also on the effective peritoneal blood flow (that portion of the peritoneal microcirculation that actually comes into contact with dialysate and participates in solute and fluid transport). The largest portion (47%) of the overall small solute diffusive transport is across the peritoneal membrane associated with hollow viscera. However, as much as 43% of diffusive transport during PD occurs across the peritoneum associated with the liver (abdominal wall 6% and diaphragm 4%) (23).
The permeability of the peritoneal membrane is determined by the resistances created by the capillary wall, interstitium, and mesothelium. Of these, the capillary wall is the most important and the mesothelium the least important as barriers to transport. On the basis of the three-pore model of the peritoneal membrane, initially derived from a computer model for peritoneal transport mechanisms, solute and water transport occurs through three different pore types located in the capillary endothelium (24). “Large pores” are believed to correspond to interendothelial gaps (radius 12 to 15 nm) and are responsible for transport of macromolecules (e.g., albumin) across the membrane. Large pores account for less than 1% of the effective pore area for small solute diffusion, and, to a minor extent, they account for UF through fluid convection. “Small pores” (radius 4 nm) represent intercellular endothelial clefts and account for approximately 90% of total pore area. They are the primary route for the diffusive and convective transport of small molecular weight solutes (e.g., urea, creatinine, and electrolytes). More than 50% of glucose-induced UF occurs through small pores. It is through back diffusion across these pores that glucose absorption from the peritoneal cavity also occurs. However, small pores are essentially impermeable to macromolecules such as proteins. The third pore type is a water-selective, intracellular, so-called ultrasmall pore (radius less than 0.5 nm). The “ultrasmall pore” is the only pore type that is molecularly defined and corresponds to aquaporin 1 (AQP-1). The AQP-1 channel is located in endothelial and mesothelial cells (MCs) of the peritoneal wall. Although these pores comprise only 1% to 2% of the total pore area, they contribute up to 40% of the ultrafiltrate (25). Because the ultrafiltrate generated by the ultrasmall pores is solute-free, the concentration of solutes in the ultrafiltrate is less than that in the plasma, a phenomenon called solute sieving, usually referred as sodium sieving (see section “Convective Transport” in subsequent text).
Although the three-pore model has proven successful for modeling purposes in several physiologic and pathophysiologic conditions and for various osmotic agents, it does not take into account of the distributed nature of the peritoneal capillaries and also of the influence of the peritoneal tissue interstitium as explained in the distributed model (18). The pore-matrix model explains the complex nature of distributed peritoneal barrier by incorporating the concepts from these two models (26). As mentioned in three-pore model, small and large pores have not been found to be distinct anatomic entity. Rather, these are interendothelial spaces filled with a luminal glycocalyx that restricts passage of solutes and sets up alternative pressure forces. Large pores have a very sparse glycocalyx that permits transport of macromolecules, while small pores have a denser glycocalyx that are more restrictive. In addition to the aquaporins and glycocalyx-filled pores, the integrated cellular-interstitial matrix also makes the peritoneal barrier. According to this model, the distributed geometry of the capillary bed yields a substantial decrease in the effective reflection coefficient for crystalloid osmotic agents compared with their reflection coefficient in the capillary wall.
Solute Transport
Diffusive Transport
In PD, solute removal results from a combination of diffusive and convective transport. Diffusion, the primary mechanism for small solute removal, results from the concentration gradient between blood and dialysate created across the peritoneal membrane by the instillation of dialysate into the peritoneal cavity. The rate of diffusion for a solute (Js) depends on the product of the peritoneal membrane solute permeability (Ps), effective peritoneal surface area (A), and the magnitude of the plasma to dialysate concentration (DC) gradient for that solute (EQUATION 13.1):
The intrinsic permeability of the peritoneal membrane for a given solute is relatively constant and is determined by its molecular weight. The peritoneal membrane is therefore highly permeable to low molecular weight solutes such as urea and creatinine but has a low permeability to high molecular weight solutes such as β2-microglobulin and other large proteins.
Increasing the effective peritoneal surface area, by increasing the intraperitoneal volume of dialysate, can significantly improve the rate of diffusive transport for small solutes (FIGURE 13.1) (4). Keshaviah et al. (27) demonstrated that transport rates for urea, creatinine, and glucose doubled as infused volumes of dialysate were increased from 0.5 to 2.5 L. The infused volume producing the maximal diffusive transport rate for a given patient increased with increasing BSA, being 2.5 L for an average-sized person (BSA 1.7 m2) and 3 to 3.5 L for a person with a BSA of more than 2 m2. The improved transport with larger volumes is felt to result from an increase in contact between dialysate and peritoneum, thereby increasing the effective peritoneal surface area by recruiting more peritoneal membrane. Beyond these maximal volumes, little to no improvement in diffusive transport is attained as the effective peritoneal surface area is completely exposed to dialysate and any further increases in volume results in “pooling” of dialysate.
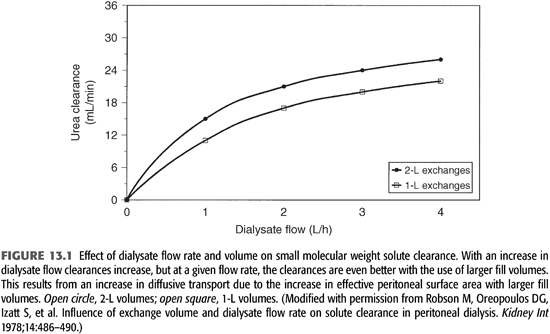
Maintaining a maximal concentration gradient also enhances the rate of diffusive transport. This is dependent on the effective peritoneal blood flow as well as dialysate flow. The concentration gradient (ΔC) across the peritoneum is maximal early in the dwell cycle but decreases over time as solute diffuses from blood to dialysate. As the gradient decreases, the rate of diffusion decreases. Increasing the dialysate flow rate (shorter dwell times) and/or volume (increased exchange volumes) enhances the gradient, and therefore, the rate of diffusion can be increased (FIGURE 13.1). Diffusion ceases when the concentration gradient between blood and dialysate no longer exists. Smaller molecules cross the peritoneal membrane more easily, equilibrate faster, and are influenced more by dialysate flow rates than are larger molecules (28,29).
It has generally been accepted that effective peritoneal blood flow is not a rate-limiting factor for the diffusive transport of small molecular weight solutes, as estimates of peritoneal blood flows are more than two to three times that estimated for the transport rates of small solutes like urea (17,18,30,31). However, given the large contribution of the liver-to-sinusoid transport and the fact that the liver may be more permeable to small solutes than other vascular beds in the abdomen, the rate of transport across the sinusoids may be so rapid that blood flow could be a limiting factor for this vascular bed (23). The major contribution of the liver to small solute clearance may account, in part, for the increased solute transport observed in the supine position or with increased dwell volumes as these maneuvers increase the contact of dialysate with the liver (23,29,32,33).
Convective Transport
Solute removal also occurs through convection. As osmotic forces cause water to move across the peritoneal membrane and into the peritoneal cavity, frictional forces between the solvent (water) and solutes (e.g., Na+, urea) result in these solutes being convectively carried along with water. This is referred to as solvent drag. Because the peritoneal membrane provides greater resistance to solutes than to water (particularly by way of fluid transport across ultrasmall or transcellular pores), the concentration of solutes in the ultrafiltrate is less than that in plasma; this is referred to as solute sieving. The sieving coefficient for a given solute is the ratio of the solute concentration in the ultrafiltrate to that in the plasma. The rate of solute transport by convection (Js) is therefore related not only to the transcapillary ultrafiltrate rate or water flux (Jw) but also to the serum concentration (Cs) and sieving coefficient (S) for that solute (EQUATION 13.2);

Because the rate of UF decreases over the time course of a dwell (see section “Fluid Transport” in subsequent text), the relative contribution of convective transport to overall solute removal also decreases during the same time period. The percentage of total solute transfer that is provided by convective as compared with diffusive transport increases significantly as the molecular size increases. It may be responsible for as little as 10% of total urea transport but may be responsible for more than 80% of protein transport (34,35).
Fluid Transport (Ultrafiltration)
Ultrafiltration occurs primarily through osmosis, as a consequence of the osmotic gradient created between the peritoneal blood compartment and the intraperitoneal dialysate compartment. This is achieved by utilizing hyperosmolar dialysate created by the addition of an osmotically active substance, usually dextrose, to the solution. The rate of transcapillary UF or water flux (Jw) is dependent on the peritoneal membrane hydraulic permeability (Lp) and effective surface area (A), as well as the transmembrane osmotic (Δπ) and hydrostatic pressure gradients (ΔP) (EQUATION 13.3):
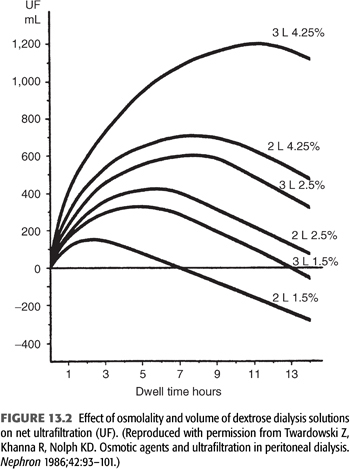
Transcapillary UF is highest at the beginning of a peritoneal exchange when the osmotic gradient is greatest. As a result of dilution of glucose by the ultrafiltrate and glucose absorption from the peritoneal cavity, as the osmotic gradient decreases over time, the rate of UF declines. The transcapillary UF rate (and therefore net UF—see later) can be increased by either the use of larger dialysate volumes (which decreases the rate of dilution) or more hypertonic solutions (which increases the osmotic gradient) or both (FIGURE 13.2). Factors that lead to an increase in peritoneal membrane permeability or effective surface area (e.g., peritonitis) increase solute transport (e.g., glucose absorption), resulting in a more rapid decline in the osmotic gradient and therefore decrease the rate of UF (36).
Lymphatic absorption (LA) of fluid from the abdominal cavity opposes the effects of transcapillary UF. As shown in FIGURE 13.3, the combined effects of these two forces determine the ultimate drain volume or net ultrafiltration (net UF) (EQUATION 13.4):
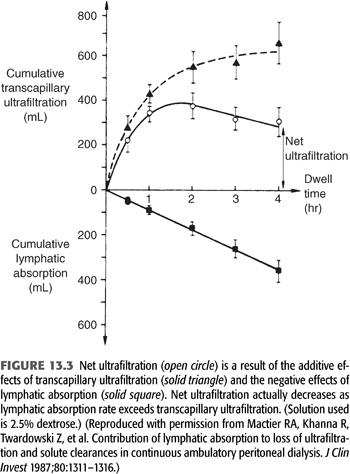

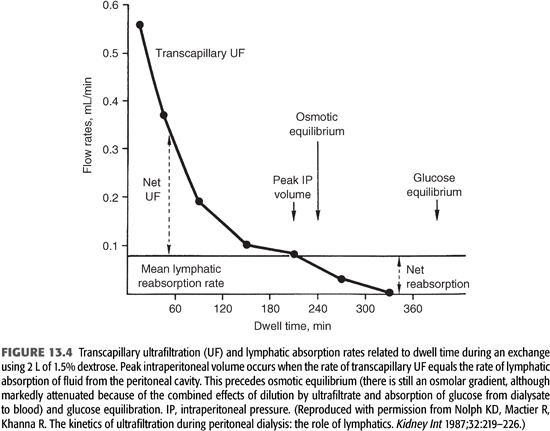
LA rates appear to be constant, regardless of the initial volume or tonicity of the dialysate instilled, and have been estimated to average from 1 to 1.5 mL/min (22,37,38). As long as the rate of transcapillary UF is greater than the rate of LA, intra-abdominal fluid volume or net UF increases above the initial fill volume (38,39). Peak intraperitoneal volume (net UF) is reached when the rate of transcapillary UF equals the rate of LA (FIGURE 13.4). This actually precedes the point in time at which osmotic equilibration of dialysate and plasma occurs. However, once the LA rate exceeds the rate of UF, a net absorption of fluid from the peritoneal cavity occurs, causing a decline in the intraperitoneal volume (declining net UF). Net UF can be increased by measures that increase the transcapillary UF rate (hypertonic dextrose solutions and/or increasing dialysate volume, as noted earlier), or by taking advantage of the time of peak UF (decrease the dwell time) (FIGURES 13.2 and 13.3). In addition to decreasing net UF, absorption of peritoneal fluid by lymphatic uptake impairs overall solute removal by partially negating the effects of both diffusive and convective transport.
 EVALUATION OF PERITONEAL MEMBRANE FUNCTION
Unlike HD membranes, the solute and fluid transport characteristics (surface area and permeability) of the peritoneal membrane in a given patient are unknown. Because of the alterations in transport parameters during the course of PD, regular follow-up is necessary to assess the delivered dialysis dose and, if needed, to characterize the functional status of the membrane. As a result, several indirect methods of evaluating the transport properties of the peritoneal membrane have been established. These protocols usually require that a PD exchange be performed with a specified dialysate volume and dextrose concentrations, assessing solute concentrations in serum and dialysate at specific points in time during a set dwell period, as well as determining the final drain volume. Through the information derived from these studies, a patient’s transport characteristics can be established. This is most often done by determining either the dialysate to plasma (D/P) ratio—best standardized by the peritoneal equilibration test (PET) (40) or the peritoneal membrane mass transfer area coefficient (MTAC) (35,41,42) for various solutes. Because the D/P ratio of a given solute (the measure of transport utilized in the PET) depends upon both diffusive and convective transport, the MTAC was introduced to separate those influences on solute transfer from membrane function alone. From a practical perspective, information on peritoneal membrane function that is gained by the MTAC adds little to that of the PET and the MTAC is therefore not commonly utilized in clinical practice (43).
Peritoneal Equilibration Test
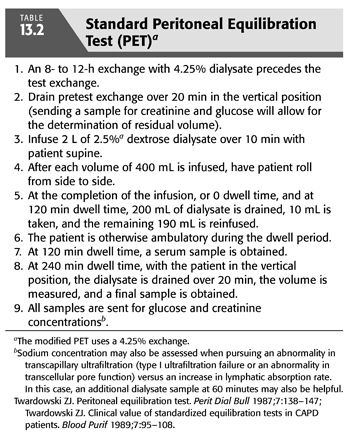
We are all indebted to Twardowski for his seminal observation of the variability of small solute transport rate and UF capacity within the PD population when he initially described the PET (44). This test semiquantitatively measures the peritoneal membrane transfer rates for solutes (usually urea and creatinine), based on the ratio of their concentration in D/P ratio at specific times (t) during the dialysate dwell, and for glucose, based on the ratio of dialysate glucose at dwell times t to dialysate glucose at 0 dwell time (Dt/D0). The procedure for performing PET is outlined in TABLE 13.2.
In determining the D/P creatinine ratio, it must be appreciated that high glucose levels will falsely elevate creatinine measurements when determined by the picric acid method. As a result, creatinine levels must be corrected for the glucose level using a correction factor (EQUATION 13.5):
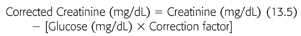
The correction factor in our laboratory is 0.00053, but this may differ from one laboratory to another, depending upon the analyzer used. Enzymatic methods for determining creatinine are not altered by glucose concentration and therefore do not require the use of a correction factor.
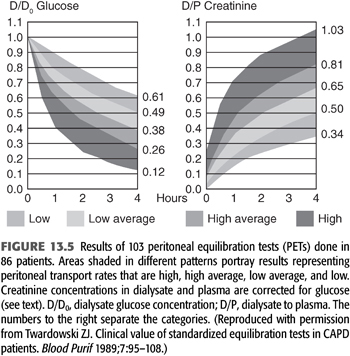
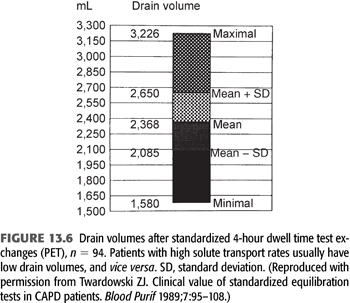
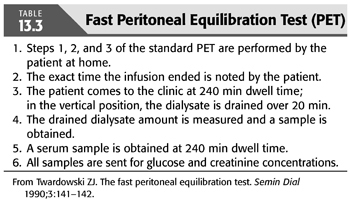
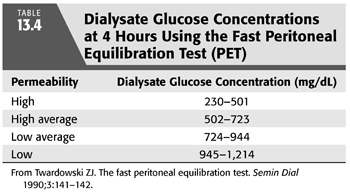
From 103 PETs performed in 86 patients on PD from 0.1 to 84 months at the time of the PET, Twardowski (40) categorized patients according to transport rates (based on the relationship of ±1 standard deviation from the mean) as low, low average, high average, and high (FIGURES 13.5 and 13.6). The PET results have been found to be highly reproducible, varying by less than 3% in repeated studies (8,45). The PET provides a valuable tool for categorizing and monitoring changes in peritoneal membrane transport (solute transport). Although the standard PET is also useful in assessing UF (water transport), it is limited by the fact that the use of a 2.5% exchange does not create a maximal osmotic gradient (15) (see section “Modified Peritoneal Equilibration Test” in subsequent text where 4.25% exchange is used). Nonetheless, information from the PET, in conjunction with clearance studies, aids in choosing an appropriate dialysis technique, developing a PD prescription, as well as following peritoneal membrane function (46). Because of the labor-intensive and time-consuming requirements of the standard PET, a “fast PET” was devised (47) (TABLE 13.3). The fast PET allows assessment of net UF and categorization of solute transport status using only the 4-hour D/P creatinine ratio (FIGURE 13.5) and glucose concentration (TABLE 13.4). The reproducibility of the fast PET results has also been shown to be quite good with coefficients of variation of less than 5% for the D/P creatinine and drain volumes (48). Transport category determinations obtained utilizing the results of the fast PET have been shown to correlate extremely well with those obtained by the standard PET method (49). One can therefore accurately follow up patients using the more labor-efficient fast PET. One disadvantage of the fast PET is that intermediate evaluation points at 1-, 2-, or 3-hour dwell times are not obtained; this may pose a problem when using this test for planning or altering dialysis prescriptions that use shorter dwell times such as continuous cyclic peritoneal dialysis (CCPD) regimens. Therefore, its primary value is as a tool for evaluating changes in membrane permeability over time.
Factors Influencing the Accuracy of Peritoneal Equilibration Test
The accuracy and reproducibility of the PET depend on its being performed exactly as outlined in TABLE 13.2. Any alteration in the method (e.g., dialysate volume) could significantly alter the results. For example, a larger instilled volume of dialysate may delay equilibration and lead to a lower D/P ratio and vice versa. Although using a more hypertonic exchange (4.25%) compared to 2.5% exchange has been shown to significantly change the D/D0 glucose and drain volume, the effect on D/P ratios for creatinine and designated transport category has been insignificant (50).
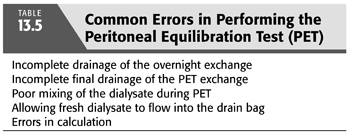
TABLE 13.5 outlines common errors in performing the PET. One additional note of caution is the use of the PET in patients with serum glucose concentrations of more than 300 mg/dL, as this can lead to unreliable results (47). Hyperglycemia decreases the D/P glucose (osmotic) gradient, thereby reducing the transcapillary UF rate as well as the rate of diffusion of glucose. This results in drain volumes that are less than expected and D/D0 glucose concentrations that are higher than expected based on the patient’s 4-hour D/P creatinine transport categorization. Finally, peritoneal surface area is larger relative to body weight in infants and children as compared with adults, and correlates more closely to BSA. Therefore, when performing the PET in infants and children, an exchange volume of 1,100 to 1,200 mL/m2 BSA is recommended. This allows the use of the same transport categories defined for adults (40,43) to be applied to infants and children (51–53).
Modified Peritoneal Equilibration Test
Although standardized and highly reproducible, the use of standard PET may not be optimal in determining UFF because the osmotic gradient created by the use of a 2.5% exchange is modest and does not test maximal UF, as would be seen using a 4.25% exchange. The large drained volume with a 4.25% exchange makes the result less subject to measurement errors and more sensitive to detect clinically significant UFF. Therefore, it has been recommended that a modification of the standard PET be made and that a 4.25% exchange be used rather than a 2.5% exchange. The use of a 4.25% exchange does not result in any significant difference in MTAC or D/P creatinine (D/PCreat) transport group characterization compared with that determined using a 2.5% exchange (50). The “modified PET” is currently considered the procedure of choice in the evaluation of UFF (water transport) and can be used to define peritoneal membrane function (solute transport) as well (14,15,54,55).
Miniperitoneal Equilibration Test
During a hypertonic dwell, approximately 60% of total UF is dependent on transport through small pores [ultrafiltration through small pores (UFSP)], which is coupled to the transport of small solutes, whereas approximately 40% of UF occurs through aquaporins resulting in the transcellular transport of free water without solutes (56–58). Estimation of free water transport can help in determining whether the cause of apparent UFF is due to decreased osmotic conductance in response to glucose or to a deficiency of aquaporins. A semiquantitative assessment of free water transport may be obtained by performing a 3.86% PET and examining either the D/P sodium concentration ratio (D/PNa) or the magnitude of the dip in D/PNa (15). However, even after correction for sodium diffusion (59), D/PNa and the dip in D/PNa are only approximate estimates of free water transport. Another indirect method to estimate free water transport is the comparison of net UF obtained during two modified PETs (standard peritoneal permeability analysis) performed with a PD solution with a glucose concentration of 1.36% or of 3.86% (54), but this method is complicated, time consuming, and not easily applicable in everyday clinical practice. In addition, it cannot properly quantify free water transport because the difference in net UF during a 1.36% or 3.86% test is the sum of the contribution of free water transport and of UFSP during the 3.86% test.
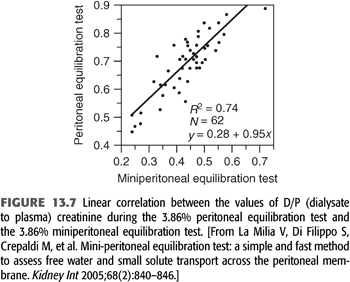
La Milia et al. (60) suggested another method with the consideration that during the first hour of a 3.86% exchange the free water transport is maximal—as glucose in the dialysate is at its highest concentration and diffusive sodium transport is very low—because of low plasma to dialysate sodium gradient. Therefore, if one shortens the duration of the 3.86% PET from 4 to 1 hour, UF through the large pores and reabsorption through lymphatics are both low (61); sodium transport is due mainly to convective transport through small pores. It is then possible to estimate UFSP as the sodium removal divided by the plasma water sodium concentration; free water transport is easily calculated by subtracting UFSP from total UF. This is referred to as the 3.86% mini-PET. The values of D/PCreat during the 3.86% PET and the 3.86% mini-PET were well correlated (FIGURE 13.7). Computer simulations by Venturoli and Rippe (62) showed that the La Milia method leads to reliable results and is easy to use in common practice. Furthermore, the free water transport calculated by this method was correlated to vascular AQP-1 expression (25). The mini-PET is a promising new tool, but its utility in the follow-up of prevalent patients’ needs to be explored.
Alternative Methods for Evaluating Peritoneal Membrane Function
A number of authors have offered alternative approaches to evaluating and monitoring peritoneal transport. These are all variations on the principles of the PET but are felt to offer either greater accuracy or ease than the standard PET. These include the standardized peritoneal permeability analysis (SPA), a modification of the PET using 1.5% dextrose to which dextran is added (63); the dialysis adequacy and transport test (DATT), which utilizes the D/P creatinine and urea ratios established by the 24-hour dialysate collection available from clearance studies (64); and the peritoneal permeability and surface area (PSA) index, which separates the contribution of diffusive and convective transport to the D/P ratio (65). But their complexity, accuracy, or reproducibility make them inferior substitutes for the PET, and they are not commonly used in clinical practice.
 DIAGNOSTIC APPROACH, DIFFERENTIAL DIAGNOSIS, AND TREATMENT OF THE PATIENT WITH ULTRAFILTRATION FAILURE
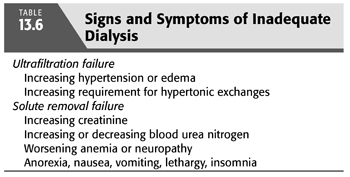
UFF is suspected clinically when patients cannot maintain an edema-free state or their target weight despite frequent use of hypertonic exchanges and dietary restriction. The observed increase in solute transport with time on dialysis explains, in part, the more frequent occurrence of signs and symptoms of UFF rather than that of inadequate solute removal (TABLE 13.6) (66–68). However, a change in peritoneal membrane function is only one of a number of possible factors that must be considered in a patient with suspected evidence of UFF (TABLE 13.1). A diagnostic approach (FIGURE 13.8) directed to the patient with possible UFF is therefore particularly germane.
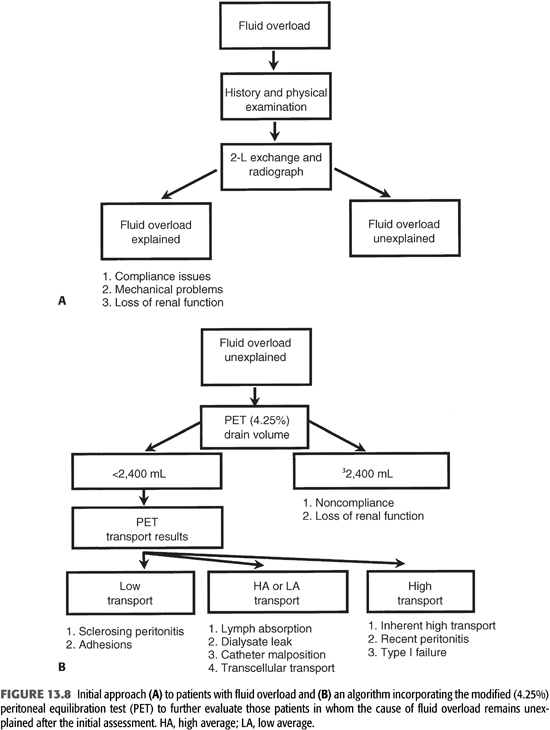
When a patient presents with signs or symptoms of fluid overload, it is important to obtain a good medical history and to perform a thorough physical examination (FIGURE 13.8). Issues such as compliance with diet and dialysis are obviously critical, and a significant reduction in urine output may identify another potential reason for this problem. In addition, knowing the time frame over which the fluid accumulation occurred may be extremely helpful; patients with membrane failure as well as those with increased LA usually develop symptoms of UFF gradually, whereas those with mechanical problems (malpositioned catheter or dialysate leak) have a more acute presentation. When the dialysate flow is described as positional, this suggests a malpositioned catheter. Findings of edema localized to the abdomen or inguinal area can be important clinical clues to the presence of a peritoneal leak.
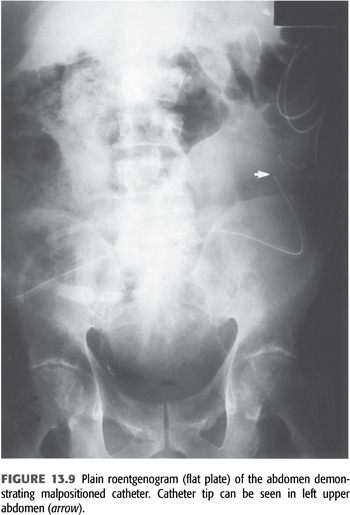
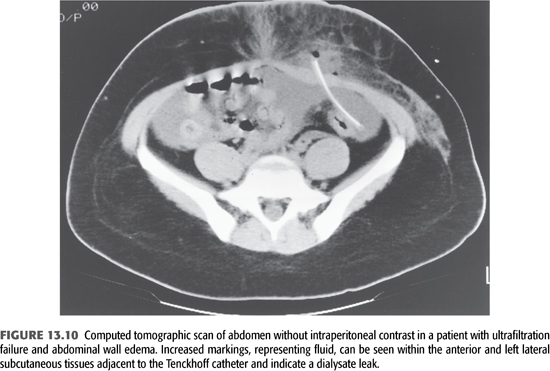
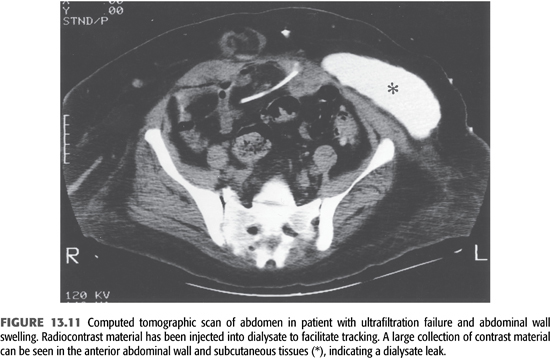
At the time of the initial evaluation of a patient with fluid overload, a quick “fill and drain” with 2 L of dialysate is beneficial to directly observe the nature and rate of inflow and outflow. Usually, the inflow rate for dialysate is approximately 1,700 mL over 10 minutes and the outflow rate is similar. The presence of fibrin clots may explain abnormalities with flow that reduce the efficiency of drainage and volume removal and can often be resolved with intraperitoneal heparin. If incomplete drainage or positional drainage is observed, a flat-plate radiograph of the abdomen should be performed to determine catheter position and to assess the degree of stool in the bowel as the distension of bowel loops because feces is the single most common cause of poor catheter drainage (FIGURE 13.9). When a peritoneal leak is suspected by clinical examination, computed tomography or magnetic resonance imaging (MRI) of the abdomen—even without contrast—will often confirm its presence (FIGURES 13.10 and 13.11). It is extremely important to communicate to the radiologist the purpose of any radiographic procedure used in assessing problems with PD, as well as to review the radiograph(s) personally.
When the etiology of fluid overload is not apparent after the initial clinical assessment and mechanical causes have been ruled out, the use of the modified PET is recommended as the best way to evaluate patients suspected of having UFF (15). The modified PET allows one to construct a logical approach to the differential diagnosis and treatment of this common problem (FIGURE 13.8).
 FLUID OVERLOAD WITHOUT ULTRAFILTRATION FAILURE
When a patient presents with unexplained fluid overload without UFF (drain volume greater than or equal to 2,400 mL), the possibility of noncompliance with diet or dialysis prescription must be entertained (FIGURE 13.8). In addition, the unrecognized and therefore uncompensated loss of RRF is a common cause for signs and symptoms of inadequate fluid removal, particularly in high-transport patients.
Patient Compliance
Noncompliance with the dialysis prescription and/or diet is a common problem that is often difficult to diagnose, as it is almost totally dependent on the patient’s willingness to be honest. Estimates of the rate of noncompliance with the dialysis prescription range from 13% to 78% (69–71). Unfortunately, the methods presently used in documenting dialysis noncompliance such as comparing measured to calculated creatinine production are highly inaccurate (70). An estimate of dialysate use can be obtained through the shipping records of the dialysate supply company and therefore may allow an objective parameter by which to judge a patient’s compliance. Although difficult to resolve, education and positive reinforcement may help improve this problem in a motivated patient.
Residual Renal Function
At the initiation of chronic dialysis, most patients still have RRF that may contribute as much as 30% to the overall maintenance of solute and fluid balance (72). Outcome studies in PD patients have clearly demonstrated a significant survival benefit with preservation of RRF (73). The potential benefits include better clearance of middle and larger molecular weight toxins, better volume and blood pressure control, decreased inflammation, improved appetite and nutritional status, relative preservation of kidney endocrine functions, and improved phosphate control and quality of life. However, RRF [glomerular filtration rate (GFR)] continues to decline on dialysis, which is associated with a significant decrease in urine volume. As a result, measures to preserve RRF are an important target in the treatment of patients receiving dialysis. Aggressive measures taken before initiation of dialysis to preserve kidney function, such as avoidance of nephrotoxic insults including intravenous contrast, antibiotics (e.g., aminoglycosides), and prevention of hypotensive episodes, should continue to be addressed once dialysis has been initiated. Randomized trials have shown that use of an angiotensin-converting enzyme (ACE) inhibitor or angiotensin receptor blocker reduces the rate of decline in RRF and possibly delays the development of complete anuria in patients performing PD, although these trials were of small size (74,75). Another intervention which may be useful for preservation of RRF has been the use of biocompatible PD solution. Several trials comparing biocompatible solutions based on (a) neutral pH with low glucose degradation product (GDP) (balANZ trial), (b) 1.1% amino acids, or (c) 7.5% icodextrin with conventional dextrose-based dialysate recently have been shown to decrease the rate of decline in RRF, with a smaller decline in urine volume or longer time to the development of anuria (76–79). To closely monitor for changes in kidney function, the ISPD recommends that 24-hour urine volumes and clearances be assessed regularly and at an appropriate frequency (every 1 to 2 months if practicable, otherwise no less frequently than every 4 to 6 months) so that the PD prescription can be adjusted in a timely manner (evidence level C). If there is a decrease in urine volume or a change in blood chemistries suggesting a decline in RRF, it should be measured sooner (80).
 FLUID OVERLOAD WITH ULTRAFILTRATION FAILURE
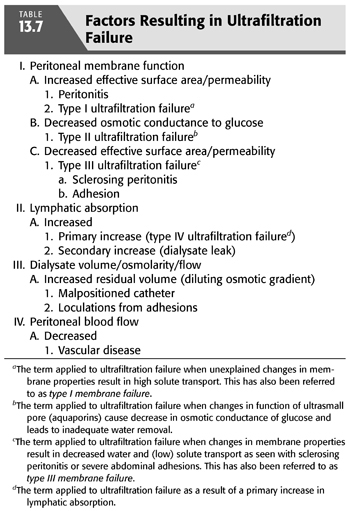
A drain volume of less than 2,400 mL following a 4-hour 4.25% exchange defines the patient with UFF. UFF occurs when the balance between the transcapillary UF and LA rates has been altered, resulting in a decrease in drain volume (FIGURE 13.8). Clinically, this is identified by the need for more hypertonic exchanges to resolve signs of volume overload. These changes can be the result of (a) an increase in surface area/permeability leading to greater glucose absorption and a more rapid dissipation of the osmolar gradient (type I UFF), (b) a decrease in the osmotic conductance of glucose that leads to inadequate water removal (type II UFF), (c) a severe decrease in effective peritoneal surface area/permeability that significantly restricts the transport of both solute and fluid (type III UFF), (d) an increase in LA (type IV UFF), or (e) an increase in residual volume that leads to a more rapid loss of osmotic gradient by dilution (4). Therefore, a number of factors, in addition to changes in the peritoneal membrane, must be considered in the differential diagnosis of patients with UFF (TABLE 13.7). The PET allows an important assessment of both water and solute transport, which aids in the evaluation of UFF.
Patients with High Solute Transport (D/P Creatinine Greater Than 0.81)
Patients with a low drain volume (less than 2,400 mL/4 h with a 4.25%/3.86% modified PET) and a D/P creatinine greater than 0.81 likely represent the largest group of patients with inadequate filtration due to peritoneal membrane characteristics. These patients tend to have good low molecular weight solute transport but have poor UF during standard CAPD or CCPD using glucose-containing dialysate, due to rapid absorption of glucose and dissipation of the osmotic gradient. If their dwell times are mismatched for their membrane transport characteristics, they often appear to have inadequate UF as they lose RRF and no longer have urine flow to supplement net daily peritoneal fluid removal. This clinical picture may develop over the course of months to years (so-called type I UFF), may be the consequence of a recent episode of peritonitis, or may be intrinsic to a particular patient’s peritoneal membrane.
Type I Ultrafiltration Failure
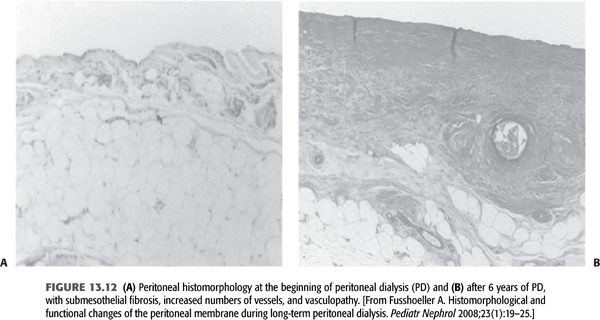
This is the most common cause of UFF and is due to large effective peritoneal surface area with subsequent hyperpermeability of the membrane. Unfortunately, the development of slowly increasing hyperpermeability is a typical feature of chronic PD. The pathomorphologic cause of type I UFF is probably both fibrosis and, especially, angiogenesis, resulting in a large effective surface area (FIGURE 13.12). The avascular submesothelial fibrotic layer results in decreased osmotic pressure toward the endothelial exchange area of the capillaries. Additionally, by angiogenesis, an increased number of perfused capillaries under the fibrotic matrix rapidly dissipate the glucose-driven osmotic pressure. In an excellent animal model, an adenovirus-mediated gene transfer of angiostatin, a highly potent inhibitor of angiogenesis, resulted in higher UF by suppressing angiogenesis. An inverse correlation was found between the number of vessels and UF, underlining the important role of increased effective peritoneal surface area by angiogenesis in decreasing UF (81).
Hyperpermeability is a predictor of higher mortality in long-term PD patients (80). In 1998, the single-center Stoke PD study (83,84) and the multicenter Canada–United States of America (CANUSA) study (85), both prospective cohorts adequately powered to look at mortality, demonstrated that high transport was associated with worse patient and technique survival independent of other important predictors, such as age, comorbidities, and RRF. Later analysis from the Australian and New Zealand Dialysis and Transplant (ANZDATA) registry, by far the largest study published to date, also reported the association of high transport rates with increased mortality and technique failure (86). Moreover, further analyses of these studies exhibited that relationship between high transport and survival was confined to CAPD and not apparent in CCPD patients (87). Similarly, ANZDATA reported a high transport-modality interaction supporting higher mortality in CAPD patients. These analyses clearly suggest that excess mortality associated with high permeability is related to impaired ultrafiltration, which is better managed by CCPD.
Etiology and Pathogenesis
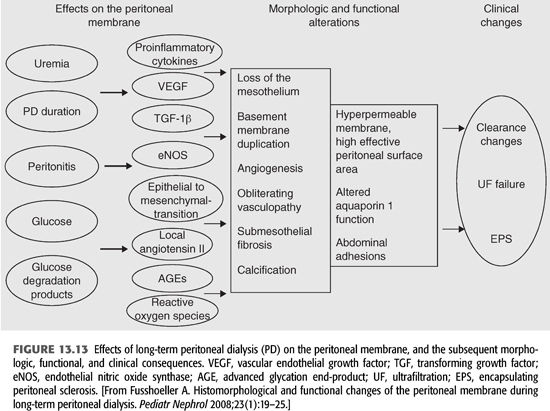
Recently, much work has been done to identify the mechanisms that are involved in the pathogenesis of peritoneal membrane failure during long-term PD (FIGURE 13.13). The major studied factors contributing to morphologic and functional alterations of the peritoneal membrane have been uremia, peritonitis, and the nonphysiologic nature of dialysis fluids. In uremia circulating nitric oxide (NO), advanced glycation end-products (AGEs), vascular endothelial growth factor (VEGF), and inflammatory cytokines [interleukin (IL)-1β, tumor necrosis factor alpha (TNF-α), and IL-6] are all significantly increased (88). The increase in effective peritoneal surface area is strongly related to VEGF and NO. The peritoneal expression of VEGF has been reported to correlate with the permeability of the peritoneal membrane and the degree of angiogenesis (89). In addition, during chronic PD, endothelial nitric oxide synthase (eNOS) is significantly upregulated, which may contribute to an increase in vascular density and endothelial area (90). Data from the peritoneal biopsy registry confirmed that uremia per se leads to thickening of the submesothelial zone and mild vasculopathy (91).
Related posts:
Stay updated, free articles. Join our Telegram channel

Full access? Get Clinical Tree


