Some have suggested that this increased rate of mortality in dialysis patients is due to inadequacies in the prescribed dose of dialysis (4,5). However, it is acknowledged that there is more to “adequacy” of dialysis than what any single yardstick for “dialysis dose” can measure. In an attempt to improve patient outcomes, both National and International Medical Societies have developed guidelines intended to standardize medical care, help practicing nephrologists, identify research needs, and ultimately improve clinical outcomes. For PD, the first of these was the National Kidney Foundation (NKF)-sponsored Dialysis Outcomes Quality Initiative (DOQI) clinical practice guidelines for adequacy of PD (6). These have subsequently been revised twice (7,8).
This chapter discusses adequacy for PD in terms of total solute clearance, volume control, and other issues related to the PD prescription. Although it focuses on small solute clearance issues, it is acknowledged that the optimal treatment of a patient with end-stage kidney disease (ESKD) must additionally address blood pressure (BP) and volume control, treatment of acidosis, anemia, prevention of metabolic bone disease, and perhaps treatment/prevention of a chronic inflammatory state. These particular issues are discussed in other sections of this text.
 WHAT YARDSTICK FOR ADEQUACY OF DIALYSIS SHOULD WE USE?
Some of the clinical manifestations of uremia or “underdialysis” are readily apparent to the clinician and/or the patient (9). These include decreased appetite, metallic taste, nausea, vomiting, pericarditis, pleuritis, and encephalopathy. Not so readily evident as a manifestation of “underdialysis,” is the presence of hypertension (10), lipid abnormalities (11), and peripheral neuropathy (12). In addition, patients often underreport their symptoms. Therefore, in addition to the clinical assessment of the patient, it would be clinically helpful if nephrologists had a reliable and easily measured laboratory parameter that can be obtained during the course of chronic kidney disease (CKD) and when a patient is on dialysis that predicts the presence of uremic complications and patient outcome. There is no documented single substance that has been shown to be the “uremic” toxin. Undoubtedly, the clinical manifestations of the uremic syndrome are the result of the synergistic effect of multiple retained solutes across a broad spectrum of molecular weights. It is because retained levels (body burden) of these solutes that the uremic syndrome occurs. Therefore, because there is no single “uremic” toxin, one must rely on “surrogate” markers for “adequacy of dialysis.” Current commonly used surrogates include clearances or serum levels of urea nitrogen, creatinine, phosphorous, or β2-microglobulin. At present, if a physician was going to pick one yardstick as a measure of dialysis dose, it would be a urea-based surrogate (Kt/Vurea).
There are historical data which suggests that the outcome for patients on both hemodialysis (HD) (13) and PD (14) was related to total small solute clearance and to surrogates of nutritional status such as dietary protein intake (DPI), body mass, and serum albumin levels. It was not uncommon to observe an improvement in overall patient well-being and nutritional intake after small solute clearance was increased. There appeared to be a relationship between protein intake, solute clearance, and the manifestations of uremia or nutritional status that were likely to be different in each patient but, in the absence of significant comorbid disease, tended to correlate positively with solute clearance (15). As a result, in the initial clinical practice guidelines for “adequacy of PD,” the recommended standard “yardsticks” for dose of PD included urea clearance normalized to its volume of distribution (Kt/Vurea) and creatinine clearance (Ccr) normalized to 1.73 m2. However, as will be discussed in subsequent text, contemporary data may suggest that one may also need to refocus on other known “yardsticks” of renal replacement therapy such as sodium removal, volume control, phosphate, and β2-microglobulin clearance. Our historical small solute marker, Kt/Vurea, should just be the starting point of an adequacy of dialysis evaluation.
Correlation between Solute Clearance and Risk of Death
Steady-state serum levels of various solutes are related to their generation and removal rates. To guide dosing of dialysis, one needs to monitor serum levels and measure the amount of the surrogate solutes removed from the body. However, serum levels alone may be misleading. Take blood urea nitrogen (BUN) levels for instance. These levels are related to generation (dietary intake) and removal (native kidney function and/or dialysis). If a patient is underdialyzed, he or she may not eat well. In this case, the BUN level may look as expected or low, suggesting adequate dialysis, but the patient’s dialysis dose could be low and the cause of under-eating—uremia. Similarly, if one was malnourished, one may have a low muscle mass and serum creatinine levels may look low, suggesting adequate dialysis when in fact, the low creatinine was a reflection of low production (low muscle mass) not adequate dialysis. As a result, it was felt that a surrogate for adequate dialysis should be something other than simply looking at blood levels of these two solutes. Consequently, current guidelines for “adequacy of PD” recommend obtaining a 24-hour collection of both urine and peritoneal effluent for analysis of total removal for a particular solute (Krenal + Kperitoneal = Krp or total). Urea and Ccr are obtained and then normalized to volume of distribution (urea) and body surface area (BSA) (creatinine) to calculate weekly Kt/Vurea and weekly Ccr/1.73 m2. Historically, to determine total solute removal (kidney and dialysis), it was recommended that when making these calculations, the residual kidney and peritoneal clearances was added together 1:1. This was initially based on the assumption that the potential beneficial effect on patient outcome from 1 unit of residual kidney and 1 unit of peritoneal clearances was equal. However, it is now recognized that this is not the case. Specifically, if one were to look at the benefit in terms of small solute removal only, the residual kidney component seems to be superior to that of RRTs (see subsequent text). However, because the most recent prospective randomized controlled trials (PRCTs) that have evaluated the relationship between relative risk of death and solute removal (in terms of Kt/Vurea) were conducted using total solute clearance adding kidney and peritoneal in a 1:1 way, current NKF Kidney Disease Outcomes Quality Initiative (KDOQI) and other guidelines still make this recommendation.
Why Small Solute Clearance as the Adequacy Surrogate?
If one was to look quantitatively at urinary solutes, you would see that urea is one of the most plentiful solutes in the urine in health. Furthermore, it is well documented clinically that in patients with advanced stages of kidney disease, some uremic symptoms are related to protein intake. It would therefore make some sense to use some index related to urea as a potential marker for dialysis dose. Multiple retrospective cohort studies, all differing in methodology and the number of patients enrolled, have examined the relationship between patient outcomes in terms of relative risk of death or morbidity and its relationship to total small solute clearance, the significance of which has been reviewed elsewhere (16,17). Historical studies tended to conclude that outcomes such as relative risk of death and hospitalizations were in some way related to total small solute clearance. These studies and more contemporary, but contradictory, PRCTs are briefly reviewed in subsequent text.
Kt/V Data
Current recommendation for PD adequacy is to target a total [PD and residual renal function (RRF)] Kt/Vurea of at least 1.7 per week. What are these recommendations based on?
Historical Publications
Original theoretic constructs for continuous ambulatory peritoneal dialysis (CAPD) predicted that an anephric 70-kg patient [total body water (TBW) or V = 42 L] would remain in positive nitrogen balance when prescribed five, 2-L PD exchanges per day (18). Studies using univariate analysis of observational data correlating outcomes with small solute clearance suggested the following: In patients with RRF, to optimize clinical outcomes, one should maintain a total weekly Kt/Vurea target of more than 1.5 in one (19) and more than 2.0 in another (20). A study in anuric patients suggested that patients with a Kt/V of greater than 1.89 did best (21).
Studies using the statistically more correct multivariate analysis of observational data to determine the predictive value of Kt/Vurea on survival found the following: a survival advantage in patients with a weekly Kt/Vurea greater than 1.89 in one study (22), and, in another study of prevalent PD patients [mean baseline glomerular filtration rate (GFR) 1.73 mL/min] followed up for up to 3 years, the best survival was noted in patients with a total Kt/Vurea of at least 1.96 with no incremental improvement in survival with higher small solute clearances (23). While the Canada–United States of America (CANUSA) study (14), a prospective, multicenter, observational cohort study of incident patients in North America and Canada (mean baseline GFR 3.8 mL/min), predicted that over the range of solute clearance studied every 0.1 unit increase in Kt/V would be associated with a 6% decrease in the relative risk of death. The same effect was predicted for Ccr, and there was no evidence of a plateau effect. In the original analysis, RRF was not evaluated as an independent predictor of relative risk of death.
Although in 1995, the CANUSA study provided the best historical evidence that survival on PD is related to total solute clearance, it is important to remember two points. First of all, it was not a PRCT, and secondly, the results were based on theoretic constructs and two very important assumptions: (a) Total solute clearance remained stable over time and (b) 1 unit or mL/min of clearance due to RRF is equal to 1 unit or mL/min of clearance due to PD. In actual fact, the total solute clearance decreased over time as RRF decreased with no corresponding increase in the peritoneal component. Therefore, because the peritoneal component of total solute clearance tended not to change over the course of the study, one interpretation of CANUSA would be to say that the more RRF the patient has, the better the predicted outcome (24). This was in fact confirmed with a residual renal centric reanalysis of the CANUSA data (25). Similar outcome data from CANUSA correlating patient outcome with small solute clearance in terms of Ccr are available. In some publications, total weekly Ccr/1.73 m2 was more predictive of all-cause outcomes than total weekly Kt/Vurea. As will be seen, this was likely due to the residual kidney component of the total solute clearance.
On the basis of historical observational studies published before 1996, and the possible association between solute clearance and DPI (reviewed in subsequent text), the original NKF-DOQI working group on adequacy of PD recommended the following total solute clearance goals for CAPD: a total weekly Kt/Vurea of more than 2.0 per week and a total weekly Ccr of more than 60 L/1.73 m2/wk. For continuous cyclic peritoneal dialysis (CCPD) and for nightly intermittent peritoneal dialysis (NIPD), slightly higher total weekly Kt/Vurea and total weekly Ccr/1.73 m2 were recommended (6). It was acknowledged that the CAPD targets were only marginally evidence-based and that there were no prospective randomized studies to support those recommendations. The original guidelines have subsequently been replaced. It was also acknowledged that targets for CCPD and NIPD were opinion-based with little to no outcome data for the recommendations. Subsequently, other medical societies recommended targeting a total weekly Kt/Vurea of 2.0 (Canada guidelines) (26) and 1.7 (UK guidelines) (27) for all PD therapies.
Contemporary Observational Studies
Contemporary studies have further examined the effect of increasing peritoneal clearance on survival. There are three studies from a group in China. Szeto et al. (28) retrospectively reviewed their experience in 168 prevalent CAPD patients followed up for 1 year. Outcomes for patients with a total Kt/Vurea of more than 1.7 per week (baseline mean total Kt/Vurea 2.03 ± 0.25 for patients with RRF, and a baseline mean total Kt/Vurea was 1.93 ± 0.18 for patients without RRF) were compared to those for patients with a total Kt/Vurea of less than 1.7 per week (mean total Kt/Vurea was 1.38 ± 0.22). Overall mortality at 1 year was 8.3%; however, although there was no statistically significant difference between the groups, 9 out of 14 deaths occurred in the anuric patients with a weekly Kt/Vurea of less than 1.7 per week. On the basis of this, one might infer that a weekly peritoneal Kt/Vurea of less than 1.7 in an anuric patient may be associated with an increased relative risk of death in the long term if these trends continued. In another study, these authors showed an association between outcome and total solute clearance, mainly due to the residual kidney component (29). In contrast, in an evaluation of 140 prevalent anuric patients, followed up for a mean of 22.0 + 11.9 months, they found a positive correlation between peritoneal clearance and survival (30). In these patients, the mean baseline peritoneal Kt/Vurea was 1.72 ± 0.31 per week and 42% were prescribed three 2-L exchanges per day [patients whose prescription was modified if there were ultrafiltration (UF) problems]. Each 0.1 unit decrease in Kt/V was associated with a 6% increase in mortality, similar to that predicted by CANUSA.
These data in Asian patients suggest that once a certain minimal peritoneal small solute clearance is achieved (perhaps a peritoneal Kt/Vurea greater than 1.7 to 1.8 per week) and the patient is on 24 per day of peritoneal clearance, that further incremental increases in small solute clearance in the range that was studied result in little increase in short-term outcome.
Davies et al. (31,32) found an association between total solute clearance and survival, and as in other studies, this was all due to variations in residual renal clearance, not peritoneal. In a study of 122 anuric Canadian patients, Bhaskaran et al. (33) reported that the best survival, representing a 58% reduction in mortality, was found in the group of patients with a Kt/Vurea greater than 1.8/wk (Ccr greater than 50 L/1.73 m2/wk). There was no demonstrable incremental improvement for higher weekly clearances. However, the 95% confidence interval (CI) of the study was 0.26 to 1.13, reflecting the low statistical power achieved in this study in a relatively small number of patients.
Contemporary Prospective Randomized Trials
There are three prospective, randomized trials that evaluated the effect of an increase in peritoneal clearance on survival. In the smaller of the three studies, Mak et al. (34) prospectively evaluated the effect of an increase in dialysis dose in a controlled trial in 82 CAPD patients. Baseline, all patients were prescribed three 2-L exchanges per day. They were then randomized to continue this regimen (mean Kt/Vurea of 1.67 per week) or increase their PD prescription to four 2-L exchanges per day (mean Kt/Vurea 2.02 per week) and were followed up for 1 year. Over short-term follow-up (1 year), there was a difference in hospitalization rates. However, hospitalization rates increased in the control group and decreased in the intervention group, so this may be misleading.
A provocative prospective, randomized, interventional study evaluating the effect of an increase in peritoneal solute clearance compared to continuing on “standard therapy” in 965 CAPD patients in Mexico, the “adequacy of peritoneal dialysis in Mexico (ADEMEX)” study, found no beneficial effect on relative risk of death for the intervention group patients who had a statistically significant increase in their peritoneal solute clearance (35). All patients had 24 h/d of peritoneal dwell, and at baseline, all were on four 2-L exchanges per day, and RRF was similar in the two groups. Averaged total solute clearances over the course of that study were total Kt/Vurea, 1.80 ± 0.02 in controls versus 2.27 ± 0.02 in the interventional group, whereas peritoneal-only Kt/Vurea was 1.62 ± 0.01 in controls versus 2.13 ± 0.01 in the intervention group. Corresponding Ccr values in L/wk/1.73 m2 were 54.1 ± 1.0 versus 62.9 ± 0.7 and 46.1 ± 0.45 versus 56.9 ± 0.48, respectively. The distribution of prescriptions in the interventional group was 10 L/d in 37%, 11 L/d in 20%, 12 L/d in 21%, 12.5 L/d in 8%, and 15 L/d in 14%. Quality of life was also assessed in the ADEMEX trial. There were no significant differences between the two groups at any point in time for physical composite summary score, mental composite summary score, or kidney disease component summary (36). Interestingly, in a subgroup analysis of anuric patients, there was also no benefit to an increase in peritoneal clearance. Therefore, in the ADEMEX study, neither survival nor the quality of life was benefited by higher small molecule clearances.
As noted in the observational studies cited in preceding text, RRF was the main predictor of mortality, with an 11% increase in mortality for each 10 L/wk/1.73 m2 decrease in weekly kidney Ccr and a 6% increase in mortality for each 0.1 unit decrease in weekly kidney Kt/Vurea. In this study, although there was a statistically significant increase in peritoneal UF volume increased in the intervention group (0.97 ± 0.05 L/d vs. 0.84 ± 0.03 L/d, p <0.05), there was no demonstrable improvement in outcome with increasing peritoneal UF.
The results of the ADEMEX trial are consistent with a subsequent randomized trial done in Hong Kong comparing three total Kt/Vurea groups (1.5 to 1.7, 1.7 to 2.0, and more than 2.0) in CAPD patients (37). Again, despite the statistically significant differences in solute clearances, there were no differences in 2-year patient survival in the three groups. All patients at the start of the study had residual kidney Kt/Vurea of 1.0 or less, ensuring minimal residual kidney function. Baseline residual GFR was 2.38, 2.48, and 2.64 mL/min (representing kidney Kt/Vurea of 0.44, 0.46, and 0.49, respectively) in the three groups, not statistically different. Average body mass index (BMI) was 22 kg/m2, somewhat smaller than the patients in the ADEMEX trial and the typical patient in the United States. Before randomization, the usual prescription was three 2-L exchanges per day in contrast to the “standard” prescription of four 2-L exchanges per day in the control arm of the ADEMEX trial. Dialysis adequacy was assessed every 6 months and based on the results, during the course of the 2-year follow-up in the Hong Kong study, the PD prescription was adjusted up or down, as RRF changed, to stay within the randomized total Kt/Vurea category. By the end of the study, residual kidney Kt/Vurea was at or less than 0.1 in all three categories. This is an important distinction between the Hong Kong study and the ADEMEX study. In ADEMEX, the control group consisted of a group of patients who continued on the current “standard” therapy, whereas in the Hong Kong study, some patients randomized to the low-dose arm actually had their dialysis prescription reduced.
In summary, these data suggest that for the average patient on standard CAPD (24 h/d of peritoneal dwell time), once small solute clearance is above a certain minimal amount, further increases in small solute clearance in range easily obtained clinically with current technologies result in no demonstrable incremental increase in patient outcome. These studies did not examine a lower “dose” of PD, and therefore, the absolute minimal total delivered solute clearance in terms of Kt/Vurea has not been established. However, available evidence suggests that the weekly minimal delivered total solute clearance in terms of Kt/Vurea should be more than 1.7 per week. This is consistent with observational data in anuric patients (38). The data do not say that the recommended minimal prescribed total weekly small solute clearances goals should be lowered for all patients. They do suggest that nephrologists should be more comfortable with individualizing their prescriptions and, that if a patient is not at goal but is eating well and feeling well, that there is no reason to have to transfer the patient to HD due to inadequate dialysis. The data suggest that one also needs to consider focusing on additional “yardsticks” of adequacy of dialysis. These studies were by design relatively short term (2 years of follow-up) and did not look at differences in middle molecule clearance or volume control, other possible markers for “adequacy” of dialysis.
Creatinine Clearance Data
Current guidelines do not recommend using Ccr as the adequacy yardstick. Why not? Most of the studies reviewed earlier that examined the predictive value of total Kt/Vurea on outcome also evaluated the effect of total Ccr/1.73 m2. In the CANUSA study, total Ccr predicted not only death but also technique survival and hospitalization (14). Analysis of those observational cohort data suggested that a total weekly Ccr of more than 70 L/1.73 m2 would predict a 78% 2-year patient survival. Other studies suggested that the minimal total weekly target should be more than 58 L/1.73 m2 (23) or more than 50 L/1.73 m2 (2,39), whereas anuric patients did best if their clearance was more than 50 L/1.73 m2 (33). In the ADEMEX study, there was no difference in outcome between the control group (mean total Ccr of 54 L/1.73 m2/wk) versus the intervention group (mean total Ccr of 62.9 L/1.73 m2/wk) (35). The Hong Kong study (36) was not analyzed in terms of Ccr.
These data suggest that as with Kt/Vurea, once above a certain minimal total weekly Ccr, further increases in dialysis dose were not associated with further improvement in the relative risk of death for patients as a group.
 SUMMARY OF CURRENT RECOMMENDED ACCEPTABLE TOTAL SOLUTE CLEARANCE TARGETS FOR PERITONEAL DIALYSIS
In response to the ADEMEX and Hong Kong trial data, original (late 1990s) guidelines for the adequacy of PD were revised by multiple societies and national guideline committees. Before reviewing these recommendations, it is important to remember the following caveats: First of all, it is possible that the influence of solute clearance on outcome may vary in different ethnic populations. In the United States Renal Data System (USRDS) experience, African Americans and Asians on HD tend to have a lower relative risk of death than whites, presumably with the same solute clearance. Reasons for this are unclear. Perhaps this is due to differences in protein intake. Second, patients in Mexico and Hong Kong have different DPIs than patients in North America or Europe. Third, there may be differences in compliance between countries and ethnic groups. Fourth, there may be unrecognized factors or differences in comorbid diseases (40). Fifth, the ranges of solute clearances examined may not have been sufficiently different to have been able to show a clinically significant difference in survival. More data are clearly needed.
The International Society for Peritoneal Dialysis (ISPD) commissioned a work group with representation from North America, Asia, Australia, and Europe to formulate recommendations for the delivery of adequate PD, taking into account the more recent studies cited in this chapter (41). With respect to small solute removal, it was recommended that the total (renal and peritoneal) weekly Kt/Vurea should be greater than 1.7/wk. If using RRF as part of the total, for simplification, the renal and peritoneal Kt/Vurea can be added together in a 1:1 manner, although it was acknowledged that the contribution of renal and peritoneal clearances are likely very different from each other. Although it was felt that a separate recommendation for Ccr was not necessary, it was suggested that in patients on cycler a weekly minimum clearance of 45 L/1.73 m2 should be reached. (The reason for adding a Ccr target for the patients on cycler is because of the temptation to prescribe multiple rapid cycles overnight and a dry day—a prescription that could increase the removal of urea but compromise removal of the more slowly transported, larger uremic toxins.) PD should be carried out 24 hours a day except in special circumstances because of the time dependence for the transport of larger molecular weight toxins. Although a daily UF target was not specified, it was emphasized that maintenance of euvolemia is an important part of adequate dialysis, and attention must be given to urine and UF volume. Within the confines of financial and adherence realities and limitations, the dose of PD should be increased as a trial in any patient who is not doing well because of underdialysis or for uncertain reasons.
The NKF in the United States published similar recommendations in 2006 (8), stating that the minimal delivered total solute clearance should be a Kt/Vurea of 1.7 per week. The work group did not see any benefit in adding Ccr solute recommendations nor did they see any data suggesting that the minimal targets needed to be different for patients on CAPD or NIPD or CCPD. Guidelines on protecting RRF and maintaining euvolemia were also added.
The Australian guidelines formulated by a work group Caring for Australians with Renal Impairment (CARI) published on the Internet in 2005 recommends that the weekly total Kt/Vurea be greater than or equal to 1.6 and that the Ccr be no less than 60 L/wk in high and high-average transporters, and 50 L/wk in low and low-average transporters (www.cari.org.au). The renal association from the United Kingdom has similar recommendations (1.7 and 50 L/wk) and also recommends that if UF does not exceed 750 mL/d in an anuric patient, consideration be given to a change in therapy (www.renal.org). The European Best Practice Guidelines published in 2005 have the same target Kt/Vurea, while also recommending a Ccr of at least 45 L/wk/1.73 m2 for those patients on cycler and a UF goal of 1 L/d for anuric patients (42).
 IMPORTANCE OF RESIDUAL RENAL FUNCTION
Of course, it is well recognized that in an anuric patient, there is a survival benefit associated with doing dialysis. The question is how much or are we just limited in how much we can provide given our current technologies. In contrast to the conflicting data about the benefit of increasing peritoneal clearance on survival, studies have consistently shown that the presence of residual renal clearance is associated with a decrease in the relative risk of death both for patients on PD and for patients on HD (43).
Reanalysis of the CANUSA data (25) suggested that for each 5 L/wk/1.73 m2 increase in GFR, there was a 12% decrease in the relative risk of death. There was no demonstrable benefit from peritoneal clearance. Estimates of net fluid removal suggested that a 250 mL/d increment in urine volume was associated with a 36% decrease in the relative risk of death, whereas net peritoneal UF and total fluid removed were not predictive of outcome. In the ADEMEX study reviewed earlier, RRF, not peritoneal, was a predictor of mortality, with an 11% increase in mortality for each 10 L/wk/1.73 m2 decrease in weekly kidney Ccr and a 6% increase in mortality for each 0.1 unit decrease in weekly kidney Kt/Vurea clearance. An evaluation of 673 patients followed up for 1 year reported that decreasing renal clearance, not peritoneal clearance, was statistically associated with an increased mortality rate (44). Similar findings were reported in a review of 873 patients selected for evaluation in the 2000 Health Care Financing Administration Clinical Practice Management project database (45). Other smaller observational studies have also replicated these findings (46–48).
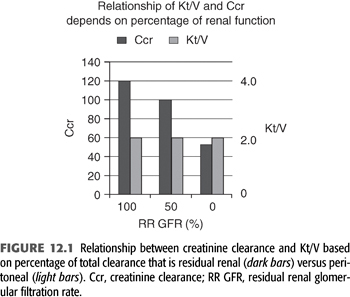
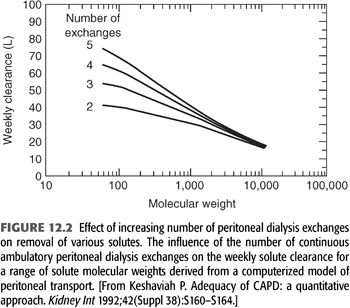
Reasons for these observations are unclear. Some plausible hypotheses for these findings are as follows: (a) Although 1 unit of residual renal clearance may be the same as 1 unit of peritoneal clearance when measured in terms of Kt/Vurea, this may not be true for other solutes. For instance, as will be discussed later, if a patient has a residual kidney Kt/Vurea of 2.0, his or her residual kidney Ccr is likely to be approximately 120 L/wk. In contrast, an anuric patient with a peritoneal Kt/Vurea of 2.0/wk will likely have a peritoneal Ccr of approximately 55 L/wk (FIGURE 12.1). This difference may be even more pronounced for middle molecular weight solutes such as β2-microglobulin. (b) As one increases peritoneal Kt/Vurea, there may not be a corresponding increase in clearance of larger solutes such as β2-microglobulin, whereas with residual renal clearance, as Kt/Vurea increases, the clearance of other solutes may increase to the same degree. In fact, even with advanced CKD and severe reductions in GFR, there is relatively more removal of middle molecules than small solutes when compared to the removal by PD (49). It is well recognized that β2-microglobulin levels are lowest in patients with RRF (50,51,52). It has been shown that increasing instilled volume is likely to relieve clinical signs and symptoms of uremia (53), although the major effect is to increase small solute, not middle molecular weight solute clearances (FIGURE 12.2). It is known that once on 24 h/d of peritoneal dwell time, maneuvers that result in a further increase in small solute clearance tend to have little influence on the clearance of other solutes (54,55). Perhaps alternative PD therapies such as those associated with continuous flow technologies, which appear to offer an increase in β2-microglobulin clearance over standard technologies, will be beneficial (56). (c) Residual renal clearance may allow better control of BP and volume than what is typically achieved in anuric PD patients. (d) It may be that intrinsically healthier patients keep their RRF longer, and they have better survival because they are healthier and not because of anything that the kidneys are contributing. (e) It is important to remember that the effect of dialysis is always a constant balance between benefit and toxicity. Is it possible that one can increase the toxicity of the therapy when increasing instilled volume or when attempting to increase UF with current therapies? When using 2.5-L exchanges versus 2.0-L exchanges, there is increased glucose absorption from the peritoneal cavity. (f) There may be unrecognized intrinsic “anti-inflammatory” effect of functioning renal parenchyma (perhaps by the proximal tubules) that has been described in the general nondialysis population, which may also apply to RRF in those on dialysis. Studies in the general population have shown that loss of kidney function is associated with an increased risk of cardiovascular (CV) death, in a way that cannot be fully explained by “conventional” risk factors (57).
Interestingly, neither a prospective multicenter study in The Netherlands (47) nor data from the ADEMEX study (35) was able to show an association between dose of PD and benefit in quality of life. In these studies, however, there was a correlation between the amount of RRF and quality of life.
Because of the observational cohort data reviewed in the preceding text, it is important to preserve RRF when possible. One should avoid the use of nephrotoxins (such as NSAIDs, intravenous contrast dye, prolonged aminoglycoside use) whenever possible. In an open label controlled trial of 60 patients on CAPD randomized to ramipril 5 mg daily versus no additional treatment, residual Glomerular Filtration Rate (rGFR) at 1 year (primary outcome) was higher among those randomized to receive ramipril (adjusted GFR: 1.72 vs. 0.64 mL/min). There also was less likelihood of anuria (58). Similarly, in a prospective randomized trial of 34 CAPD patients randomized to valsartan (40 to 80 mg/d; n = 18) or no additional treatment (n = 16), better preservation of residual Ccr and urine volume were observed after 2 years in the valsartan group (59). Hence, the last KDOQI guidelines recommended “use of ACE inhibitors or angiotensin II inhibitors in PD patients who need an antihypertensive medication and that there use be considered for renal protection among normotensive patients.”
 IMPACT OF NUTRITIONAL STATUS ON PATIENT OUTCOME
It is well known that nausea, vomiting, and appetite suppression are symptoms of uremia and patients with uremia tend to have decreased DPI (60). Furthermore, spontaneous DPI decreases as residual kidney GFR decreases to less than 50 to 25 mL/min (61). These tendencies may be exacerbated during the period before the initiation of dialysis when many patients are not only anorexic but also acidotic and often treated with low-protein “kidney protective” diets. Consequently, patients may exhibit signs of protein malnutrition when they present for dialysis. A more “timely” start of dialysis may prevent this.
As a result of these observations, the working hypothesis has been that underdialysis or uremia leads to a decreased appetite, malnutrition, and decreased albumin synthesis. However, cross-sectional studies have provided contradictory results regarding the potential association between nutrition and dialysis dose (15,62–65). Some investigators believe that this relationship is simply mathematical coupling of data (66). Prospective studies, however, have demonstrated that in appropriate cohorts of patients, increasing the dose of dialysis tended to result in an increase in normalized protein equivalent of nitrogen appearance (nPNA) values, an increase in energy intake (31), and increase in percent lean body mass (LBM). These findings are in accordance with the observation that the relationship between dose of dialysis and protein intake seems to level off at a weekly Kt/Vurea level greater than approximately 1.9 (67,68) and are the basis for the clinical recommendation that suggests that a malnourished dialysis patient may be malnourished because of “underdialysis.”
Studies in both ESRD (69–73) and non-ESRD (74) patients have shown that one of the most important predictors of a patient’s relative risk of death is the patient’s underlying nutritional status. In HD patients, as the serum albumin decreases from the reference value of 4.5 to 4.0 g/dL to an albumin of less than 2.5 g/dL, the risk of death increased to 18 times that of the reference group (68). Malnutrition is also a significant risk factor for mortality and hospitalizations in chronic PD patients (75,76). Estimates of malnutrition in chronic PD patients ranges from 40% to 76%, with the variability in prevalence due to differing definitions of malnutrition as well as differences in the patient population studied (77–79). There are few studies that provide data on longitudinal changes in nutritional parameters. A prospective study performed in 118 patients who were started on PD found that mean serum albumin levels increased by approximately 0.2 g/dL over 24 months, nPNA declined by approximately 0.1 g/kg/24 h, whereas BMI and body fat were essentially unchanged (80).
The link between malnutrition and poor clinical outcome was not established using serum albumin alone as a marker for nutritional status. Other surrogates for nutritional status such as loss of muscle mass as indicated by lower serum creatinine levels, lower creatinine generation rates, or total body nitrogen levels as well as low serum albumin levels, low prealbumin levels, and subjective global assessment (SGA) score are all good predictors of morbidity and mortality.
These data suggest that death risk is related to nutritional status, a parameter that may be influenced by a patient’s total small solute clearance. However, it is important to remember that nutritional status is dependent not only on the prevention of or treatment of uremia but also on many non–ESRD-related factors (comorbid diseases, depression, gastroparesis, etc.). It is now noted that malnutrition can be reflective of poor nutritional intake, inflammation (81–83), or both (84,85). Serum albumin levels are known to be an acute phase reactant, decreasing in the face of inflammation. C-reactive protein (CRP) levels are abnormally high in most PD patients, and there is a direct association between elevated CRP levels and increased rates of mortality (86,87) and CV disease (88–90).
The International Society for Renal Nutrition and Metabolism (ISRNM) published standardized criteria for the diagnosis of protein-energy wasting in 2008. Those criteria define a serum albumin concentration of less than 3.8 g/dL, not an uncommon finding in a PD patient, as consistent with protein-energy wasting (91). Using the plasma albumin concentration, creatinine production, or other nutritional parameters, historical publications have estimated that 40% to 66% of PD patients in the United States are malnourished (75,77), whereas in a more recent cohort study using the ISRNM definition of protein-energy wasting (serum albumin of <3.8 g/dL), it was noted that 63% of PD patients compared to 55% of HD patients were malnourished (92). The ISRNM has suggested that there are four categories of protein-energy wasting. These are (a) evidence of biochemical abnormalities, (b) reduced body mass, (c) reduced muscle mass, and (d) unintentionally low dietary caloric intake.
Dialysis itself is associated with unique metabolic and nutritional problems that may cause one of the four conditions listed by the ISRNM. As mentioned earlier, they could be “underdialyzed” which may suppress appetite. It has been noted that PD patients often have a decreased appetite and early satiety (93,94). Perhaps, this is due to the presence of dialysate in abdomen which imparts a feeling of fullness, perhaps related to the continuous infusion of glucose which may suppress appetite. PD patients typically lose 5 to 15 g of protein and 2 to 4 g of amino acids per day in their dialysate (95). These losses amount to a net loss equivalent to 0.2-g protein/kg/d and tend to be higher in rapid transporters than in low transporters (96). They also are increased during episodes of peritonitis (97), at times doubling even after a mild episode. Although peritoneal losses of protein may correlate with serum albumin levels, they do not seem to correlate with other surrogates for nutritional status of chronic PD patients (98). The PD fluids may cause a chronic inflammatory state. Finally, one must remember, many new dialysis patients still have significant urine volumes and may have proteinuria causing a low albumin.
 MEASUREMENTS OF NUTRITIONAL STATUS
Of the readily available measures of nutritional status, serum albumin levels, protein equivalent of nitrogen appearance (PNA), and SGA scores have traditionally been used.
Serum Albumin Levels
Serum albumin levels, in part a reflection of visceral protein storage, predict patient outcome in populations with ESKD, no matter if obtained at the initiation of therapy (14,99) over the duration of dialysis (100) or measured at a stable period while on dialysis (101,102). Different assays for serum albumin give markedly different results (103). The Bromocresol green assay is preferred. Using this, the mean serum albumin level in 1,202 PD patients in late 1994/early 1995 was 3.5 g/dL (104). In an individual PD patient, the significance of an isolated serum albumin level must be viewed with caution. An isolated low level does not necessarily predict a high risk of death or malnutrition. Levels must be followed up over time and interpreted in context of other patient-related issues such as trends in the level, transport type, solute clearance, comorbid diseases, and so on.
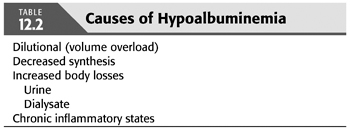
We now have a better understanding of the causes of hypoalbuminemia. They are multifactorial (TABLE 12.2). When evaluating an individual patient, all causes must be considered, including the possibility that a chronic inflammatory state exists. Evolving data suggests that ESKD or perhaps the treatment of ESKD represents a chronic inflammatory state. During PD, the peritoneal cavity is repeatedly exposed to unphysiologic fluids (105,106), which may (107) or may not (108) induce a chronic inflammatory state.
Dietary Protein Intake
Most (95%) nitrogen intake in humans is in the form of protein. Therefore, when the patient is in a steady state (not catabolic or anabolic), total nitrogen excretion multiplied by 6.25 (there are approximately 6.25 g of protein per gram of nitrogen) is thought to be an estimation of a person’s DPI (109). Estimated DPI is calculated from urea nitrogen appearance (UNA) in dialysate and urine. Multiple equations have been derived, some of which have been validated in CAPD (not NIPD) patients (PNA = PCR + protein losses) (TABLE 12.3). These estimations were initially called the protein catabolic rate (PCR). However, PCR actually represents the amount of protein catabolism exceeding synthesis required to generate an amount of nitrogen that is excreted. PCR is actually a net catabolic equivalent. Therefore, because these calculations are based on nitrogen appearance, the term is more appropriately called the PNA.
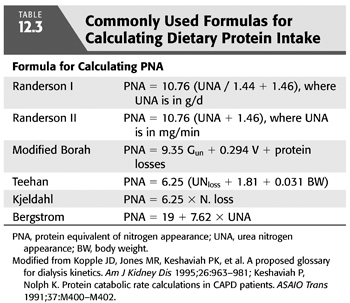
Keshaviah and Nolph (110) have compared these formulas and recommended the Randerson equation (111), where PNA = 10.76 (UNA + 1.46), and UNA is in milligram per minute, or PNA = 10.76 (UNA / 1.44 + 1.46), and UNA is in gram per day. These equations assume that the patient is in a steady state where UNA = urea nitrogen output which equals urea generation. The Randerson equation also assumes that the average daily protein loss in the dialysate is 7.3 g/d. In dialysis patients with substantial urinary or dialysate protein losses, these direct protein losses must be added to the equation to yield a true PNA. Most societies had historically recommended monitoring a patient’s estimated DPI over time to assure adequate nutritional status. This was not recommended in the most recent KDOQI guideline for adequacy of PD. If used, a baseline PNA should be obtained during training. These should then be recalculated every 4 to 6 months using the same 24-hour dialysate and urine collections used to monitor solute clearances. Decreasing values would then suggest a decreasing protein intake. One cause for this may be a suboptimal total solute clearance.
For comparison purposes, it is recommended that PNA be normalized for patient size (nPNA). The weight to use for that normalization is contested. Depending on what weight is used in calculating nPNA, there may or may not be a statistical relationship between clinical evidence of malnutrition and nPNA values below target. The PNA normalized by actual weight tends to be high or may appear to be increasing over time in malnourished individuals who are losing body weight if normalized (divided) by a smaller malnourished weight when compared to the patient’s baseline weight (112). This fact is important not only for evaluating patient to patient comparisons but more importantly when comparing serial measurements in an individual patient. The DOQI working group and others have recommended using standard weight or V/0.58 for normalization (113). In this case, the weight used for normalization does not change over time so that nPNA is more likely to reflect actual changes in DPI. Although most guidelines recommend monitoring estimated nPNA over time, looking for changes, it has been suggested that in cross-sectional analysis that the absolute amount of protein intake, not nPNA, correlated best with outcome and signs of malnutrition.
Data from the Centers for Medicare & Medicaid Services–Clinical Performance Measures (CMS–CPM) project for the year 2000 found that in chronic PD patients, the mean nPNA was 0.95 ± 0.31 g/kg/d, their normalized creatinine appearance rate was 17 ± 6.5 mg/kg/d, and the mean percentage of LBM was 64% ± 17% of actual body weight (ABW) (114).
There is some controversy as to what amount of DPI, in terms of grams of protein per kilogram of body weight, is needed to maintain positive nitrogen balance in PD patients. Early studies suggested that a DPI of at least 1.2 g/kg/d was needed to maintain nitrogen balance (115,116), a value considerably higher than that recommended for normal individuals. The 2001 NKF Clinical Practice DOQI guidelines recently recommended a DPI for chronic PD patients of 1.2 to 1.3 g/kg/d (117). Cross-sectional studies by Bergstrom and Lindholm (64) and Nolph (118) suggest that their patients who show no signs of malnutrition seem to eat less (0.99, 0.88 g protein/kg/d, respectively). The results are likely due to variations in the patient populations studied, historical dietary patterns, and amounts of RRF present. Therefore, several investigators have proposed that the daily protein intake in these patients should be in the range of 0.9 to 1.1 g/kg/d (119,120). It is interesting to note that the 2006 KDOQI guidelines do not have a guideline for protein intake due to the fact that there are no recent PRCTs that have evaluated the effect of increasing protein intake on relative risk of death.
Patients undergoing chronic PD should target a total daily energy intake of at least 35 kcal/kg/d for patients who are younger than 60 years and 30 kcal/kg for patients 60 years or older (117,121,122). This includes both dietary intake and the energy intake derived from glucose absorbed from the peritoneal dialysate. Many patients will typically eat less (122,123). Food supplements, enteral tube feedings, and both intradialytic and total parenteral nutrition have been used to treat malnutrition (124). Percutaneous endoscopic gastrostomy tubes should be used cautiously, however, as their use has been associated with a high rate of peritonitis. In addition, bicarbonate supplementation can result in improvements in weight and BMI (125). It is important to note however that for many PD patients, the dialysate glucose that is absorbed is a significant portion of their total caloric intake.
Subjective Global Assessment Score
One instrument that assesses nutritional status, the SGA score (126) has been modified for PD and was shown to be a valid estimate of nutritional status in PD patients (127). In the CANUSA study, a modified SGA using a 7-point scale addressing four items (weight change, anorexia, subcutaneous tissue, and muscle mass) predicted outcome (14). On multivariate analysis, poorer SGA scores were associated with a higher relative risk of death. It is recommended that this simple test be obtained sequentially (twice a year) in PD patients to evaluate nutritional status. If a decline is noted, evaluate for comorbid diseases and consider a suboptimal total solute clearance as the cause.
Possible Interventions for Suspected Malnutrition
Possible interventions when albumin is low include increasing the dialysis dose if “underdialysis” is suspected; restricting dietary sodium intake, water intake, or consider use of diuretics to increase urine volume and minimize use of hypertonic glucose if satiety from glucose is suspected (remember that the absorbed glucose is actually a source of calories); treating any poor dentation that is present; and if available, considering use of alternative dialysate solutions such as amino acid solutions. Initial observations suggest that use of amino acid–containing fluids can lead to an elevation in the plasma albumin concentration and improvement in other biochemical parameters of nutritional status (128,129); however, data are conflicting as to if this can be sustained without side effects if more than one exchange per day are used. Consensus exists that if used only once a day, they are generally safe and are associated with daily protein and amino acid gains that exceed daily amino acid losses although they may not significantly improve albumin concentrations (130).
 MAJOR DETERMINANTS OF TOTAL SOLUTE CLEARANCE
Small solute clearance is typically measured in terms of urea kinetics (Kt/Vurea) and Ccr/1.73 m2. Guidelines (reviewed earlier) recommend attaining certain minimal “total” (peritoneal and residual kidney) clearances per week.
Residual Renal Function
Creatinine and urea are used as surrogate markers for small molecular weight clearance. When calculating the Ccr due to RRF, it is important to remember that at very low GFRs or Ccrs, much of the creatinine in the urine is due to proximal tubular secretion rather than actual glomerular filtration. As a result, traditional measurements of Ccr (24-hour collection) can significantly overestimate the true GFR. If using creatinine kinetics as the surrogate, it is recommended that the sum of the measured urea clearance and Ccr divided by 2 be used to approximate underlying residual kidney GFR. This amount in liters per day is then added to the daily peritoneal Ccr to determine total daily Ccr. The clearance of most other small molecular weight substances such as urea by the kidney only involves glomerular filtration and little to no tubular secretion. Therefore, if one is measuring dialysis dose using urea kinetics, no adjustment for tubular secretion is needed.
Each 1 mL/min of corrected residual kidney Ccr (measured as GFR) adds approximately 10 L/wk/1.73 m2 of Ccr for the average patient with a BSA of 1.73 m2. Similarly, each 1 mL/min of residual renal urea clearance adds approximately 0.25 Kt/Vurea units to the total weekly Kt/Vurea urea for a 70-kg male. At the initiation of dialysis, residual kidney function often represents a significant amount of the recommended minimal solute clearances. In one report, the residual kidney component represented 39% of total clearance (131), while representing 25% of the total in another review (132). If a patient starts PD with a residual kidney Ccr of 5 mL/min (not an unusual scenario), the corrected kidney CCr (GFR) may be approximately 4 mL/min, adding approximately 40 L/wk of Ccr to overall solute clearance, whereas the residual kidney urea clearance might be approximately 3 mL/min (a weekly RRF Kt/Vurea of about 0.75 for a 70-kg male). In this instance, a patient may only need to do one or two exchanges per day at the start of dialysis.
Some have suggested that RRF is better preserved with PD than with HD (123–136). It is acknowledged that residual renal clearance is an important supplement to that provided by dialysis and is an important predictor of outcome. As RRF decreases, total clearance expressed as Kt/Vurea or Ccr will decrease unless replaced by an increase in the peritoneal component. Tattersall et al. (137,138) have shown that it was possible to compensate for declining RRF and maintain minimal solute clearance goals by increasing dialysis dose as residual kidney function declines. This is a common practice in PD units where “incremental dialysis” is prescribed and dialysis dose increased over time as RRF decreases.
Peritoneal Membrane Transport Characteristics
The first step in tailoring an individual patient’s PD prescription is to know that patient’s peritoneal membrane transport characteristics. Unlike HD, where the physician has a wide menu of dialyzers to choose from for each individual patient, PD patients are “born” with their membrane. At present, there is no clinically proven way to favorably change membrane transport or predict transport type before beginning PD.
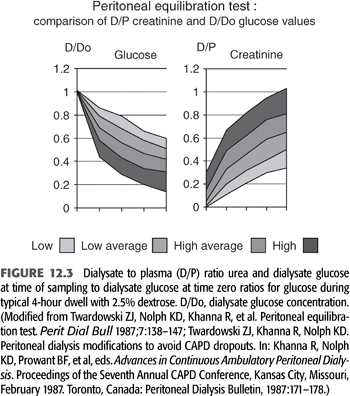
The peritoneal equilibration test (PET) (139) is the standard way to characterize peritoneal membrane transport properties of an individual patient. It is a standardized test in which, after an overnight dwell, 2 L of 2.5% dextrose dialysate is instilled (time 0) and allowed to dwell for 4 hours. Dialysate urea, glucose, sodium, and creatinine are measured at time 0, and after 2 and 4 hours of dwell time. Serum values are drawn after 2 hours. Dialysate is drained after 4 hours of dwell, and drain volume (DV) is measured. Dialysate to plasma (D/P) ratios of creatinine and urea are determined after 2 and 4 hours of dwell, as is the ratio of dialysate glucose at a particular drain time to the initial dialysate glucose concentration (D/Do) (FIGURE 12.3). On the basis of published data, the patient’s peritoneal membrane type is then characterized as high, high average, low average, and low. In a review of 806 patients, 10.4% were found to be high transporters, 53.1% high average, 30.9% low average, and 5.6% low transporters (140). Once characterized, the PD prescription that would best match the patient’s transport characteristics can be then chosen.
Related posts:
Stay updated, free articles. Join our Telegram channel

Full access? Get Clinical Tree


