Urodynamic Studies: Introduction
Urodynamic study is an important part of the evaluation of patients with lower urinary tract obstruction, voiding dysfunctions, urinary incontinence, and neuropathic disorders involving the lower urinary tract. Formerly, the examiner simply observed the act of voiding, noting the strength of the urinary stream, and drawing inferences about the possibility of obstruction of the bladder outlet. In the 1950s, it became possible to observe the lower urinary tract by fluoroscopy during the act of voiding, and in the 1960s, the principles of hydrodynamics were applied to lower urinary tract physiology. In the 1970s, videourodynamic was introduced, where fluoroscopy was incorporated with the pressure measurements to adequately assess both anatomy and function.
The field of urodynamic now has clinical applications in evaluating voiding problems resulting from lower urinary tract disease.
The nomenclature of the tests used in urodynamic studies is not yet settled, and the meanings of urodynamic terms are sometimes overlapping or confusing. In spite of these difficulties, urodynamic tests are extremely valuable. Symptoms elicited by the history or by physical, endoscopic, or even radiographic examination usually delineate the anatomic findings, but the function often must be investigated further by urodynamic tests so that therapy can be devised that is based on an understanding of the altered physiology of the lower urinary tract.
As is true of many high-technology testing procedures (eg, electrocardiography, electroencephalography), urodynamic tests have the greatest clinical validity when their interpretation is left to the treating physician, who should either perform or closely supervise the study or be responsible for correlating all of the findings with personal clinical observations.
Functions Relevant to Urodynamics and Tests Applicable to Each
Urodynamic studies in concert with an accurate history and physical examination are the most useful clinical tools available for the evaluation of the lower urinary tract and can provide useful clinical information about the function of the urinary bladder, the sphincteric mechanism, and the voiding pattern itself.
Bladder function. This can be evaluated by simple cystometrogram (CMG) that measures vesical pressure as a function of bladder volume. This can provide important information on cystometric bladder capacity, bladder sensation, bladder compliance, and the presence of involuntary bladder contraction and bladder contractility.
Sphincteric function depends on two elements: the smooth muscle sphincter and the voluntary sphincter. The activity of both elements can be recorded urodynamically by measuring urethral pressure profile or by recording sphincter electromyography.
The act of voiding is a function of the interaction between bladder and sphincter, and the result is the flow rate. The flow rate is one major aspect of the total function of the lower urinary tract. It is generally recorded in milliliters per second as well as by total urine volume voided. The simultaneous recording of bladder activity (by intraluminal pressure measurements), sphincteric activity (by electromyography or intraluminal urethral pressure measurements), and flow rate reveals interrelationships among the three elements. Each measurement may give useful information about the normality or abnormality of one specific aspect of lower urinary tract function. A more complete picture is provided by integrating all the three lower tract elements for simultaneous comparison. This comprehensive approach may involve synchronous recordings of variable pressures, flow rate, volume voided, and electrical activity of skeletal musculature around the urinary sphincter (electromyography), along with fluoroscopic imaging of the lower urinary tract. The multiple pressures recorded are quite variable and usually include intravesical pressure, intraurethral pressure at several levels, intra-abdominal pressure, and anal sphincteric pressure as a function of muscular activity of the pelvic floor.
The techniques of urodynamic study must be tailored to the needs of specific patients. Each method has advantages and limitations depending on the requirements of the study. In one patient, results of a single test might be sufficient to establish the diagnosis and suggest appropriate therapy; in another, many more studies might be necessary.
Physiologic and Hydrodynamic Considerations
Because urinary flow rate is the product of detrusor action against outlet resistance, a variation from the normal flow rate might reflect dysfunction of either. The normal flow rate from a full bladder is about 20–25 mL/s in men and 25–30 mL/s in women. These variations are directly related to the volume voided and the person’s age. Obstruction or detrusor dysfunction should be suspected in any adult voiding with a full bladder at a rate of <15 mL/s. A flow rate <10 mL/s is considered definite evidence of obstruction or detrusor dysfunction. Occasionally, one encounters “supervoiders” with flow rates far above the normal range. This may signify low outlet resistance but is of less concern clinically than obstruction. This phenomenon is more commonly seen in women.
Outlet resistance is the primary determinant of flow rate and varies according to mechanical or functional factors.
Functional, outlet resistance is primarily related to sphincteric activity, which is controlled by both the smooth sphincter and the voluntary sphincter. Overactivity of the smooth sphincter is very rare and essentially nonexistent in females. It is rarely seen in men in association with hypertrophy of the bladder neck due to neurogenic dysfunction or distal obstruction. However, such cases must be evaluated before this conclusion is reached.
On the other hand, increased voluntary sphincteric activity is not uncommon. It is often neglected as a primary underlying cause of increased sphincteric resistance. It is manifested either as lack of relaxation or as actual overactivity during voiding. The normal voluntary sphincter provides adequate resistance, along with the smooth sphincter, to prevent escape of urine from the bladder, but it should completely relax during the act of voiding. If the voluntary sphincter does not relax during detrusor contraction, partial functional obstruction occurs. Overactivity of the sphincter, resulting in increased outlet resistance, is usually a neuropathic phenomenon. However, it can also be functional, resulting from irritative phenomena such as infection or other factors—chemical, bacterial, hormonal, or, even more commonly and often not appreciated, psychological and in patients who are infrequent voiders. This is commonly referred to as pelvic floor dysfunction. This is a spectrum of disease that varies from mild difficulty in voiding associated with incomplete emptying and some pelvic/perineal and genital discomfort to extreme cases of urinary retention known as Fowler’s syndrome.
Mechanical factors resulting in obstruction to urine flow are the easiest to identify by conventional methods. In women, they may take the form of large cystoceles, urethral kinks, or, most commonly, iatrogenic scarring, fibrosis, and compression from previous vaginal or periurethral operative procedures. Mechanical factors in men are well known to all urologists; the classic form is benign prostatic hypertrophy. Urethral stricture from various causes and posterior urethral valves are other common causes of urinary obstruction in men, and there are many others.
Normal voiding with a normal flow rate is the product of both detrusor activity and outlet resistance. Complete sphincteric relaxation usually precedes detrusor contraction by a few seconds, and when relaxation is maximal, detrusor activity starts and is sustained until the bladder is empty. A high intravesical pressure resulting from detrusor contraction is usually an indication of increased outlet resistance and is not necessary to initiate normal voiding.
The sequence just described is not essential for normal flow rates. The flow rate may be normal in the absence of any detrusor contraction if sphincteric relaxation is assisted by increased intra-abdominal pressure from straining. Persons with weak outlet resistance and weak sphincteric control can achieve a normal flow rate by complete voluntary sphincteric relaxation without detrusor contraction or straining. A normal flow rate can be achieved in spite of increased sphincteric activity or lack of complete relaxation if detrusor contraction is increased to overcome outlet resistance.
Because a normal flow rate can be achieved in spite of abnormalities of one or more of the mechanisms involved, recording the flow rate alone does not provide insight into the precise mechanisms by which it occurs. Distinction between patterns of flow can be difficult. For practical purposes, if the flow rate is adequate and the recorded pattern and configuration of the flow curve are normal, these variations may not be clinically significant except in rare cases.
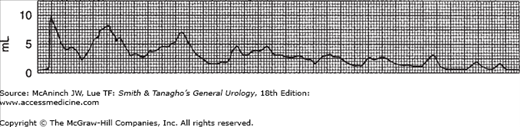
The study of urinary flow rate itself is usually called uroflowmetry. The flow rate is generally identified as maximum flow rate, average flow rate, flow time, maximum flow time (the time elapsed before maximum flow rate is reached), and total flow time (the aggregate of flow time if the flow has been interrupted by periods of no voiding) (Figure 29–1). The flow rate pattern is characterized as continuous or intermittent, etc.
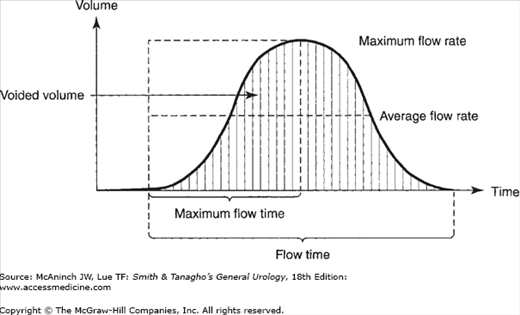
A normal flow pattern is represented by a bell-shaped curve (Figure 29–1). However, the curve is rarely completely smooth; it may vary within limits and still be normal. Flow rate can be determined by measuring a 5 seconds’ collection at the peak of flow and dividing the amount obtained by 5 to arrive at the average rate per second. This rough estimate is useful, especially if the flow rate is normal and the values are above 20 mL/s.
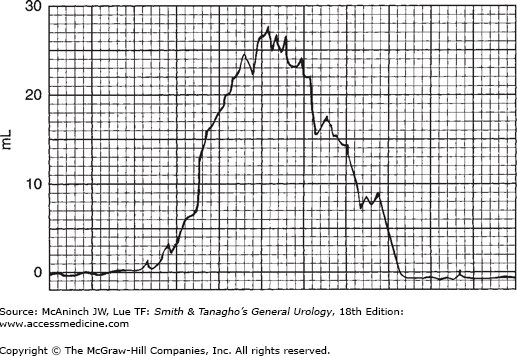
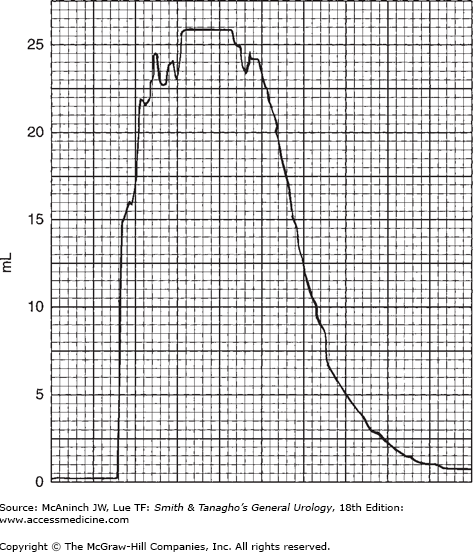
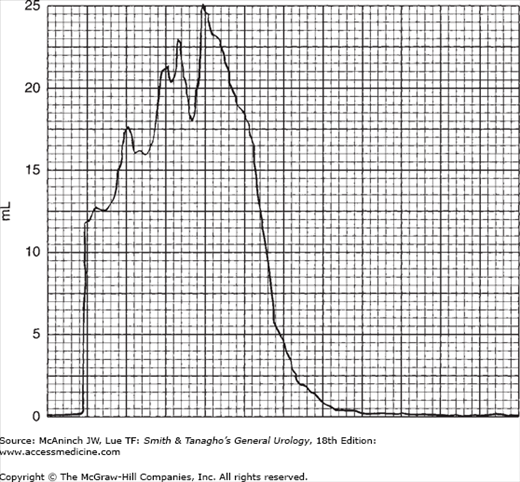
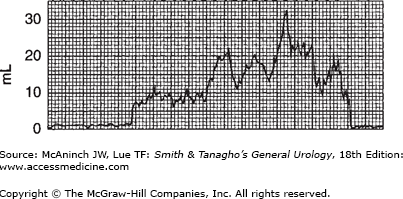
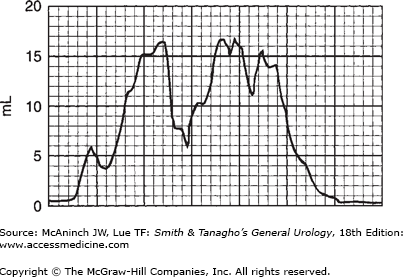
In modern practice, the flow rate is more often recorded electronically: The patient voids into a container on top of a measuring device that is connected to a transducer, the weight being converted to volume and recorded on a chart in milliliters per second. Figure 29–2 is an example of such a recording from a normal man. The general bell-shaped curve is quite clear, and the tracing shows all of the values discussed previously: total flow time, maximum flow time, maximum flow rate, average flow rate, and total volume voided. Occasional supervoiders can exceed the limits of the chart, but this is usually not of clinical concern (Figure 29–3). A possible variation in the bell appearance is seen in Figure 29–4.
The overall appearance of the flow curve may disclose unsuspected abnormalities. In Figure 29–5, for example, flow time is greatly prolonged. Maximum flow rate may not be low, but the average flow rate is very low—though the maximum flow rate is at one point within the normal range. Such fluctuation in flow rate is most commonly related to variations in voluntary sphincteric activity. In Figure 29–6, this pattern is extreme: Maximum flow rate never exceeds 15 mL/s, and average flow rate is about 10 mL/s, which is indicative of obstruction. (Again, this fluctuation in pattern probably reflects sphincteric hyperactivity.)
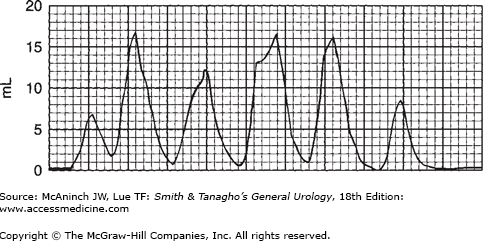
The flow rate pattern reveals a great deal about the forces involved. For example, if the patient is voiding without the aid of detrusor contractions—primarily by straining—this can be easily deduced from the pattern of the flow rate. Figure 29–7 shows an example of intermittent voiding, primarily by straining, with no detrusor activity, and at a rate that sometimes does not reach the usual peaks. With experience, one becomes expert at detecting the mechanisms underlying abnormalities in flow rate. For example, in Figure 29–5, the maximum flow rate is in the normal range, the average flow rate is slightly low, and the curve has a general bell pattern, yet brief partial intermittent obstructions to flow can be readily interpreted as due to overactivity of the voluntary sphincter, a mild form of detrusor/sphincter dyssynergia (see discussion following).
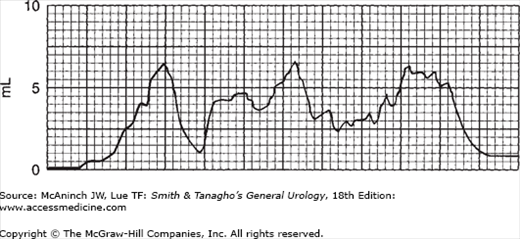
Flow rates in mechanical obstruction are totally different, classically in the range of 5–6 mL/s; flow time is greatly prolonged, and there is sustained low flow with minimal variation (Figure 29–8). Figure 29–9 is a striking example of a curve for a patient with benign prostatic hypertrophy. No simultaneous studies are needed with such a pattern, since the pattern is obviously one of mechanical obstructions.
Reduced flow rate in the absence of mechanical obstruction is due to some impairment of sphincteric or detrusor activity. This is seen in a variety of conditions, for example, normal detrusor contraction with no associated sphincteric relaxation and normal detrusor contraction with sphincteric overactivity, which is more serious. These two entities are commonly referred to as detrusor/sphincter dyssynergia. If with detrusor contraction the sphincter does not relax and open up or (worse) if it becomes overactive, urine flow is obstructed (ie, flow rate is reduced and of abnormal pattern). Reduced flow rate may occur even with increased detrusor activity if the latter is not adequate to overcome sphincteric resistance.
So many variations are possible in the shape of the flow curve—no matter how accurately the flow is recorded or how often the study is repeated to confirm abnormal findings—that it is beneficial to relate it to simultaneous recordings, such as of bladder pressure, pelvic floor electromyography, urethral pressure profile, or simply cinefluoroscopy. Nevertheless, by itself it can be one of the most valuable urodynamic studies undertaken to evaluate a specific type of voiding dysfunction. Flowmetry is not only of diagnostic value but also of valuable in follow-up studies and in deciding on treatment. In some cases, however, flowmetry alone does not provide enough data about the abnormality in the voiding mechanism. More information must then be obtained by evaluation of bladder function.
The basic factors of normal bladder function are bladder capacity, compliance, sensation, contractility, voluntary control, and response to drugs. All of them can be evaluated by cystometry. If all are within the normal range, bladder physiology can be assumed to be normal. Evaluation of every factor has its own implication and, before a definitive conclusion is reached, must be examined in the light of associated manifestations and findings.
Cystometry can be done by either of two basic methods: (1) allowing physiologic filling of the bladder with secreted urine and continuously recording the intravesical pressure throughout a voiding cycle (starting the recording when the patient’s bladder is empty and continuing it until the bladder has been filled—at which time the patient is asked to urinate—and voiding begins) or (2) by filling the bladder with water and recording the intravesical pressure against the volume of water introduced into the bladder.
With the first (physiologic filling) method, the assessment of bladder function is based on voided volume (assuming that the presence of residual urine has been ruled out). The second method permits accurate determination of the volume distending the bladder and of the pressures at each level of filling, yet it has inherent defects: fluid is introduced rather than naturally secreted, and bladder filling occurs more rapidly than it normally does.
Bladder capacity: The maximum cystometric bladder capacity is the volume at which the patient feels he/she can no longer delay micturition, uninhibited detrusor contraction occurs leading to micturition or the intravesical pressure rises and the patient leaks. This is different from functional bladder capacity which is the maximum volume that the patient normally void. This is usually more relevant and is assessed from a voiding diary.
Bladder compliance reflects the ability of the bladder wall to expand to capacity with minimal changes in intravesical pressure. This expansile capability is contributed to by the smooth muscular, collagenous, and elastic components of the bladder submucosa and muscularis. The normally innervated bladder without any coexistent pathologic lesions retains this vesicoelastic capability during the storage phase of bladder activity.
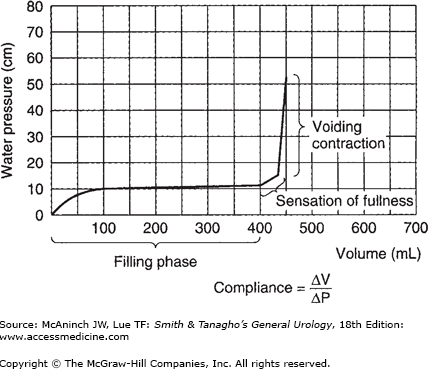
The CMG (Figure 29–10) is obtained during the phase of bladder filling; the volume of fluid in the bladder is plotted against the intravesical pressure to show bladder wall compliance to filling. The normal cystometric curve shows a fairly constant low intravesical pressure until the bladder nears capacity, then a moderate rise until capacity is reached, and then a sharp rise as voiding is initiated. Normally, the sensation of fullness is first perceived when the bladder contains 100–200 mL of fluid and strongly felt as the bladder nears capacity; the desire to void occurs when the bladder is full (normal capacity, 400–500 mL). However, the bladder has a power of accommodation; that is, it can maintain an almost constant low intraluminal pressure throughout its filling phase regardless of the volume of fluid present, and this directly influences compliance. As the bladder progressively accommodates larger volumes with no change in intraluminal pressure, the compliance values become higher (compliance = volume/pressure) (Figure 29–10).
The bladder normally shows no evidence of contractility or activity during the filling phase. However, once it is filled to capacity and the patient perceives the desire to urinate and consciously allows urination to proceed, strong bladder contractions occur and are sustained until the bladder is empty. The patient can of course consciously inhibit detrusor contraction. Both of these aspects of voluntary detrusor control must be assessed during cystometric study in order to rule out uninhibited bladder activity and to determine whether the patient can inhibit urination with a full bladder and initiate urination when asked to do so. The latter is occasionally difficult to verify clinically because of conscious inhibition by a patient who may be embarrassed by the unnatural circumstances.
Drugs are being used with increasing frequency in the evaluation of detrusor function. They can help to diagnose underlying neuropathy and to determine whether drug treatment might be of value in individual cases. Study of the relationship of bladder capacity to intravesical pressure and bladder contractility gives a rough evaluation of the patient’s bladder function. Low intravesical pressure with normal bladder capacity might not be significant, whereas low pressure with a very large capacity might imply sensory loss or a flaccid lower motor neuron lesion, a chronically distended bladder, or a large bladder due to myogenic damage. High pressure (usually associated with reduced capacity) that rises rapidly with bladder filling is most commonly due to inflammation, enuresis, or reduced bladder capacity. However, uninhibited bladder activity during this high-pressure filling phase might indicate neuropathic bladder or an upper motor neuron lesion.
The parasympathetic drug bethanechol chloride (Urecholine) is often used to assess bladder muscle function in patients with low bladder pressure associated with lack of detrusor contraction. No response to bethanechol suggests myogenic damage; a normal response indicates a bladder of large capacity with normal musculature; and an exaggerated response indicates a lower motor neuron lesion. The test has so many variables that it must be done meticulously to give reliable results.
Testing with anticholinergic drugs or muscle depressants may be helpful in the evaluation of uninhibited detrusor contraction or increased bladder tonus and low compliance. The information thus obtained can be useful in choosing drugs for treatment.
Intravesical pressure can be measured directly from the vesical cavity, either by a suprapubic approach or via a transurethral catheter. The pressure inside the bladder is actually a function of both intra-abdominal and intravesical pressure. Thus, true detrusor pressure is the pressure recorded from the bladder cavity (intravesical pressure) minus intra-abdominal pressure. This point is important because variations in intra-abdominal pressure may alter the recorded intravesical pressure, and if the recorded intravesical pressure is mistakenly considered to reflect only detrusor pressure and not increased intra-abdominal pressure due to straining as well, erroneous conclusions may be reached.
Whenever possible, intra-abdominal pressure should be recorded simultaneously with intravesical pressure, since there is no other way to determine the true detrusor pressure. Intra-abdominal pressure is usually recorded by a small balloon catheter inserted high in the rectum and connected to a separate transducer.
The most valuable part of the cystometric study is the determination of voiding activity or voiding contraction. The characteristics of intravesical pressure can be quite significant. Normally, voiding contractions are not high (20–40 cm of water); this magnitude of intravesical pressure is generally adequate to deliver a normal flow rate of 20–30 mL/s and completely empty the bladder if it is well sustained. A higher voiding pressure is indicative of possible increase in outlet resistance yet denotes an overactive, healthy detrusor musculature. Figure 29–11 shows a normal flow rate associated with normal detrusor contraction at a magnitude of 20 cm of water that is well sustained and of short duration and results in complete bladder emptying.
Figure 29–11.
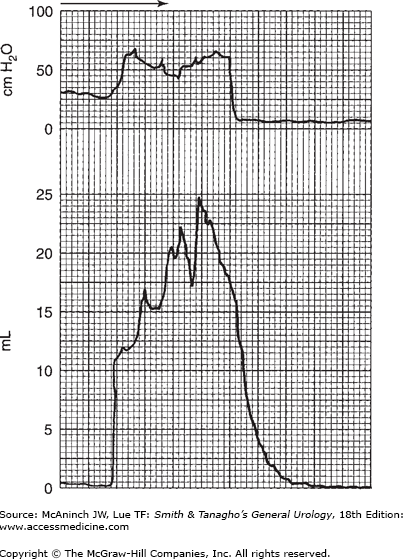
Simultaneous recording of voiding contraction and resulting flow rate. Note the normal range of intravesical pressure during voiding phase as well as adequate normal flow rate (shown in Figure 29–4). On the horizontal scale, one large square equals 5 seconds.
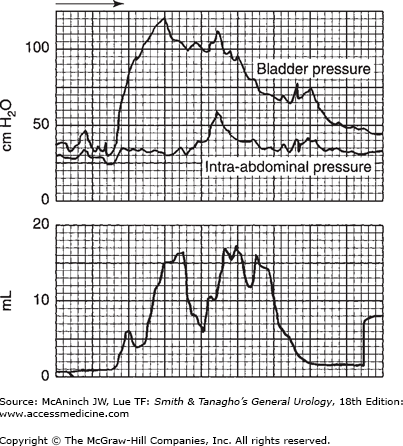
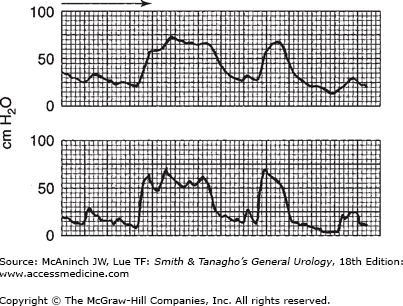
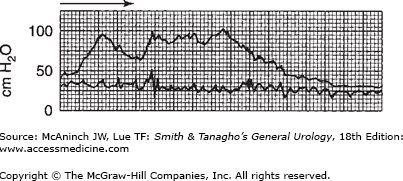
The quality of bladder pressure can also be informative, even without simultaneous recording of flow rate. In such cases, however, it is preferable to record flow rate under normal circumstances. A well-sustained detrusor contraction, high at initiation and sustained at normal values, is seen in Figure 29–12. In Figure 29–13, the voiding pressure is too high—there is an element of sphincteric dyssynergia triggering variations in voiding pressures and flow rate. Simultaneous recording of bladder and intra-abdominal pressures would provide more information. As suggested previously, recording the intravesical pressure alone does not give as much information as may be required, and increased intra-abdominal pressure might be mistaken for detrusor action. This situation is illustrated in Figure 29–14. The bladder pressure appears to indicate good detrusor function; nevertheless, simultaneous recording of intra-abdominal pressure makes it clear that all of the apparent changes in vesical intraluminal pressure in fact represent variations in intra-abdominal pressure.
Figure 29–12.
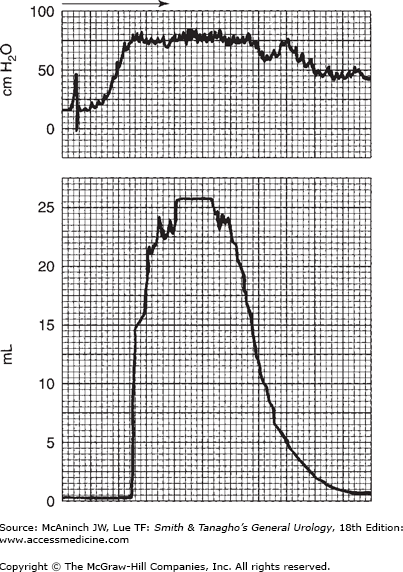
Recording of bladder pressure simultaneously with flow rate. Note the slightly higher intravesical pressure with high flow rate, which, at its maximum, is that of a supervoider (see Figure 29–3). On the horizontal scale, one large square equals 5 seconds.
Figure 29–13.
Simultaneous recording of flow rate and intra-abdominal pressure; intravesical pressure overlap in top recording. Note the very high voiding pressure. However, flow rate is relatively low, with some interruption most likely due to sphincteric overactivity. On the horizontal scale, one large square equals 5 seconds.
Figure 29–14.
Simultaneous recording of intra-abdominal and intravesical pressures. If one considers only intravesical pressure (upper recording), one might assume adequate detrusor contraction. Comparison with intra-abdominal pressure (lower recording) shows that they are almost identical and that there is no detrusor contraction at all.
Figure 29–15 shows the two pressures recorded on the same chart, on the same channel, by having the writing pen share the time between two transducers—one recording intra-abdominal pressure; the other, intravesical pressure.
The bladder capacity is normally 400–500 mL, but it can be reduced or increased in a variety of disorders and lesions (Table 29–1). Some common causes of reduced bladder capacity are enuresis, urinary tract infection, contracted bladder, upper motor neuron lesion, and defunctionalized bladder. Reduced capacity also may occur in association with incontinence and in postsurgical bladder. Increased bladder capacity is not uncommon in women who have trained themselves to retain large volumes of urine. Bladder capacity is increased also in sensory neuropathic disorders, lower motor neuron lesions, and chronic obstruction from myogenic damage. It is important to relate bladder capacity to the intravesical pressure (Table 29–2). Slight variations in bladder capacity with no change in bladder pressure might be of less significance than the reverse. What is usually of greatest significance is the bladder with reduced capacity associated with normal pressure or, more important, with increased pressure, or the bladder with large capacity associated with decreased pressure.
Causes of reduced bladder capacity |
Enuresis or incontinence |
Bladder infections |
Bladder contracture due to fibrosis (from tuberculosis, interstitial cystitis, etc) |
Upper motor neuron lesions |
Defunctionalized bladder |
Postsurgical bladder |
Neuropathic disorders |
Lower motor neuron lesions |
Megacystis (congenital) |
Chronic urinary tract obstruction |
Low intravesical pressure |
Normal capacity |
Large capacity |
Sensory deficits (diabetes mellitus, tabes dorsalis) |
Flaccid lower motor neuron lesions |
Large bladder (due to repeated stretching) |
High intravesical pressure |
Rapidly rising |
Reduced capacity |
Inflammation |
Enuresis |
Uninhibited contraction |
Uninhibited neurogenic bladder |
Upper motor neuron lesions |
Related posts:


Stay updated, free articles. Join our Telegram channel

Full access? Get Clinical Tree


