Ultrasonography and Nuclear Medicine
Frederic Rahbari-Oskoui
Andrew T. Taylor
William Charles O’Neill
Sonography and nuclear medicine are important tools in the evaluation of the kidneys and urinary tract. Due to its simplicity and ready availability, sonography is usually the initial imaging performed and, in many cases, the only examination required. The low cost and portability of modern equipment enable sonography to be an officebased or bedside procedure performed by the practitioner, adding to its convenience and attractiveness. Nuclear medicine can obtain important functional data and complements other imaging modalities that cannot provide this information. This functional assessment can be critical for clinical decisions and often avoids the necessity of invasive testing. This chapter reviews the advantages, disadvantages, and indications for each modality in the kidneys and urinary tract along with the basics of interpretation and common findings.
ULTRASONOGRAPHY
The introduction and extensive use of ultrasonography over the past four decades has dramatically simplified the diagnostic evaluation of the urinary tract. The acoustic properties, limited spectrum of pathology, and ease of visualization of the kidneys—coupled with the safety, simplicity, lack of radiation, and low cost—of sonography make it the initial modality of choice. The improved portability and affordability of equipment and availability of training provide an opportunity for nephrologists to become skilled at this technique, thereby enhancing the diagnosis and care of their patients.
Sonographic images are acquired by analyzing the amplitude and interval of reflected pulses of high-frequency sound. Time is converted to depth and amplitude is converted to brightness (echogenicity) to yield a pixel-based image. Highly reflective structures such as a stone appear bright and cast a dark, distal shadow. In contrast, fluid collections such as cysts do not reflect sound and appear dark but enhance the echogenicity of distal tissue (distal enhancement or through transmission).1 Tissues such as renal parenchyma have an intermediate echogenicity related to backscatter of sound from the microscopic architecture. Indications for ultrasound imaging of the kidneys and the bladder are diverse and include evaluation of acute renal failure, chronic kidney disease (CKD), cystic diseases, pain, hematuria, severe hypertension, urinary tract infections, and guidance for kidney biopsies.
Imaging and Normal Appearance of the Kidneys
The adult kidney contains several lobules, each consisting of a rim of cortex surrounding a medullary pyramid that terminates in a papilla protruding into a minor calyx. The lobules fuse in utero or shortly after birth in most individuals. The cortex between two pyramids is called a column of Bertin. Minor calyces converge into major calyces that, in turn, converge to form the renal pelvis. The portion of the kidneys that is not parenchyma or urinary space is the sinus, which, in adults, is filled with adipose tissue (Fig. 10.1). Longitudinal views of the kidney are obtained in the supine position with the probe positioned so that the upper pole appears on the left side of the image. In the longitudinal plane, the normal kidney has a characteristic oval shape with a hypoechoic (dark) rim of cortex and medulla surrounding the echogenic (bright) sinus fat2,3,4 that obscures the calyces and blood vessels (Fig. 10.2). The medullary pyramids are slightly less echogenic than the cortex2 and can often be discerned. They are particularly prominent when cortical echogenicity is increased. Transverse images are obtained perpendicular to the longitudinal axis and the kidney appears circular at each pole and C-shaped through the center due to the break in the parenchyma where the ureter and vessels enter, thereby providing the best views of the renal pelvis and hilum.
The appearance of the kidneys is subject to normal variations related primarily to incomplete fusion of the ranunculi. These include complete duplication of the collecting system, which appears as a band of cortex separating the sinus fat into two compartments (Fig. 10.3) and is present in 5% of kidneys, and hypertrophied columns of Bertin, where the cortex extends into the sinus but does not completely bridge
it (Fig. 10.4) and is present in 15% of kidneys.5,6 Junctional parenchymal defects are the most subtle manifestation of incomplete fusion, presenting as a wedge-shaped defect in the outer cortex filled with echogenic fat that is continuous with the renal sinus fat by a thin strand.6 In some individuals, the lobules fail to completely fuse and persist into adulthood. These so-called fetal lobulations appear as regularly spaced convexities, each containing a pyramid.7 Lobulation may reappear in chronic kidney disease due to atrophy of the columns of Bertin (Fig. 10.5).
it (Fig. 10.4) and is present in 15% of kidneys.5,6 Junctional parenchymal defects are the most subtle manifestation of incomplete fusion, presenting as a wedge-shaped defect in the outer cortex filled with echogenic fat that is continuous with the renal sinus fat by a thin strand.6 In some individuals, the lobules fail to completely fuse and persist into adulthood. These so-called fetal lobulations appear as regularly spaced convexities, each containing a pyramid.7 Lobulation may reappear in chronic kidney disease due to atrophy of the columns of Bertin (Fig. 10.5).
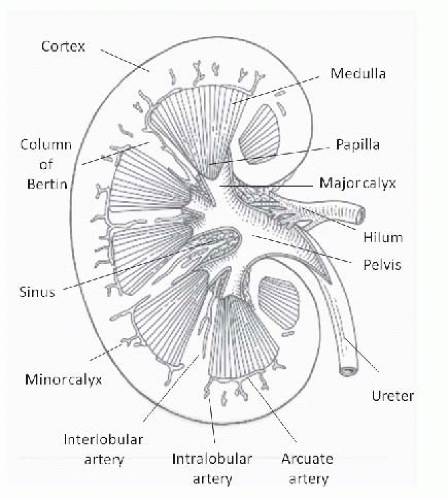 FIGURE 10.1 Intrarenal anatomy, midline coronal section. (Adapted from O’Neill WC. Sonographic evaluation of renal failure. Am J Kidney Dis. 2000;35:1021, with permission.) |
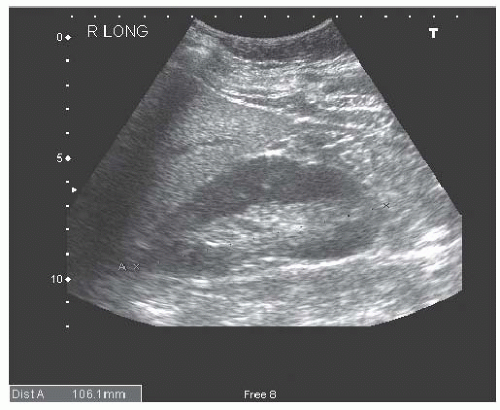 FIGURE 10.2 Longitudinal image of a normal right kidney. Compared to the liver, the renal parenchyma appears as a relatively hypoechoic, oval rim around the echogenic sinus fat. |
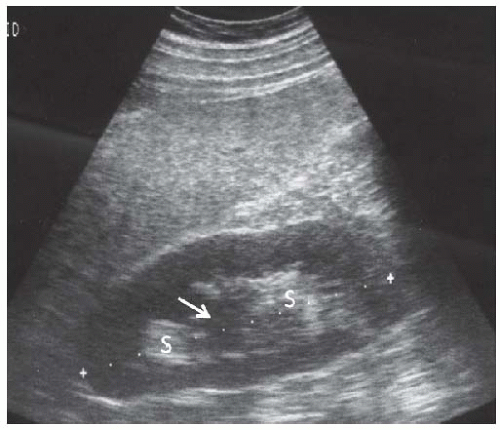 FIGURE 10.3 Duplication of the collecting system. Longitudinal view of the kidney showing a band of tissue ( arrow) demarcating two separate renal sinuses (S). |
Basis of Interpretation
Interpretation of the renal sonogram is based on kidney size and shape, cortical thickness and echogenicity, and the appear ance of the medullary pyramids, renal sinus, and the urinary space.
Size
The best measure of renal size is volume, which correlates well with glomerular filtration rate.8 But, due to the compounding nature of measurement errors in calculating
volume, and the good correlation between maximum kidney length and renal volume,9,10 maximum renal length is preferred for assessment of renal size on sonograms. Additional measurements in the transverse axes are very inaccurate and of no utility. Renal length averages 11 cm in adults,10 and 10 cm to 12 cm is a useful range for normal renal length at average body height. Because the variability in measurements is 5%,9 differences up to 1 cm may not be significant. The variability may be greater in children, comprising as much as 2 to 3 years in the comparison of kidney length to age.11 Kidney length correlates best with body height in both adults and children (Fig. 10.6A)10,12,13,14 and, after correction for body height, does not vary between sexes. Kidney length rapidly increases during the first year of life with a more gradual enlargement up to about 18 years14,15 (Fig. 10.6B). Progressive enlargement occurs during pregnancy that resolves by 12 weeks postpartum, due primarily to parenchymal enlargement—although some pelvocaliceal enlargement occurs, particularly in the right kidney.16 Proper interpretation of kidney size must take into account the effect of these nonpathologic factors. Compensatory hypertrophy is common in solitary kidneys in children (up to 80%-90% increase in volume),17,18 and after nephrectomy in adults (5%-30% increase).19,20 Enlargement of the kidneys occurs in nephritis and infiltrative diseases, often accompanied by a rounded shape and increased echogenicity.
volume, and the good correlation between maximum kidney length and renal volume,9,10 maximum renal length is preferred for assessment of renal size on sonograms. Additional measurements in the transverse axes are very inaccurate and of no utility. Renal length averages 11 cm in adults,10 and 10 cm to 12 cm is a useful range for normal renal length at average body height. Because the variability in measurements is 5%,9 differences up to 1 cm may not be significant. The variability may be greater in children, comprising as much as 2 to 3 years in the comparison of kidney length to age.11 Kidney length correlates best with body height in both adults and children (Fig. 10.6A)10,12,13,14 and, after correction for body height, does not vary between sexes. Kidney length rapidly increases during the first year of life with a more gradual enlargement up to about 18 years14,15 (Fig. 10.6B). Progressive enlargement occurs during pregnancy that resolves by 12 weeks postpartum, due primarily to parenchymal enlargement—although some pelvocaliceal enlargement occurs, particularly in the right kidney.16 Proper interpretation of kidney size must take into account the effect of these nonpathologic factors. Compensatory hypertrophy is common in solitary kidneys in children (up to 80%-90% increase in volume),17,18 and after nephrectomy in adults (5%-30% increase).19,20 Enlargement of the kidneys occurs in nephritis and infiltrative diseases, often accompanied by a rounded shape and increased echogenicity.
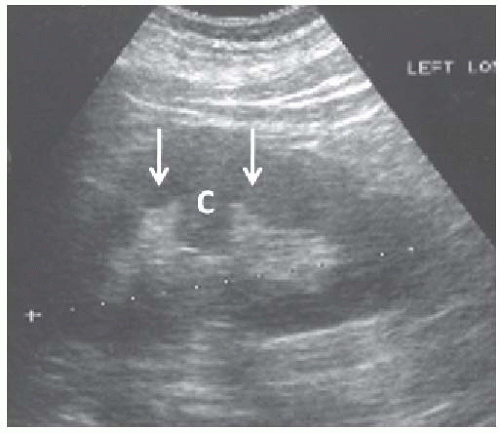 FIGURE 10.4 Hypertrophied column of Bertin. Longitudinal image of the left kidney showing cortex ( C ) protruding into the renal sinus between two medullary pyramids (arrows). |
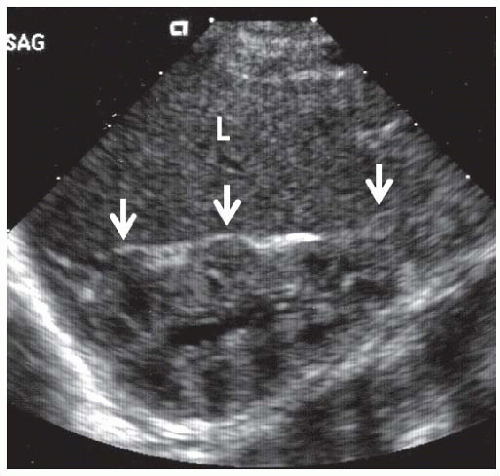 FIGURE 10.5 Normal neonatal kidney. Longitudinal view of the right kidney in a neonate showing accentuated lobules (arrows) and the medullary pyramid centered within each lobule. The cortex is more echogenic than the liver and there is no sinus fat. |
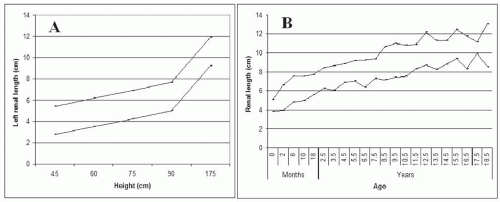 FIGURE 10.6 A: Nomogram of renal length based on body height showing 95% confidence limits for maximum length of the left kidney as a function of body height in children. ( Adapted from Dinkel E, Ertel M, Dittrich M, et al. Kidney size in childhood: sonographic growth charts for kidney length and volume. Pediatr Radiol. 1985;15:38, with permission.) B: Nomogram of renal length and age: presenting 95% confidence limits for kidney length versus age in children. (Adapted from O’Neill WC. Atlas of Renal Ultrasonography. Philadelphia: WB Saunders; 2011, with permission.) |
Cortical Thickness
The thickness of the renal cortex is measured from the renal capsule to either the outer border of the medullary pyramids or to the arcuate arteries. A normal value of 9.3 ± 1.1 mm was obtained in 23 renal transplant donors.21 If medullary pyramids are not discernible, the parenchymal thickness between the sinus fat and the renal capsule (mean value of 15 to 16 mm) may be used.10 However, both parameters can vary within a kidney and are difficult to measure precisely. Cortical thinning is a sign of advanced chronic kidney disease. Increased cortical thickness is usually due to edema or
inflammation and is often accompanied by kidney enlargement, a globular shape, and obliteration of the sinus fat.
inflammation and is often accompanied by kidney enlargement, a globular shape, and obliteration of the sinus fat.
Cortical Echogenicity
Comparison of renal cortex to the liver or spleen, at the same depth, is the basis for determination of cortical echogenicity. Renal cortical echogenicity depends on age and is often greater than liver echogenicity in neonates but should be less than or equal to22,23 that of the liver or spleen by 6 months of age.24 After several years of age, the renal cortical echogenicity should always be less than the liver. Fibrosis, infiltrating cells, and tubular debris and dilation can increase echogenicity. Transmission artifacts related to overlying fluid and ribs, and increased hepatic echogenicity in steatosis or cirrhosis, can bias the interpretation of cortical echogenicity.
Medullary Pyramids
The medulla should be less echogenic than the cortex but visibility depends on overlying structures and the frequency of sound. Medullary disease usually causes increased echogenicity.
Renal Sinus
The neonatal kidney contains very little fat but the normal renal sinus in adults should exhibit only echogenic fat. Occasionally, the calyces are visible in otherwise normal kidneys, particularly during a brisk diuresis25,26 or during pregnancy.27,28 Blood vessels may also be visible, particularly in children and young adults or in states of increased central venous pressure.
Parenchymal Diseases
Glomerular or tubulointerstitial disorders usually present with diffuse changes in the kidneys. However, the changes can be similar in different disorders and the kidneys may appear normal. Thus, interpretation is very dependent on the clinical findings.
The most common parenchymal disorder that causes acute kidney injury is acute tubular necrosis (ATN). The renal sonogram can be normal in ATN29,30,31 but increased cortical echogenicity and cortical expansion have been observed in both animal and human studies,32,33,34,35 especially with nephrotoxic ATN,32,35,36 whereas an enlarged hypoechoic cortex may be more typical of ischemic ATN.6,32 The cortical enlargement presumably represents edema whereas increases in cortical echogenicity may be due to cellular and proteinaceous casts and debris within the tubules. The degree of renal enlargement has been shown to inversely correlate with recovery time from ATN.34 In general, sonography is rarely useful in the workup of acute renal failure when the clinical picture suggests ATN and urinary obstruction is unlikely. However, it may be helpful in identifying underlying chronic kidney disease in this setting.
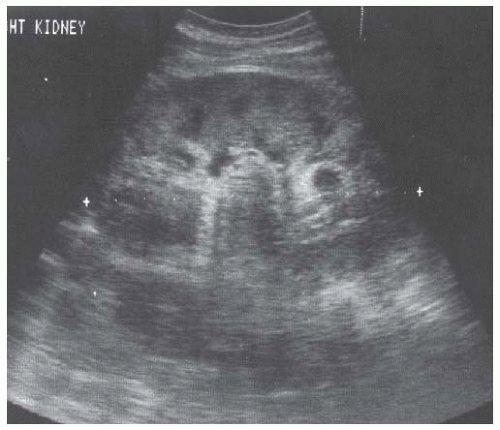 FIGURE 10.7 Acute glomerulonephritis. Longitudinal view of the right kidney showing a globular kidney with diminished sinus fat indicating cortical swelling. Note the prominence of the medullary pyramids due to increased cortical echogenicity. |
Glomerulopathies
Although sonography is usually normal in glomerular diseases, acute glomerulonephritis and thrombotic microangiopathies can appear as cortical enlargement and increased cortical echogenicity.30,31,37,38 When taken in the context of chronic renal failure, even a normal cortical thickness is suggestive of glomerular disease (diabetic nephropathy) because other disorders usually lead to cortical thinning.39 The cortex is typically normal in membranous nephropathy or immunoglobulin A (IgA) nephropathy.30,31,40 In severe glomerulonephritis, the kidney may take a rounded shape and echogenic appearance that is barely recognizable as a kidney (Fig. 10.7). Enlarged, echogenic kidneys can also be seen in HIV nephropathy,41,42 amyloidosis, and preeclampsia.43
Tubulointerstitial Disease
Acute interstitial nephritis produces enlarged echogenic kidneys30,44,45 that have the same appearance as glomerulonephritic kidneys. Chronic interstitial nephritis, particularly analgesic nephropathy (Fig. 10.8), presents with hyperechoic medullary pyramids, often with cortical atrophy.31,46,47 At a more advanced stage, papillary necrosis and calcifications may be seen.47,48,49,50 Medullary echogenicity can also be increased by uric acid deposition and nephrocalcinosis (Fig. 10.9), sickle hemoglobinopathies, Sjögren syndrome, and chronic hypokalemia.51 Although acute pyelonephritis rarely produces renal failure, chronic pyelonephritis may cause chronic kidney disease and present with focal cortical scarring and thinning of the cortex often accompanied by caliectasis (Fig. 10.10). Xanthogranulomatous pyelonephritis may lead to enlarged, cystic appearing kidneys.52,53
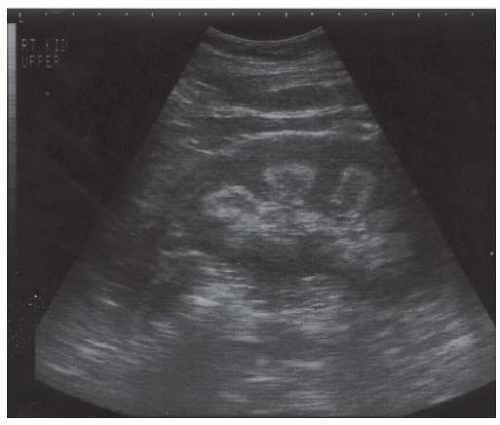 FIGURE 10.8 Analgesic nephropathy. Longitudinal view of the right kidney showing hyperechoic pyramids with relative sparing of the central portions. |
Renal atrophy is usually the consequence of long standing renal disease or congenital defects, and presents as small kidneys with a thin cortex and accentuated lobulations (Fig. 10.11). The presence of renal atrophy does not provide any information on the underlying renal pathology but usually indicates that a renal biopsy will be uninformative.
Cysts
Cysts are fluid-filled structures with an epithelial lining usually originating from renal tubules. The typical sonographic features of cysts (anechoic structures with distal enhancement) make them very easily discernible by ultrasonography. The most common type of cyst is a sporadic acquired cyst, which can be present without any kidney disease. Cysts can be simple (Fig. 10.12) or complex (Fig. 10.13), with the criteria for complexity including thickening of the wall, calcifications, more than two septations, and luminal echogenicity. Even though the great majority of complex cysts are benign, any complex cyst should be closely followed up with ultrasound or additional imaging studies (computed tomography [CT] and magnetic resonance imaging [MRI]), given the possibility of cystic renal cell carcinomas.54
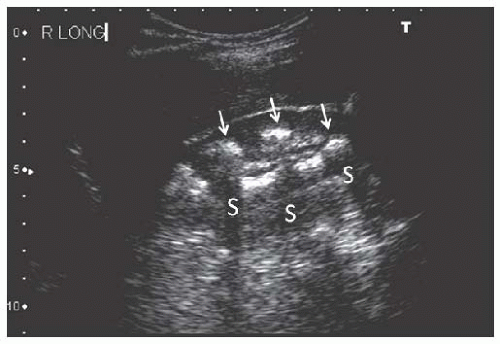 FIGURE 10.9 Nephrocalcinosis. Longitudinal image of the right kidney showing multiple calcifications in the inner medullae ( arrows ) producing acoustic shadows (S). |
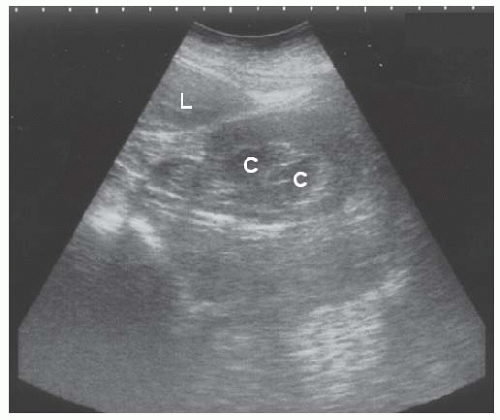 FIGURE 10.10 Chronic pyelonephritis. Longitudinal view of the right kidney shows caliectasis of the lower pole ( C ), and loss of parenchyma with scarring of the upper pole (arrows).L, liver. |
Acquired cystic kidney disease (ACKD) and autosomal dominant polycystic kidney disease (ADPKD) are the most common types of multicystic renal disease. ACKD is often encountered in patients with advanced chronic kidney disease (CKD) or end-stage renal disease (ESRD). Cysts are
typically of smaller size and the kidney is usually echogenic and small55 (Fig. 10.14). ADPKD is the most common inherited cause of renal failure, and sonography is the cornerstone of diagnosis using specific criteria established by Ravine et al.56 The performance of these criteria was found to be suboptimal in the PKD-2 genotype and revised unified criteria have recently been published by an international group of investigators (Table 10.1).57
typically of smaller size and the kidney is usually echogenic and small55 (Fig. 10.14). ADPKD is the most common inherited cause of renal failure, and sonography is the cornerstone of diagnosis using specific criteria established by Ravine et al.56 The performance of these criteria was found to be suboptimal in the PKD-2 genotype and revised unified criteria have recently been published by an international group of investigators (Table 10.1).57
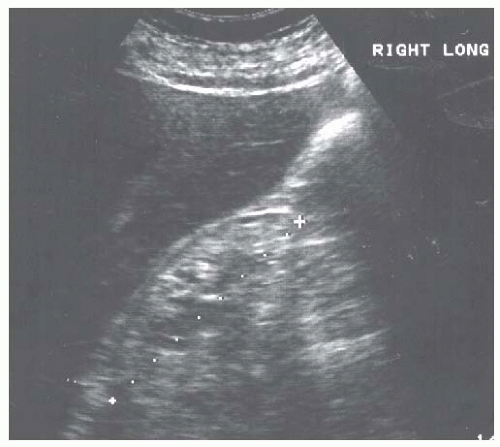 FIGURE 10.11 Renal atrophy. Longitudinal image of the right kidney showing a small kidney with a thin and hyperechoic cortex. |
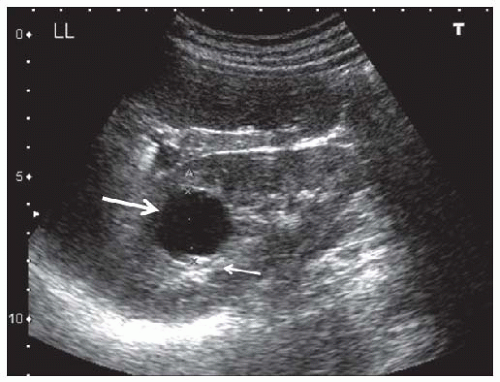 FIGURE 10.12 Simple cyst. Longitudinal image of the left kidney showing a round hypoechoic structure ( large arrow ) in the lower pole, which presents with distal acoustic enhancement ( small arrows ), consistent with a simple cyst. |
The pathognomonic sonographic appearance of ADPKD includes presence of multiple bilateral renal cysts (Fig. 10.15) and liver cysts (in 83%-90% of patients)58 with significant renal enlargement. Other multicystic diseases such as medullary cystic kidney disease (MCKD), juvenile nephronophthisis, ACKD, or medullary sponge kidney59,60 do not present with renomegaly. Multiple cysts with renal enlargement can be seen in von Hippel-Lindau disease, tuberous sclerosis, and multicystic dysplastic disease. Complex cysts are also commonly seen in ADPKD and the main etiologies are intracystic hemorrhage and infection. Even though renal cell carcinoma can be seen in this ADPKD, these patients are not at increased risk.61
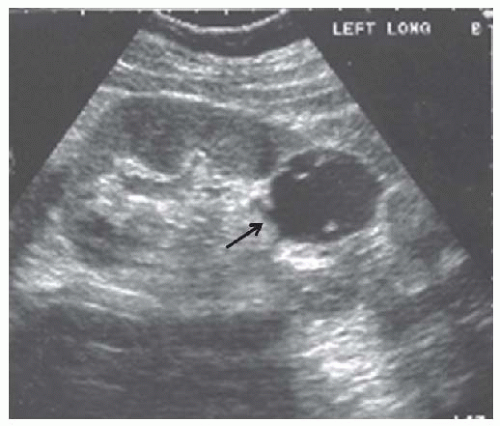 FIGURE 10.13 Complex cyst. Longitudinal view of the left kidney shows a cyst with an irregular wall ( black arrow ) and several internal echoes. |
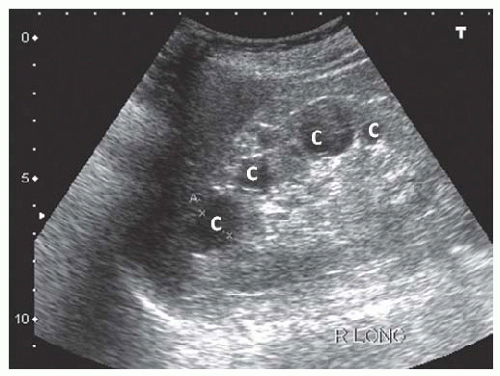 FIGURE 10.14 Acquired cystic kidney disease. Longi tudinal view of the right kidney showing multiple cysts (c) with an intervening echogenic cortex. |
Urinary Obstruction
Urinary obstruction typically results in hydronephrosis: a dilatation of the collecting system which may be predominantly seen in the minor calyces, the major calyces, or both. More atypical cases may present with minimal dilatation of the collecting system, particularly in the acute setting.62 Hydronephrosis is only an anatomic diagnosis and may not indicate urinary obstruction. Brisk diuresis (such as in diabetes insipidus), papillary necrosis, and pregnancy can all result in nonobstructive calyceal dilatation.28,62,63,64 Grading systems for severity of the hydronephrosis have proven to be of limited clinical utility because the degree of hydronephrosis may correlate poorly with the extent of obstruction. When obstruction is the primary cause of renal failure, it is always associated with hydronephrosis. In acute obstruction, the cortex is intact (Fig. 10.16) whereas chronic obstruction can lead to marked thinning of the cortex (Fig. 10.17). Failure to visualize the proximal ureter suggests obstruction at the ureteropelvic junction, whereas a dilated proximal ureter (hydroureter) (Fig. 10.16) indicates either obstruction at the level of the ureter or bladder. A large postvoid bladder indicates urinary retention, where sometimes the distal ureters can also be visualized (Fig. 10.18), whereas an empty bladder with dilatation of the distal ureters suggests obstruction
at the bladder inlet. Recognition of hydronephrosis can be difficult in polycystic kidney disease (PKD), where massive cyst formation can prevent or obscure calyceal dilatation and more subtle signs should be sought (Fig. 10.19). This is an important cause of acute renal failure and can be due to stones or blood clots from cyst rupture. Radioisotope scanning may confirm obstruction when sonographic findings are not characteristic.
at the bladder inlet. Recognition of hydronephrosis can be difficult in polycystic kidney disease (PKD), where massive cyst formation can prevent or obscure calyceal dilatation and more subtle signs should be sought (Fig. 10.19). This is an important cause of acute renal failure and can be due to stones or blood clots from cyst rupture. Radioisotope scanning may confirm obstruction when sonographic findings are not characteristic.
TABLE 10.1 Performance Characteristics of Ultrasonographic Diagnostic Criteria for Autosomal Dominant Polycystic Kidney Disease in At-Risk Individuals Without Information on Genotype | ||||||||||||||||||||||||||||||
|---|---|---|---|---|---|---|---|---|---|---|---|---|---|---|---|---|---|---|---|---|---|---|---|---|---|---|---|---|---|---|
| ||||||||||||||||||||||||||||||
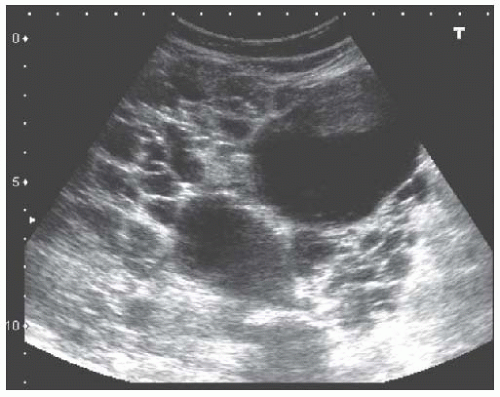 FIGURE 10.15 Autosomal dominant polycystic kidney disease. Longitudinal view of the right kidney showing an enlarged kidney with numerous cysts (hypoechoic structures) of different sizes. |
Occasionally, peripelvic cysts may also mimic hydronephrosis (Fig. 10.20). These are actually dilated lymphatics and, because they track with the blood vessels, can sometimes have a branching pattern. A rim of sinus fat separating the “cysts” from the parenchyma and the absence of a dilated ureter are useful hints toward peripelvic cysts. Another differential diagnosis for hydronephrosis is venous engorgement often seen in cases of volume overload or renal vein thrombosis. In general, the renal vein branches before entering the renal sinus (bush appearance) whereas the collecting system branches in the sinus (pruned tree appearance). The presence of venous pulsations and the tracking of the vein medially to the vena cava, as well as the
use of Doppler sonography, can differentiate blood vessels from the urinary tract. Occasionally, the renal pelvis is situated outside the sinus (extrarenal pelvis) appearing as a dilated proximal ureter but without any calyceal enlargement (Fig. 10.21).
use of Doppler sonography, can differentiate blood vessels from the urinary tract. Occasionally, the renal pelvis is situated outside the sinus (extrarenal pelvis) appearing as a dilated proximal ureter but without any calyceal enlargement (Fig. 10.21).
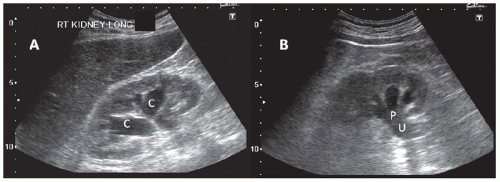 FIGURE 10.16 Acute hydronephrosis with hydroureter. Longitudinal image of the right kidney showing dilatation primarily of the major calyces ( C ) with some enlargement of the minor calyces and with conserved parenchymal thickness. The dilatation of the pelvis ( P ) and ureter ( U ) is easily visualized. |
The urinary bladder should be carefully examined by sonography in all patients with hydronephrosis. Additional indications are anuria, hematuria, pain, and urinary tract infections. The bladder is located in the midline, posterior to the symphysis pubis, and contains no luminal structures. When full, it appears as an anechoic fluid collection that is oval in transverse plane and becomes more elongated in the sagittal plane. The bladder volume is calculated by using the following formula for ellipsoid structures65:
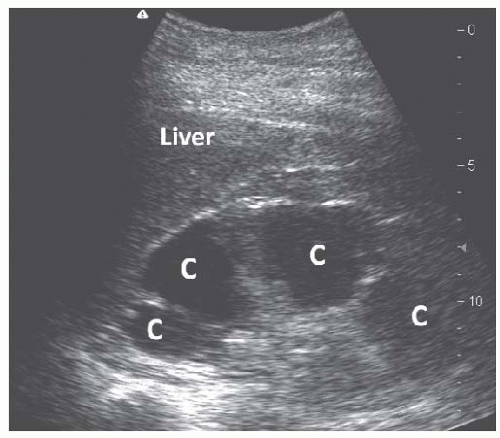 FIGURE 10.17 Chronic hydronephrosis. Longitudinal view of the right kidney showing dilated calyces that extend to the renal capsule, indicative of an extremely thin cortex. |
Volume = 0.523 × length × width × depth
A normal bladder is usually empty after a complete void and should not contain more than 10 mL of urine. A postvoid residual volume of more than 50 mL is associated with a threefold risk of urinary retention in males and is often used as a threshold for the diagnosis of urinary retention.66 Hyperechoic structures such as stents, Foley catheters, bladder stones (Fig. 10.22), tumors, and blood
clots (Fig. 10.23) may be visible in the bladder. The presence of urinary jets from a ureter proves its patency. Ureteral stents may transmit bladder pressure back to the kidney, resulting in hydronephrosis. Thus, the diagnosis of stent obstruction requires an empty bladder.
clots (Fig. 10.23) may be visible in the bladder. The presence of urinary jets from a ureter proves its patency. Ureteral stents may transmit bladder pressure back to the kidney, resulting in hydronephrosis. Thus, the diagnosis of stent obstruction requires an empty bladder.
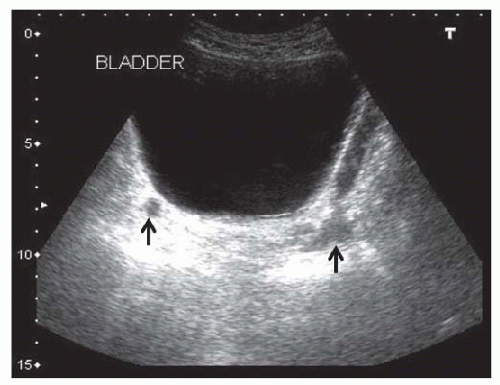 FIGURE 10.18 Urinary bladder retention. Transverse view showing an extremely dilated bladder. The distal ureters (arrows) are visible posterior to the bladder. |
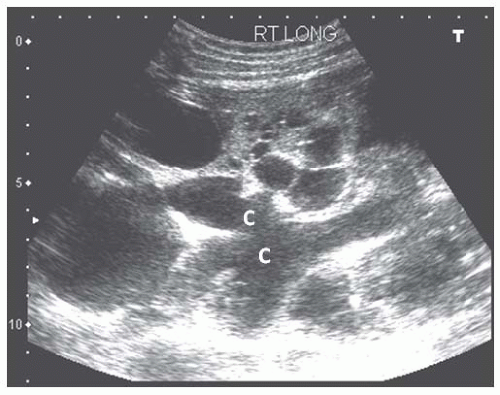 FIGURE 10.19 Hydronephrosis in autosomal dominant polycystic kidney disease. Converging dilated calyces (C) are apparent in this young patient who presented with major hemorrhagic cyst rupture and acute renal failure due to ureteral clots. Hydronephrosis resolved after ureteral stent placement. The multitude of cysts and disruption of the normal anatomy often make detection of hydronephrosis difficult. |
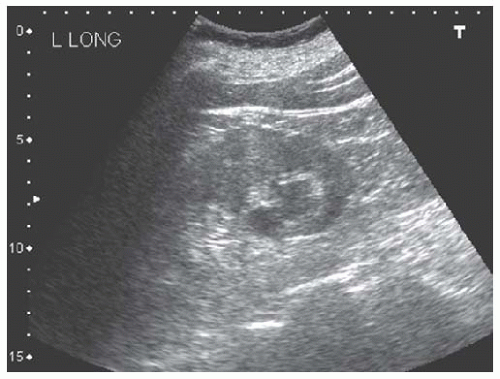 FIGURE 10.20 Peripelvic cyst. Longitudinal view of the left kidney showing a hypoechoic structure where the renal pelvis is expected to be seen. The absence of calyceal dilatation and presence of the echogenic sinus fat interposed between the cyst and the parenchyma are indicative of peripelvic cysts rather than hydronephrosis. |
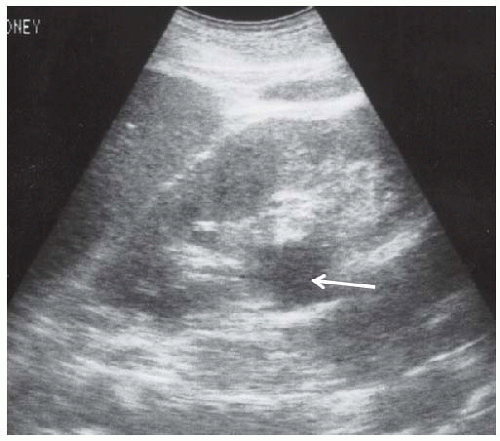 FIGURE 10.21 Extrarenal pelvis. Longitudinal view of the left kidney. There is apparent dilatation of the initial proximal ureter with no further hydroureter. Although the major calyces can be seen converging into the extrarenal renal pelvis, there is no enlargement of the minor calyces. |
Kidney Stones and Calcifications
Stones typically reflect most of the sound, rendering them echogenic with a distal shadow and very easily discernible by ultrasonography no matter what the composition. However, both findings may not be present and small kidney stones
and ureteral stones may not be visible. Stones are seen in the urinary space (Fig. 10.24) and may be associated with urinary obstruction, hydronephrosis, and urinary tract infection. Staghorn calculi typically fill the entire calyceal system but can appear as multiple stones on single images (Fig. 10.25).
and ureteral stones may not be visible. Stones are seen in the urinary space (Fig. 10.24) and may be associated with urinary obstruction, hydronephrosis, and urinary tract infection. Staghorn calculi typically fill the entire calyceal system but can appear as multiple stones on single images (Fig. 10.25).
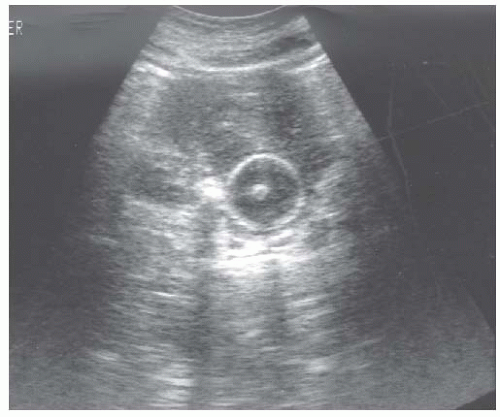 FIGURE 10.22 Foley catheter and bladder stone. Transverse view of the bladder shows a perfectly round shaped circle with echogenic walls (inflated balloon) surrounding the central echogenic catheter. Adjacent to the left side of the Foley catheter, a small opacity with a posterior shadow represents a bladder stone. |
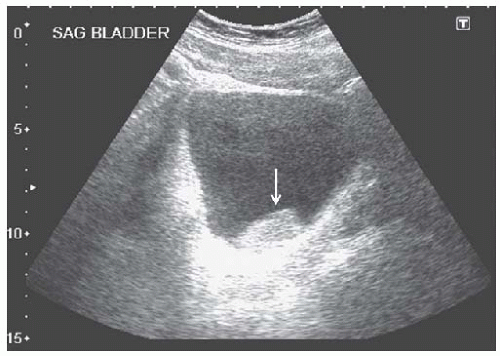 FIGURE 10.23 Clot in the bladder. Sagittal view of a distended bladder containing a hyperechoic mass, representing a blood clot (arrow). |
In nephrocalcinosis (Fig. 10.9) and papillary necrosis, the calcification is in the renal medulla and not the urinary space but this distinction can sometimes be difficult. The differential diagnosis also includes ureteral stents, which typically are not as echogenic and yield less distinct shadows.
Neoplasms
Renal neoplasms are usually discovered incidentally or during the workup for pain or hematuria. Special attention should be given to rule out cysts, transmission artifacts, and normal variants such as lobulation and hypertrophied columns of Bertin.67 Although the absence of blood flow by Doppler ultrasound may point to a cyst, additional imaging is almost always indicated because sonography can rarely identify the cause of a solid lesion.
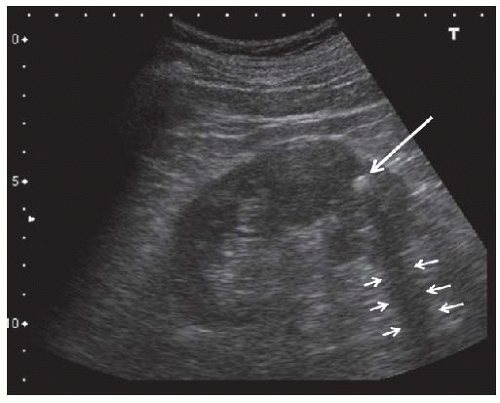 FIGURE 10.24 Kidney stone. Longitudinal view showing a hyperechoic stone ( large arrow ) in the lower pole that casts an acoustic shadow ( small arrows). |
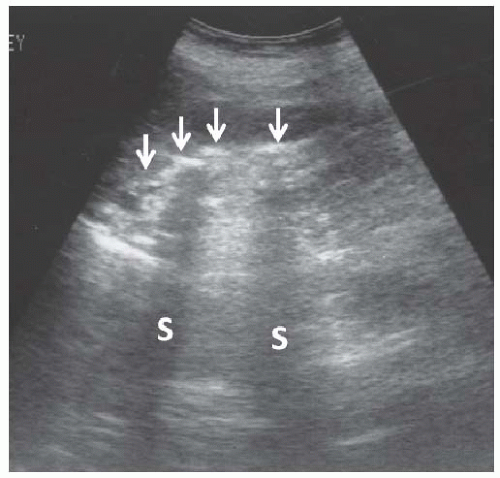 FIGURE 10.25 Staghorn calculus. Longitudinal image of the right kidney showing a long curvilinear echogenicity in the renal sinus with dense acoustic shadows (S). |
Renal Cell Carcinoma
The typical sonographic appearance of renal cell carcinoma is of a well-demarcated hypoechoic mass that distorts the renal contour (Fig. 10.26), but tumors can be isoechoic (and more difficult to visualize) and can be hyperechoic when small (<3 cm). About 10% of renal cell carcinomas have a cystic appearance.68
Angiomyolipoma
Sporadic angiomyolipomas (AMLs) are the most commonly encountered tumors in kidneys (autopsy incidence of 11%, more commonly seen in middle-aged women)72 but multiple AMLs can be observed in tuberous sclerosis. They are not malignant but may cause hemorrhage. The typical presentation is of a very echogenic parenchymal mass (due to the high fat content) with an acoustic shadow in 33% of cases73 (Fig. 10.27).
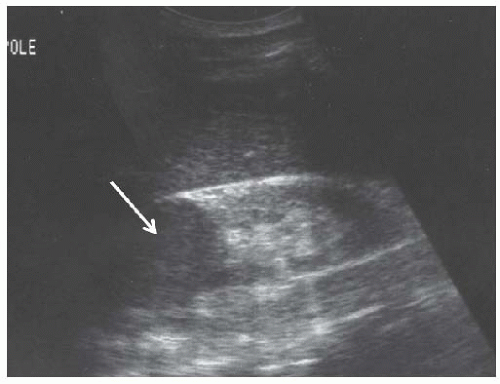 FIGURE 10.26. Renal cell carcinoma. Longitudinal view of the left kidney shows a hypoechoic mass ( arrow ) in the upper pole which was confirmed to be a renal cell carcinoma. |
Metastasis and Infiltrative Neoplastic Diseases
Infiltration of the kidneys is common in lymphomas (20% on CT scan,74 50% on autopsies75 ). They can cause acute renal failure by obstruction or diffuse infiltration.76 The typical appearance is of multiple hypoechoic masses but a “perirenal halo” is also a classic but more unusual occurrence.77 Leukemias can also infiltrate the kidney. Other solid tumors (e.g., lung cancer) may metastasize to the kidney, in which case they tend to be focal and nodular and are not distinguishable from other tumors.
Infections
Sonography is not indicated in most routine cases of pyelonephritis. Indications include male gender, children, failure to resolve, complications, and frequent recurrence. Pyelonephritis is usually lobular, appearing as a poorly defined hypoechoic area corresponding to a lobule, but it occasionally is diffuse. This can progress to abscesses which are usually single or multiple, heterogenous masses. The differential diagnosis includes complex cysts and neoplasms, which may require CT or MR for diagnosis.
Hemorrhage
Renal hemorrhage usually appears as perirenal or subcapsular hematomas and usually results from percutaneous kidney biopsy, surgery, or trauma. Initially they may appear as anechoic fluid collections but typically they are heterogeneous with fluid and solid components.
Transplanted Kidneys
Although many aspects of sonography are similar in native and transplanted kidneys, important differences exist due to anatomic considerations. The allograft is usually placed in the right pelvic fossa, aligned along the incision with the hilum oriented inferiorly and posteriorly, but a variety of other orientations can be encountered especially in obese patients, repeat transplantations, and combined kidney-pancreas transplantation. The donor artery and vein are anastomosed to the external iliac (or the common iliac) vessels and the ureter is anastomosed to the superolateral wall of the bladder (Fig. 10.28). When two kidneys are transplanted en bloc, portions of the donor aorta and vena cava are retained and anastomosed to the recipient vessels.78,79 The kidney is often placed within the peritoneum when combined with a pancreas transplant. In very young children, the kidney may be placed posterior to the cecum with anastomosis of the donor vessels to the great vessels.79 The anatomic relationships are readily apparent on sonograms. The psoas muscle and iliac vessels lie posteriorly and are usually imaged transversely on longitudinal scans of the allograft. The former can be identified by its contraction when the leg is flexed at the hip, and the latter are frequently pulsatile. The ureter and renal vessels are often visible even in normal allografts. The ureter courses medially, usually lying directly under the lower (medial) pole, whereas the renal vein travels posteriorly. The bladder lies medially and can easily be mistaken for a perirenal fluid collection. The peritoneum is superior and occasionally anterior to the allograft, typically appearing as a
beaklike projection over the allograft, and is easily identified by the peristalsis of the bowel loops.
beaklike projection over the allograft, and is easily identified by the peristalsis of the bowel loops.
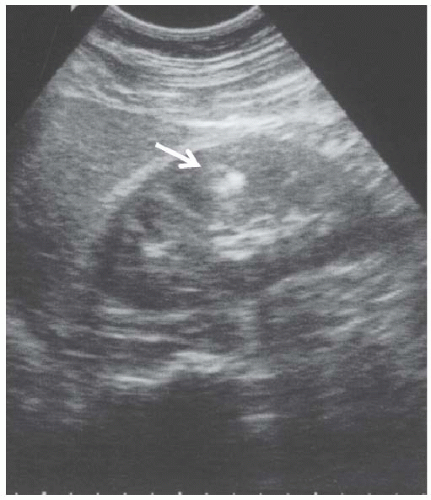 FIGURE 10.27 Angiomyolipoma. Longitudinal view of the left kidney shows a small, brightly echogenic mass in the cortex (arrowhead) without any distal shadowing. |
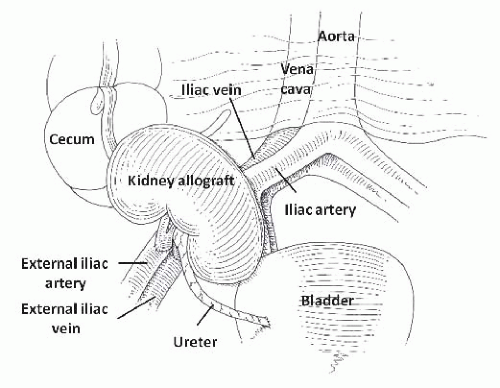 FIGURE 10.28 Anatomic relationships of the kidney. (Adapted from O’Neill WC. Atlas of Renal Ultrasonography . Philadelphia: WB Saunders; 2011, with permission.) |
Sonography of the transplanted kidney is indicated in most cases of acute renal failure80 and can easily diagnose thrombosis of the renal artery or vein, urinary obstruction, and urine leaks in the immediate postoperative period. Other, nonspecific findings can suggest acute rejection. Sonography can be helpful in guiding percutaneous biopsy, diagnosing fluid collections, measuring residual bladder volume, and identifying ureteral stents.
Allograft Parenchymal Disease
The visualization of renal allografts is easier than native kidneys but suffers from the inability to evaluate two important parameters: renal size and echogenicity. Measurement of renal length is problematic due to the frequent inability to capture the entire length of the kidney in one view and the uncertainty of its significance due to both donor-dependent and recipient-dependent variables. Renal size can increase up to 40% during the 6 first months after transplantation.81,82,83 Evaluation of echogenicity is difficult due to the lack of an adjacent reference organ. The only useful clues are prominence of the medullary pyramids and, when echogenicity is markedly increased, blending of the allograft with the surrounding tissue. Because of these limitations and also the simplicity of allograft kidney biopsy, size and echogenicity are usually not considered in clinical decisions.
The most common causes of allograft failure are acute tubular necrosis (related to harvesting or storage), acute rejection, drug toxicity, chronic allograft nephropathy, and recurrent disease, but sonographic findings lack sensitivity and specificity in diagnosing any of these. In particular, kidneys often appear normal in mild and even moderate cases of rejection. When present, findings consist of cortical swelling and increased echogenicity (due to cellular infiltration). Allograft enlargement is fairly specific for acute rejection83,84,85,86,87,88,89,90 but can occur with ATN and recurrent nephritis (Fig. 10.29). Infections (pyelonephritis and BK virus) can also cause allograft failure but sonographic findings are nonspecific.
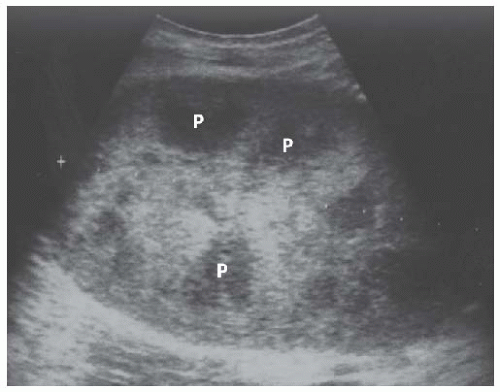 FIGURE 10.29 Acute rejection, longitudinal scan. The kidney is swollen and globular and the cortex is brightly echogenic, rendering medullary pyramids ( P ) very prominent. |
Urinary Obstruction of the Allograft
The frequent occurrence of urinary tract obstruction is the principal reason for performing sonography in most transplant patients presenting with acute renal failure. In the immediate postoperative period, the ureter may be obstructed by intraluminal blood clots, kinking, or external compression by edema or hematomas. Urinary retention, lymphoceles, and ureteral strictures are responsible for most other cases,91,92 but are rarely seen when ureteral stents are routinely placed during transplantation. Acute rejection within the ureter may also obstruct urine flow.93,94 Ultrasonography is an excellent test to diagnose obstruction in allografts with a sensitivity of almost 100%.95 Specificity is lower because hydronephrosis is not always an indication of obstruction because small degrees of calyceal dilatation are easily and commonly seen in otherwise normal allografts. Mild, and even moderate, dilatation may not be a manifestation of urinary obstruction,92,96 but dilatation of the minor calyces and ureter are usually indicative of obstruction (Fig. 10.30). Sonography is also very useful in pinpointing the site of obstruction. Hydronephrosis without dilatation of the proximal ureter indicates obstruction at the ureteropelvic junction, which may be caused by extrinsic compression by a lymphocele or ureteral strictures.97 In both cases, there is usually abrupt tapering of the renal pelvis. A common site for strictures is in the distal segment or near the anastomosis
with the bladder.91,97 In this setting the dilated ureter can be followed to the bladder and remains dilated when the bladder is emptied.
with the bladder.91,97 In this setting the dilated ureter can be followed to the bladder and remains dilated when the bladder is emptied.
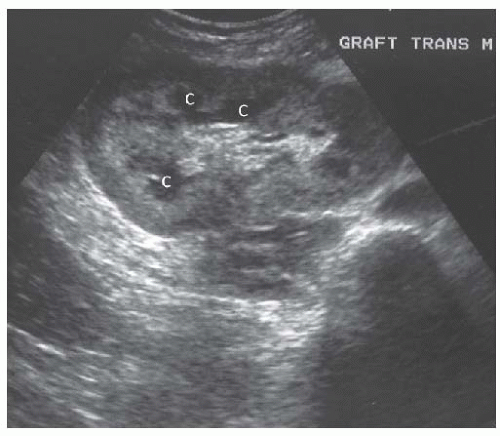 FIGURE 10.30 Mild hydronephrosis of the allograft kidney. Transverse view of the allograft shows mild dilatation of the calyces ( C ), consistent with mild hydronephrosis. |
Thickening of the calyceal or ureteral walls is not uncommon and can be mistaken for luminal dilatation. This is usually caused by edema (Fig. 10.31) and has a fine echo pattern as opposed to anechoic urine. A fine central line presumably representing apposition of the luminal surfaces is occasionally seen.98 Edema is frequently associated with stents and may also be caused by ureteral rejection.93 Calyceal thickening was initially thought to be a sign of acute rejection but is now known to be nonspecific.99,100 Additional causes of echogenicity within the collecting system are stents, hemorrhage, stones, and infection.
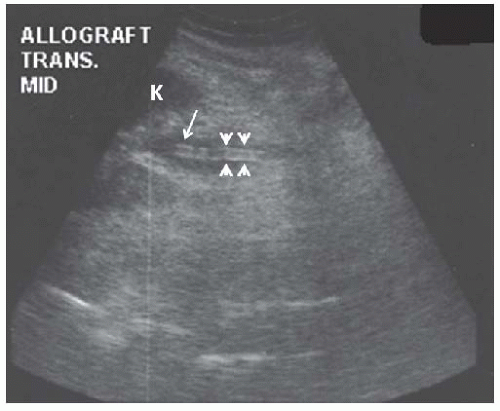 FIGURE 10.31 Urinary leak and ureteral stent. Transverse view of the allograft kidney ( K ) shows a small urine leak (arrow) surrounding a ureteral stent ( arrowheads ), medial to the allograft. |
Fluid Collections and the Kidney Allograft
Fluid collections consisting of blood, urine, or lymph can be complications of transplant surgery.95 Sonography cannot distinguish different types of fluid but the location, shape, internal structure, and the clinical presentation can all help in making the correct diagnosis. Additional studies such as examination of aspirated fluid and pyelography or radionuclide scanning to detect extravasation of urine may be needed. Care must be taken to distinguish fluid collections from the bladder or ascites.
Related posts:


Stay updated, free articles. Join our Telegram channel

Full access? Get Clinical Tree


