Renal Circulation and Glomerular Hemodynamics
William J. Arendshorst
Gabriel L. Navar
The capability of the kidneys to achieve their sophisticated homeostatic function is optimized by an intricate microvascular system that adjusts vascular resistance to maintain an appropriate control of the intracapillary and interstitial forces that govern renal blood flow in the cortex and medulla as well as the glomerular filtration rate. A combination of intrinsic and extrinsic regulatory mechanisms are responsible for controlling the one-fifth of the cardiac output that circulates through the kidneys. Essentially all the renal blood flow (RBF) traverses through the glomerular capillaries, where about 20% of the plasma is filtered. The complex glomerular filtration apparatus is truly unique in having both a very high hydraulic conductivity and a remarkably low permeability to plasma proteins. One major function of the renal vasculature is to regulate the intraglomerular forces so that an adequate, yet not excessive, volume is filtered into the urinary tubules. In this chapter, we discuss the characteristics of the filtering and the reabsorbing microcirculatory structures in the normal kidney. Particular emphasis is placed on the dynamic interactions among the intrarenal paracrine and extrarenal homeostatic mechanisms that participate in regulating these processes. To allow a better appreciation of basic mechanisms, some structural relationships and fundamental concepts related to vascular smooth muscle, endothelial cells, and other components of the renal microvascular network are discussed. A detailed discussion of the anatomic features of the kidney is provided in Chapter 1.
THE MAGNITUDE OF RENAL BLOOD FLOW AND GLOMERULAR FILTRATION RATE
The multiple intrarenal parallel arteriolar pathways provide the kidneys with a very low vascular resistance. They normally receive about 20% of the cardiac output. This amounts to a blood flow of 1,000 to 1,200 mL per minute in a 70- to 75-kg person. RBF is even more impressive when considered per unit of kidney weight, because the kidneys account for only 0.5% of the total body weight, or about 300 g. Thus, as shown in Table 3.1, blood flow per gram of kidney weight is about 4 mL per minute, which is 5 to 50 times greater than the flow through other organs and circulatory beds. Based on a total of 1 million glomeruli in each kidney or a glomerular density of 7,000 glomeruli per gram, the average blood flow and glomerular filtration rate (GFR) per glomerulus is 570 nL per minute and 62 nL per minute, respectively. This large flow, coupled with the maintenance of a high hydrostatic pressure in glomerular capillaries, allows the filtration of about 20% of the plasma, which amounts to an average GFR of 120 mL per minute, or 170 L per day.1,2
The extraordinarily high RBF is in marked excess of that simply required to provide the renal parenchyma with adequate supplies of oxygen and nutrients. For this reason, it is generally recognized that RBF is regulated primarily to maintain the glomerular and peritubular intrarenal hemodynamic environments at levels compatible with the optimum delivery of filtrate to the nephrons and appropriate reabsorption of fluid back into the systemic vasculature.
The Relationship of Renal Blood Flow to Oxygen Consumption
Although oxygen (O2) use is not a major determinant of RBF, O2 consumption by the kidneys is still quite high because of the very high metabolic activity of the tubules. Over 99% of the filtered fluid, electrolytes, and essential organic nutrients are normally reabsorbed by the tubules and returned to the circulation via the peritubular capillaries. The tubular reabsorptive processes depend on the integrity of the epithelial transport systems, in particular the energy requiring Na-K-ATPase. Such tubular enzyme systems account for the majority of the O2 consumption by the kidneys.
RBF is about 400 mL/min/100 g of tissue, and the arteriovenous O2 difference is relatively low, only 1 to 2 mL per deciliter of blood. Thus, O2 consumption by the kidney is about 8 mL of O2 per minute or 400 µm of O2/min/100 g, which amounts to 6% to 8% of the whole body O2 consumption. This level of O2 use is relatively constant and is not reduced by moderate hypoxemia. Under physiologic conditions, there is a consistent relationship between RBF
and renal O2 consumption. However, this relationship is a consequence of the associated changes in GFR and filtered sodium load, reflecting a direct causal relationship between tubular sodium reabsorption and O2 consumption, as shown in Figure 3.1. The rate of actively transported sodium appears to be the primary determinant of the rate of O2 consumption. About 20% of the consumption, or approximately 100 µm of O2/min/100 g of kidney, is used for basal metabolic purposes and continues even in the absence of filtration. Above this basal rate, there is a linear relationship. Approximately 27 to 35 mEq of sodium is reabsorbed per millimole of O2 consumed, depending on the contribution of passive transport via paracellular pathways, which may be about 40%. In contrast to other organs, the kidneys do not have a hyperemic response to hypoxia, making them more susceptible to hypoxemia.3,4
and renal O2 consumption. However, this relationship is a consequence of the associated changes in GFR and filtered sodium load, reflecting a direct causal relationship between tubular sodium reabsorption and O2 consumption, as shown in Figure 3.1. The rate of actively transported sodium appears to be the primary determinant of the rate of O2 consumption. About 20% of the consumption, or approximately 100 µm of O2/min/100 g of kidney, is used for basal metabolic purposes and continues even in the absence of filtration. Above this basal rate, there is a linear relationship. Approximately 27 to 35 mEq of sodium is reabsorbed per millimole of O2 consumed, depending on the contribution of passive transport via paracellular pathways, which may be about 40%. In contrast to other organs, the kidneys do not have a hyperemic response to hypoxia, making them more susceptible to hypoxemia.3,4
TABLE 3.1 Renal Hemodynamic Function in Humans | ||||||||||||||||||||||||
|---|---|---|---|---|---|---|---|---|---|---|---|---|---|---|---|---|---|---|---|---|---|---|---|---|
|
The balance of O2 consumption for sodium reabsorption and O2 delivery is reflected by the tissue pressure of O2 (pO2). A cortical-medullary gradient of oxygenation exists in the kidney. In the superficial cortex, pO2 in efferent arterioles is 40 to 45 mm Hg, with values of 40 mm Hg recorded in other cortical structures (proximal tubule, distal tubule, superficial cortical tissue), and 30 mm Hg in the deep cortex. The fact that pO2 in the renal vein exceeds that of any site in the cortex indicates precapillary shunting of O2 from artery to vein. Renal medullary pO2 is about 20 mm Hg, with cells functioning in a climate of constant relative hypoxia. Recent mathematical analysis indicates that arteriovenous O2 shunting in the cortex is substantial. The shunting contributes to the stabilization of tissue pO2 levels. Cortical ischemia may exacerbate medullary hypoxia even when medullary perfusion is maintained.5,6,7,8
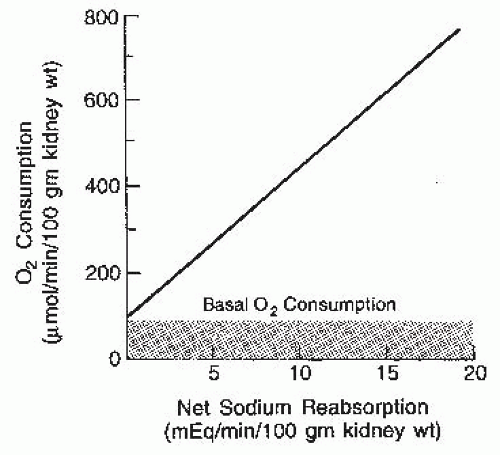 FIGURE 3.1 The relationship between tubular sodium reabsorption and oxygen consumption by the kidney. The primary determinant of oxygen consumption above basal levels is the rate of active sodium transport. |
In the renal medullary microcirculation, the net amount of O2 reabsorbed from vasa recta into the interstitium is significantly lower than estimated medullary O2 requirements based on active sodium reabsorption. Low inner medullary pO2 results from the countercurrent arrangement of vasa recta and high vascular permeability to O2, as well as high metabolic needs. Diffusional shunting of O2 between descending and ascending vasa recta explains why a 20-mm Hg decrease in initial pO2 at the corticomedullary border only leads to a small drop in pO2 at the papillary tip (<2 mm Hg with baseline parameter values). In contrast, small decreases in medullary blood flow, hematocrit, and O2 consumption by tubules markedly reduce interstitial pO2. Without erythrocytes, papillary tip pO2 cannot be maintained above 10 mm Hg, even when O2 consumption is zero. An increase in medullary blood flow during water diuresis improves medullary O2 delivery.
The renal medulla normally functions in an hypoxic environment. Tissue hypoxia impacts on O2-regulated genes and leads to the renal production of adrenomedullin and erythropoietin. Hypoxia-inducible factor-1alpha (HIF-1α) is a transcription factor that regulates the O2-dependent expression of many genes. This transcription factor may contribute to gene expression in renal medullary cells that
function normally under hypoxic conditions. In this regard, the loop diuretic furosemide markedly increases renal medullary pO2 levels (20 to 50 mm Hg) in association with the inhibition of reabsorption along the ascending limb of Henle loop and a reduction in HIF-1α.9,10
function normally under hypoxic conditions. In this regard, the loop diuretic furosemide markedly increases renal medullary pO2 levels (20 to 50 mm Hg) in association with the inhibition of reabsorption along the ascending limb of Henle loop and a reduction in HIF-1α.9,10
The efficiency of coupling between tubular transport and O2 consumption is modified by paracrine/autocrine factors. Nitric oxide (NO) normally suppresses O2 consumption by epithelial mitochondria. The inhibition of NO synthesis increases O2 extraction and O2 consumption and reduces the efficiency of sodium transport. The regulation of renal O2 consumption by NO may become impaired during oxidative stress when superoxide production is excessive. Oxidative stress and decreased availability/activity of NO can lead to reduced intrarenal pO2 due to enhanced O2 usage relative to tubular sodium transport. A low sodium intake leads to increased renal medullary oxygenation.11
Endothelial-dependent NO plays a role in the regulation of renal O2 consumption in normal kidneys. Baseline cortical O2 consumption is about 600 nmol per minute per gram of tissue. Stimulation of NO production by bradykinin or administration of a NO donor reduces O2 consumption 25% to 30% in the renal cortex and 30% in the medulla. Superoxide scavenging of NO attenuates the stimulatory effect of bradykinin or NO donors.3,5,8
CHARACTERISTICS OF THE CONTRACTILE PROCESS
Structural-Functional Aspects
There are important interactions among various cell types in the microvasculature that determine the caliber of the small diameter resistance vessels. The complex vasculature of the kidney (Fig. 3.2) allows the fine regulation of the intrarenal hemodynamic environment. Smooth muscle cells surround all vascular structures from the main renal artery to the individual afferent and efferent arterioles. The preglomerular vasculature also has extensive innervation and responds to renal nerve stimulation and many different hormonal, paracrine, and physical stimuli. Nevertheless, most of the fine control of preglomerular resistance occurs in the small diameter afferent arterioles. The afferent arterioles vary in length and in the angle at which they branch from the interlobular arteries; those in juxtamedullary portions branch at a much sharper angle. In addition, smooth muscle cells of the afferent arterioles are modified as the vessels approach the glomerulus. The proximal portions of afferent arterioles possess typical elongated smooth muscle cells, whereas cells closer to the glomerulus are more rounded and many possess renin-containing granules.1,2
As is shown in Figure 3.3, the magnitude of the hydrostatic pressure drop along the arterial tree is relatively small up to the terminal segments of the afferent arterioles. About 70% of the preglomerular pressure drop occurs in the terminal portion of the afferent arteriole. In rodents, the arteries and the larger arterioles leading to the superficial nephrons contribute more to this pressure drop. Overall, the pressure drop up to the glomerular capillary tuft is much lower than in other vascular beds. This allows for high hydrostatic pressure in the glomerular capillaries, which is much greater than the plasma colloid osmotic pressure and is thus responsible for the ultrafiltration of fluid into the Bowman space.1
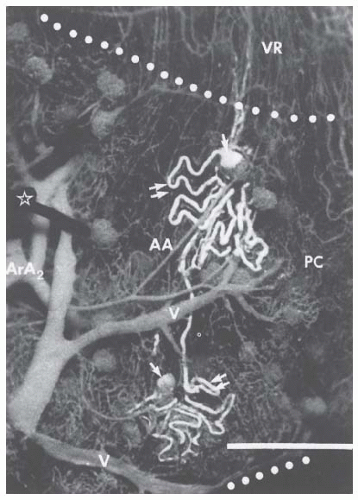 FIGURE 3.2 Renal microcirculation showing branching of afferent arterioles from arcuate arteries, glomerular capillary tufts, efferent arterioles, peritubular capillaries, some initial portions of the vasa recta, and the venous system. The vessels are filled with dark elastic polymer (Microfill), and two tubules are filled with light polymer, showing the Bowman capsule (single arrow) and the proximal tubules (double arrow) and parts of loop of Henle. AA, afferent arteriole; ArA, arcuate artery; PC, peritubular capillary; V, venule; VR, vasa recta. (Courtesy of Dr. Daniel Casellas.) |
The terminal portion of an afferent arteriole contains modified granular epithelioid cells that form part of the juxtaglomerular apparatus. The granules contain renin and other components of the renin-angiotensin system; the extent of granulation varies inversely with sodium intake. There is a reciprocal relationship between the amount of renin and actin, and the granular cells may have reduced contractile capability. As is shown in Figure 3.4, the juxtaglomerular granular cells are adjacent to the tubular macula densa segment at the end of the ascending loop of Henle, and they are associated with the nongranular extraglomerular mesangial cells between the afferent and efferent arterioles. The appearance of the macula densa cells with large nuclei along with their close apposition to the glomerular vessels provide the
morphologic basis for the influence of alterations in flow or composition of the tubular fluid to generate signals that are transmitted to the afferent arteriole or juxtaglomerular cells to control vascular tone and renin release.12,13,14
morphologic basis for the influence of alterations in flow or composition of the tubular fluid to generate signals that are transmitted to the afferent arteriole or juxtaglomerular cells to control vascular tone and renin release.12,13,14
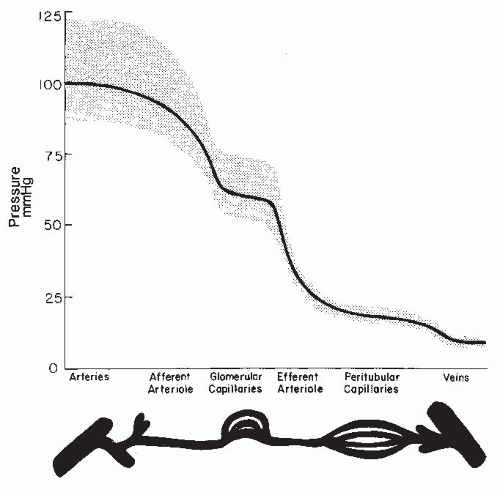 FIGURE 3.3 A representative pressure profile along the renal microvasculature in a normal kidney. The segments are depicted at the bottom of the graph, and the range of ideal pulse pressures is represented by the stippled area. |
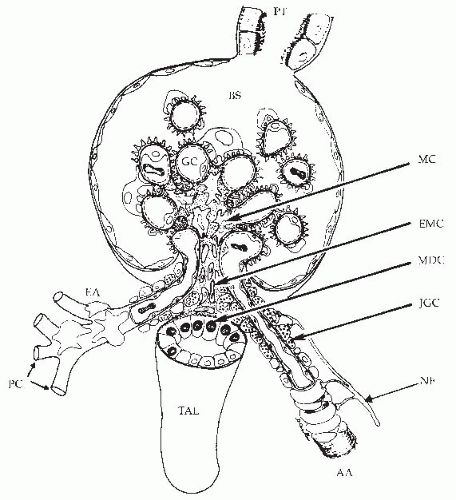 FIGURE 3.4 A drawing of the glomerulus and the juxtaglomerular complex consisting of the afferent arteriole (AA) with the granular cells of the juxtaglomerular apparatus (JGC), the extraglomerular mesangial cells (EMC), the macula densa (MDC) segment of the ascending loop of Henle, and the efferent arteriole (EA). Also shown are the thick ascending limb (TAL), the proximal tubule (PT), the Bowman space (BS), glomerular capillaries (GC), peritubular capillaries (PC), mesangial cells (MC), and nerve fibers (NF). (Drawing by Dr. Daniel Casellas.) |
As an afferent arteriole approaches a glomerulus, the muscle cells surrounding the vessel intermingle with extraglomerular and intraglomerular mesangial cells. As it enters the glomerulus, the arteriole expands into a manifold lined by endothelial cells, which, in turn, gives rise to a series of glomerular capillary loops. The loops subdivide further into a branching system of exchange channels. Finally, the channels coalesce into a small number of terminal capillaries, which join to form the efferent arteriole. Greater structural detail regarding the glomerular capillaries subserving the filtration process is provided in Chapter 1.
Efferent arterioles originate deep within the glomeruli and vary with regard to length, diameter, and density of smooth muscle cells. In the outer cortex, these vessels are relatively short, have a smaller diameter, and have a less well-developed muscular wall than efferent arterioles in deeper cortical regions. The smooth muscle cells of the superficial efferent arterioles resemble pericytes that often extend onto the peritubular capillaries. In the midcortex, the efferent arterioles are usually longer and have a greater degree of smooth muscle development. In the deeper portion of the cortex, the efferent arterioles are more variable in length. Some efferent arterioles of juxtamedullary nephrons give rise to typical cortical peritubular capillary systems, whereas others are much longer and descend toward the medulla. These two distinct capillary networks subserve the reabsorptive functions of the cortex and medulla, respectively, and may be subject to independent regulation. At the corticomedullary border, the efferent arterioles break up into vascular bundles that branch into numerous descending vasa recta. Vasa recta branch to form a capillary plexus at each level within the medulla. There are three distinct capillary plexuses, with the densest found in the inner stripe of the outer medulla. The ascending vasa recta are morphologically distinct from the descending vasa recta and ascend within vascular bundles to drain into the arcuate veins. The ascending vasa recta are more numerous and have a highly fenestrated, thin endothelium, whereas the descending vasa recta have a continuous thick endothelium. These anatomic differences suggest that the ascending vasa recta have a much greater permeability to macromolecules than the descending vasa recta.1,2,15,16
Each glomerular resistance segment contributes to the regulation of glomerular blood flow and pressure in a unique manner because the glomerular capillary is “nested” between the afferent and efferent arterioles. Although a more quantitative analysis of their respective roles is presented in a following section, it should be appreciated that alterations in preglomerular resistance produce changes in glomerular blood flow, pressure, and GFR, which are directionally similar. In contrast, selective changes in efferent arteriolar resistance cause more complex GFR responses because glomerular pressure and blood flow change in opposite directions. The maintenance of appropriate efferent arteriolar tone serves to keep glomerular capillary pressure sufficiently high to provide an adequate hydrostatic pressure for filtration. The efferent arterioles also are responsible for the marked decrease in pressure at the peritubular capillaries, which allows the reabsorptive force of the plasma colloid osmotic pressure to predominate.1
There are important regional differences in the circulation within the kidney, which have considerable functional significance. The relative distribution of glomerular and postglomerular blood flow is depicted in Figure 3.5. Glomerular blood flow is proportional to the size of the glomeruli. The larger deep juxtamedullary nephrons have higher flows than the superficial or midcortical glomeruli. These juxtamedullary glomeruli give rise to muscular efferent arterioles that descend toward the medulla and branch into the vasa recta bundles, which are intimately associated with the surrounding concentric rings of loops of Henle and collecting ducts. With regard to the postglomerular blood flow, about 75% to 85% of the total RBF is distributed to the peritubular capillaries in the cortex, whereas 15% to 25% goes to the medullary region. Blood flow throughout the cortex is much higher than in the medulla and is higher in the outer cortex than in the inner cortex. Overall cortical blood flow averages 4 to 6 mL/min/g of tissue. Medullary blood flow ranges from 2.0 to 3.5 mL/min/g in the outer medulla to much lower values of approximately 0.2 to 1.0 mL/min/g of tissue in the inner medulla and papilla. Regional mean transit times of intravascular indicators are 1 to 3 seconds for the cortex,
4 to 6 seconds for the outer medulla, and 10 to 30 seconds for the inner medulla.15,17,18,19.
4 to 6 seconds for the outer medulla, and 10 to 30 seconds for the inner medulla.15,17,18,19.
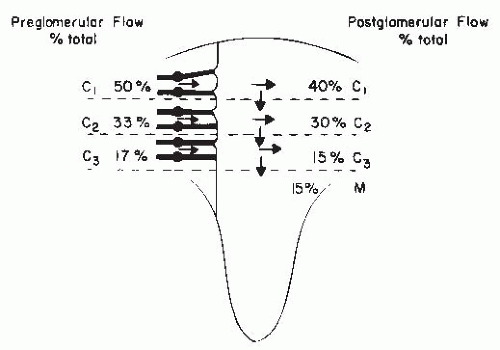 FIGURE 3.5 The distribution of glomerular and postglomerular flow and of cortical (C1, C2, C3) and medullary (M) blood flow. The distribution of glomerular flow is expressed as a percentage of total blood flow; preglomerular flow is presented on the left, and postglomerular flow on the right. The deep cortical flow is subdivided to account for medullary flow distribution. As noted from the arrows, there is a general shift of the postglomerular blood flow toward deeper areas. |
Receptor Activation and Intracellular Signaling
Contractile responses at various sites along the vascular network have different functional characteristics, depending on the expression of receptor populations and/or activation mechanisms. The actions of circulating hormones and neural stimuli combined with local paracrine factors from endothelial and epithelial cells are expressed through different effector mechanisms to provide a highly integrated regulation of the renal microcirculation and the interstitial environment. Many vasoactive agents interact with membrane receptors on the vascular smooth muscle and the endothelial and mesangial cells.
Plasma membrane surface receptors can be subdivided into three main groups in which the receptor is coupled to a guanine nucleotide binding protein (Gα protein), regulates enzyme activity, or serves as part of an ion channel. Examples of the latter two groups are the atrial natriuretic peptide (ANP) receptor, guanylate cyclase, in vascular smooth muscle, and the nicotinic-acetylcholine receptor that directly activates a cation channel at the neuromuscular junction. Almost all known vasoactive agents affect vasomotor tone via receptor coupling to G proteins. G protein-coupled receptors (GPCR) share several common structural features with seven transmembrane domains with three extracellular and three intracellular loops. The extracellular loops act in concert with the transmembrane domains to bind the agonist. The intracellular loops function to activate a G protein. G proteins are heterotrimeric proteins consisting of α, β, and γ subunits. The Gα subunit is unique for each receptor and is responsible for generating a specific intracellular signal. The β and γ subunits share a high degree of homology among G proteins; together they function to modulate the ability of the α subunit to generate the signal.
G proteins undergo a conformational change following agonist binding to a membrane receptor, which in turn enables guanosine triphosphate (GTP) to replace guanosine diphosphate (GDP) on the α subunit. The Gα-GTP complex then dissociates from the β and γ subunits and interacts with an effector such as an enzyme or a channel. The intrinsic GTPase activity of the Gα subunit then hydrolyzes GTP to GDP, and the Gα-GDP complex reassociates with the β and γ subunits, which terminates the response. G proteins linked to adenylate cyclase are classified as Gαs or Gαi, depending on whether they stimulate or inhibit adenylate cyclase and cyclic adenosine monophosphate (cAMP) generation. Gαq11/12 activate membrane-bound phospholipase C (PLC) or activate membrane Ca2+ channels, or both. An example of multiple effects an agonist can produce depending on receptor coupling to different G proteins (e.g., Gαq11/12) is provided by norepinephrine. The binding of norepinephrine to an α2-adrenoceptor inhibits adenylate cyclase, reduces the formation of cAMP, and attenuates activity of protein kinase A (PKA), whereas binding to a β1– or β2-adrenoceptor activates adenylate cyclase to increase cAMP/PKA signaling. Norepinephrine also binds to α1-adrenoceptors and activates a Gαq protein, which is coupled to PLC, leading to the formation of inositol triphosphate (IP3) and the release of Ca2+ from the sarcoplasmic reticulum. α1-Adrenoceptors also stimulate nicotinamide adenine dinucleotide phosphate (NADPH) oxidase to increase superoxide oxide production and adenosine diphosphate (ADP) ribosyl cyclase generation of cyclic ADP ribose that sensitizes ryanodine receptors to release Ca2+ from sarcoplasmic reticular stores.20,21,22,23,24
GPCRs and/or their immediate signaling partners (G proteins) are concentrated in caveolae, flask-shaped plasma membrane invaginations (50 to 100 nm in diameter) that are subcellular microdomains of lipid rafts and caveolae, enriched in glycosphingolipids and cholesterol and the protein caveolin. Caveolae are complexes with a high concentration of signaling molecules. Caveolin is a scaffolding protein that anchors receptors (e.g., angiotensin II subtype 1 [AT1], endothelin [ET-1], epidermal growth factor [EGF]) signaling and trafficking proteins (Gαq/11) as well as ion channels (K+ and transient receptor potential [TRP] channels) and enzymes (endothelial nitric oxide synthase [eNOS], protein kinase C [PKC], phospholipase C [PLC], NADPH oxidase, ADP ribosyl cyclase) involved in controlling vasomotor tone. Endothelial cells and fibroblasts are rich in caveolins 1 and 2; smooth muscle cells express all three caveolins (Cav-1, -2, and -3). In vascular smooth muscle cells, Cav-1 serves as a scaffold or chaperone to target AT1 receptors to caveolae to activate downstream signaling; Cav-1 is required for efficient coupling of Gαq/ll proteins and PLCβ to promote Ca2+ mobilization from the sarcoplasmic reticulum. Cav-1 links AT1 receptors to NADPH oxidases and promotes recruitment of Rac1 to activate reactive oxygen species (ROS) formation. Cav-1 couples IP3 receptors and TRPC3 channels for store-operated Ca2+ entry. It also suppresses KATP channel activity and negatively regulates Ang II-induced EGF receptor transactivation. Most caveolae in vascular smooth muscle cells have nanocontacts with the sarcoplasmic reticulum, providing a direct link to intracellular Ca2+ mobilization and excitationcontraction coupling.
In endothelial cells, Cav-1 binds eNOS, limiting the translocation and activation of eNOS. Caveolin-deficient animals exhibit unusual endothelial dysfunction in that NO production is unopposed, leading to marked vasodilation. Cav-1 knockout animals display attenuated vasoconstriction to phenylephrine and a lack of myogenic tone, largely due to excessive NO production. Mice lacking caveolin show that caveolae and caveolins play a prominent role in various pathophysiologic conditions, especially those related to the cardiovascular system. These disease phenotypes include atherosclerosis, cardiac hypertrophy, cardiomyopathy, diabetes, and neointimal hyperplasia (smooth muscle cell proliferation).25,26,27,28
GPCR desensitization reduces receptor downstream signaling and effector response. G-protein coupled receptor kinases (GRKs), a family of serine/threonine protein
kinases, initiate receptor-specific, homologous desensitization that curtails receptor signaling by phosphorylating the C-terminal tail of agonist-bound GPCR to promote docking with inhibitory β-arrestins. β-Arrestins not only uncouple receptors from heterotrimeric G-proteins, they also target GPCRs to clathrin-coated vesicles for internalization. Endocytosed receptors are either resensitized and recycled to the plasma membrane or degraded in lysosomes. GPCRs internalize as a stable complex with β-arrestin with signaling potential and gene transcription.22,29,30,31
kinases, initiate receptor-specific, homologous desensitization that curtails receptor signaling by phosphorylating the C-terminal tail of agonist-bound GPCR to promote docking with inhibitory β-arrestins. β-Arrestins not only uncouple receptors from heterotrimeric G-proteins, they also target GPCRs to clathrin-coated vesicles for internalization. Endocytosed receptors are either resensitized and recycled to the plasma membrane or degraded in lysosomes. GPCRs internalize as a stable complex with β-arrestin with signaling potential and gene transcription.22,29,30,31
Although GRKs regulate GPCR activity, regulators of G protein signaling (RGS) proteins directly control the activity of Gα-protein subunits, functioning as endogenous negative regulators of GPCR signaling by accelerating GTP hydrolysis by Gα-subunits and thereby attenuating signaling. The most well-characterized RGS proteins (e.g., RGS2, PGS4, PGS5 of the R4 family) determine signaling specificity of Gαq– and Gαi-coupled receptors. RGS2 is a GTPase activating protein that binds to both Gαq/11 and Gαi subunits of GPCRs to accelerate their intrinsic GTPase activity. As a result, they are deactivated with a reduced stimulation of PLCβ-mediated Ca2+ release and subsequent vasoconstriction. RGS2 and/or RGS5 reduce Ca2+ signaling initiated by AT1 and ET-1 and α1-adrenoceptors and subsequent contraction. RGS5 mRNA, a regulator of vascular remodeling, is expressed in medial smooth muscle of afferent arterioles and the main renal artery in nonhuman primates. RGS proteins may play a role in mechanosensation and stretch-induced myogenic responses, as well as coordinating actions of vasoconstrictor hormones and paracrine agents.
RGS2 activity is acutely stimulated by NO and cGMP signaling to promote vascular relaxation by attenuating Ca2+ signaling in response to vasoconstrictor agents. RGS2 expression in vascular smooth muscle is upregulated by Ang II and is downregulated in hypertension. RGS2 knockout mice are hypertensive with enhanced vasoconstriction produced by Ang II and α1-adrenoceptor agonists. The exaggerated Gαq/11 signaling in mutant animals is associated with renovascular abnormalities, exaggerated vasoconstriction, hypertension, thickening of the vascular wall of the aorta and renal interlobular arteries, and cardiac hypertrophy. Kidney cross-transplantation studies demonstrate that a specific loss of RGS2 in the kidney causes hypertension, whereas the absence of RGS2 from all extrarenal tissues, including the peripheral vasculature, does not affect arterial pressure. Isolated perfused kidneys of RGS4 knockout mice show increased renal vasoconstrictor responses to ET-1.21,32,33,34
Regulation of Microvascular Contractility
Changes in vascular perfusion are mediated by smooth muscle cell contraction or relaxation that elicits a change in vessel radius and in vascular resistance. Multiple steps and enzymatic cascades are involved in the contractile process, and many of these mechanisms interact with one another to modulate the contractile response. A pivotal step in mediating the contractile response in vascular smooth muscle cells is an increase in the cytosolic concentration of free ionized calcium ([Ca2+]i) above its very low basal value of 10-7 M. (This is approximately 0.01% of the ionic Ca2+ levels of plasma and extracellular fluid, 1 mM). As shown in Figure 3.5, cytosolic Ca2+ binds with calmodulin. The Ca2+-calmodulin complex activates myosin light chain (MLC) kinase, leading to the phosphorylation of MLC that interacts with actin and adenosine triphosphate (ATP) to elicit tension development. Increased [Ca2+]i also phosphorylates CPI-17, a phosphoprotein that inhibits MLC. GPCR activation of PKC enhances Ca2+ sensitivity of the contractile apparatus by potentiating the efficiency of Ca2+ stimulation of CPI-17. In addition, GPCR couples to the Gαq/11 signal through the monomeric GTPase RhoA/Rho kinase pathway to decrease the activity of MLC phosphatase, resulting in increased Ca2+ sensitivity of myofilaments and enhanced vasoconstriction for a given level of cytosolic Ca2+ concentration. Relaxation occurs as a consequence of the removal or sequestration of Ca2+ from the cytosol and/or MLC dephosphorylation. Decreases in Ca2+ signaling occur following dissociation of ligand from GPCR surface receptor, receptor inactivation, or internalization.2,35
Various hormones and drugs activate plasma membrane receptors to induce contraction by eliciting an increase in [Ca2+]i. Cytosolic Ca2+ is increased through a combination of Ca2+ entry from the extracellular environment and mobilization of Ca2+ from internal stores. Ca2+ can be released from intracellular stores via release channels, activated by IP3 or by a ryanodine (Ry)-like ligand. Ca2+ is released from a common sarcoplasmic reticular pool, with uptake mediated by a common sarcoplasmic-endoplasmic reticular Ca2+ ATPase (SERCA). Many vasoconstrictor agents increase intracellular Ca2+ by activating a Gα protein that stimulates PLC to break down membrane-bound phosphatidylinositol 4,5-diphosphate (PIP2) into IP3 and 1,2-diacylglycerol (DAG). The soluble IP3 binds to an IP3 receptor located on the sarcoplasmic reticulum, leading to the activation of Ca2+ channels and the release of Ca2+ into the cytoplasm. The lipophilic DAG remains within the membrane environment and activates PKC isoform that phosphorylates various regulatory proteins. DAG may also be generated by the actions of phospholipase D on phosphatidylcholine that is not accompanied by concurrent IP3 generation and the associated increase in [Ca2+]i. Agents that activate PKC, such as phorbol esters, induce slowly developing, sustained contractions or enhance contractile responsiveness to other stimuli.2,36
Activation of cell surface GPCRs also leads to the stimulation of plasma membrane-bound ADP-ribosyl cyclase that converts the substrate nicotinamide adenine dinucleotide (NAD + ) to adenosine 5′-cyclic diphosphate (cADP)-ribose, a potent Ca2+ mobilizing agent that acts on a RyR to trigger Ca2+ release from the sarcoplasmic reticulum. cADP-ribose is a calmodulin-dependent Ca2+-mobilizing second messenger system that acts independently of IP3, with RyR-mediated Ca2+ release to amplify IP3-mediated
Ca2+ mobilization. Ryanodine receptors are extremely sensitive to [Ca2+]i and exhibit Ca2+-induced Ca2+ release (CICR), a form of autopotentiation. Concentrations of Ca2+ over a wide range (5 to 100 µM) enhance the open probability of RyR, which contrasts with a narrower range (180 to 220 nM) for the IP3R.20
Ca2+ mobilization. Ryanodine receptors are extremely sensitive to [Ca2+]i and exhibit Ca2+-induced Ca2+ release (CICR), a form of autopotentiation. Concentrations of Ca2+ over a wide range (5 to 100 µM) enhance the open probability of RyR, which contrasts with a narrower range (180 to 220 nM) for the IP3R.20
Calcium entry occurs through a variety of pathways, including voltage-operated channels (VOCs) that are activated upon membrane depolarization and voltage-independent receptor-operated channels (ROCs) and store-operated channels (SOCs). Membrane depolarization downstream of GPCR activation results from the activation of Cl– channels or the inactivation of K+ channels. Voltage-independent ROCs and SOCs also contribute to agonist-induced Ca2+ entry in both preglomerular and efferent arterioles. ROCs are activated downstream of cell surface GPCR, independent of Ca2+ mobilization, via signaling mechanisms involving DAG and calmodulin, and other possible intermediates. SOCs are known to contribute to agonist-induced Ca2+ entry in renal vascular smooth muscle cells; they are also termed capacitative as they respond to depletion of Ca2+ stores.37,38
Among the identified families of TRP proteins, the canonical TRP (TRPC) family (TRPC1 through TRPC7) is thought to be involved in Ca2+ entry in vascular smooth muscle cells, most likely functioning as voltage-independent SOCs and/or ROCs. TRPC1 proteins in vascular smooth muscle cells form tetrameric channels in association with TRPC4 or TRPC5. TRPC3, -6, and -7 are activated by DAG and thus are attractive possibilities as ROCs. TRPC6 is an essential component of α1-adrenoceptor-activated cation channels in portal venous smooth muscle cells. Preglomerular arterioles have a predominance of TRPC3 and -6 subunits that may comprise SOCs and/or ROCs in these vessels. Evidence to support TRPC channel function is attenuation of Ca2+ responses of the afferent arteriole to norepinephrine by the blockers of voltage-insensitive Ca2+ entry Gd3+ and SKF 96365. Activation of TRPC6 in the afferent arteriole leads to increased [Ca2+]i. The Ca2+ permeable TRPC6 is a key signaling component in a functional slit diaphragm formed by podocytes in the glomerular filtration barrier. Gain-of-function mutations in TRPC6 are the cause for progressive kidney failure with urinary protein loss and focal segmental glomerular sclerosis. SOCs are activated by Ca2+ mobilization to specifically restore Ca2+ content in sarcoplasmic reticulum. Current interest focuses on stromal interaction molecules (STIM) in the sarcoplasmic reticulum, which sense SR Ca2+ depletion and then translocate to junctions near the plasma membrane to organize Orai proteins, the Ca2+ release-activated Ca2+ channels, to form a pore and increase Ca2+ entry.37,39,40,41,42,43,44,45,46,47
Na+/Ca2+ exchange (NCX) contributes to the regulation of [Ca2+]i, working reversibly in the exit mode to extrude Ca2+ or in the entry mode to facilitate Ca2+ entry. Exchanger activity is normally higher in afferent then in efferent arterioles. Ang II stimulates [Ca2+]i in afferent arterioles by activating NCX to promote Ca2+ entry. Consistent with this observation, genetic deletion of Na+/Ca2+ exchanger NCX1 in smooth muscle cells reduces Ang II—induced renal vasoconstriction in vivo, presumably due to less Ca2+ entry into smooth muscle cells. Nevertheless, the pharmacologic blockade of NCX or lowering extracellular Na+ concentration causes renal vasoconstriction and exaggerated Ang II-induced constriction of the isolated perfused kidney. Smooth muscle Na+/Ca2+ activity responds to Na+/K+-ATPase inhibition by an endogenous ouabainlike glycoside to extrude the high cellular Na+ in exchange for Ca2+ entry in hypertensive states.43,48,49,50
Several different K+ channels have been identified; the most prominent are Ca2+-activated and ATP-dependent K+ channels, which mediate relaxation by hyperpolarizing the cell membrane and reducing Ca2+ entry through voltage-gated Ca2+ channels. Importantly, increases in intracellular ATP inhibit K+ channels, thus causing depolarization. Channel activity is reduced by intracellular ATP concentrations normally present, suggesting that the activity of this channel is quite low in normal cells and may serve a primary protective role during the depletion of energy reserves.2,51,52,53,54
At the whole kidney level, Rho-kinase inhibition dilates the renal vasculature under basal conditions and attenuates renal vasoconstriction produced by intrarenal infusion of Ang II, arginine vasopressin (AVP), or norepinephrine, as well as increased renal perfusion pressure. Frequency analysis of renal vascular admittance indicates that Rho-kinase strengthens the myogenic response. Ca2+ sensitivity of the afferent arteriole is increased by adenosine and norepinephrine. Adenosine increases Ca2+ sensitivity by PKC, Rho-kinase, and p38 mitogen activated protein (MAP) kinase signaling pathways. This provides a mechanism by which different vasoactive agents can modulate reactivity to other stimuli. Interestingly, adenosine enhances Ang II-induced afferent arteriolar contraction but does not potentiate the contractile responses to ET-1 or norepinephrine. Reactivity to Ang II is enhanced by the ability of norepinephrine to increase Ca2+ sensitivity with increased MLC phosphorylation.
Rho-kinase participates in pressure-induced interlobular arterial and afferent arteriolar myogenic behavior and vasoconstrictor responses evoked by Ang II, adenosine A1, endothelin ETB, and purinergic P2X1 receptor activation as well as membrane depolarization. Ca2+ sensitization due to Rho-kinase also contributes to Ang II-induced constriction of efferent arterioles. Rho-kinase inhibition dilates preglomerular and postglomerular arterioles and attenuates vasoconstriction elicited by adenosine A1 or endothelin ETB receptor stimulation. Ang II, AVP, and TxA2 constrict preglomerular arcuate and interlobular arteries in the hydronephrotic kidney in part via Rho-kinase. The afferent arteriolar myogenic response in this preparation is markedly attenuated by Rho-kinase inhibition.55,56,57,58,59
As mentioned earlier, cAMP also activates Ca2+ translocation mechanisms that increase extrusion of Ca2+ out of the cell, return Ca2+ to the sarcoplasmic reticulum, or inhibit IP3-mediated mobilization of Ca2+ from sarcoplasmic
reticulum stores (Fig. 3.6). Drugs or agents such as PGE2 and PGI2 that increase cAMP via Gαs signaling produce increases in RBF and GFR. Small amounts of such ligands can buffer the action of vasoconstrictor agents without affecting baseline vascular tone. In contrast, ligand-receptor complexes coupled to the inhibitory G protein (Gαi) reduce cAMP levels and cause greater contraction for a given level of [Ca2+]i. Gαi proteins are reported to activate PLC and mobilize Ca2+ in the afferent arteriole.60,61
reticulum stores (Fig. 3.6). Drugs or agents such as PGE2 and PGI2 that increase cAMP via Gαs signaling produce increases in RBF and GFR. Small amounts of such ligands can buffer the action of vasoconstrictor agents without affecting baseline vascular tone. In contrast, ligand-receptor complexes coupled to the inhibitory G protein (Gαi) reduce cAMP levels and cause greater contraction for a given level of [Ca2+]i. Gαi proteins are reported to activate PLC and mobilize Ca2+ in the afferent arteriole.60,61
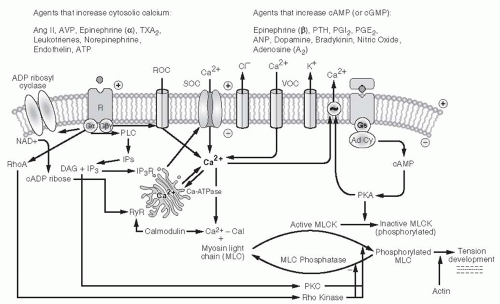 FIGURE 3.6 Primary intracellular signaling systems mediating smooth muscle cell or mesangial cell contraction, with effects of various hormones and vasoactive agents on the two major types of receptor systems. For ease of presentation, only two receptor mechanisms are depicted, but each agent acts on its own receptor system. |
Another family of receptors operates through the G protein-dependent activation of guanylate cyclase, the generation of cGMP, and the activation of protein kinase C to mediate vasodilation. In addition, two major guanylate cyclase activators are not G protein-dependent. NO derived from endothelial cells directly interacts with soluble guanylate cyclase. Also, ANP directly activates particulate guanylate cyclase in vascular smooth muscle cells. The mechanisms mediating cGMP-dependent vasorelaxation are similar to those used by cAMP. cGMP-dependent kinases lead to the inhibition of voltage-gated L-type Ca2+ channels, activation of a Na+/Ca2+ exchanger, stimulation of Ca2+-ATPase, inhibition of IP3 formation, and phosphorylation of phospholamban, resulting in increased Ca2+-ATPase activity in the sarcoplasmic reticulum. Ca2+ desensitization of the contractile machinery, independent of [Ca2+]i changes, takes place because cGMP/PKG can block RhoA activation and can reduce MLC activity by inhibiting CPI-17 phosphorylation and activating MLC phosphatase. cGMP also may stimulate Ca2+-activated K+ channels, which leads to hyperpolarization.33,62
The arachidonic acid pathways constitute another intracellular signaling system. Increased [Ca2+]i can activate phospholipase A2 and can release arachidonic acid from membrane phospholipids, resulting in the production of various metabolites that lead to vasodilation or vasoconstriction. Arachidonic acid metabolites exert effects through multiple pathways, including cAMP, cytosolic Ca2+, and inhibition of K+ channels. Arachidonic acid itself may increase Ca2+ entry via a noncapacitative Ca2+ entry channel. These actions will be discussed in detail later in this chapter.
Differences in cellular sites and mechanisms of smooth muscle activation may be partially responsible for the large variety of renal hemodynamic responses produced by different vasoactive agents. There is a major difference in the mechanisms leading to Ca2+ activation in the vascular smooth muscle cells of the afferent and efferent arterioles. Preglomerular vessels have a strong dependence on L-type voltage-gated Ca2+ channels, whereas their influence is not readily apparent in efferent arterioles. Antagonists of Ca2+ influx through L-type, dihydropyridine-sensitive Ca2+ channels selectively block agonist-induced constriction of
the preglomerular arterioles, including the afferent arteriole, without affecting efferent arteriolar contraction. This is the case for Ang II, ET-1, norepinephrine, and potassium chloride-induced depolarization. Agents that block L-type Ca2+ channels such as nifedipine, diltiazem, and verapamil primarily cause afferent vasodilation and impair autoregulatory responses to changes in renal perfusion pressure, affecting both myogenic and tubuloglomerular feedback (TGF responses). In contrast, T-type Ca2+ channels are active at both afferent and efferent arteriolar sites and influence vascular responsiveness. T-type Ca2+ channel blockers vasodilate afferent and efferent arterioles and prevent contractile responses to various stimuli at both sites. In afferent arterioles, T-type channels may act cooperatively with L-type channels to bring about membrane depolarization and Ca2+ entry. A primary action on the preglomerular vasculature also explains the increases in GFR and glomerular capillary pressure produced by Ca2+ entry blockers as well as inhibition of the TGF system. An example of a hormone that exerts its effects through different mechanisms is Ang II. Its effects are mediated by at least two mechanisms. Afferent arteriolar responses are highly dependent on Ca2+ entry via L-type channels, whereas the efferent arteriolar response is influenced by Ca2+ mobilization and Ca2+ entry via T-type channels and through store-operated channels in the absence of any entry through voltage-gated L-type channels. NO may suppress voltage-sensitive Ca2+ entry in both afferent and efferent arterioles. Ca2+ entry in outer medullary vasa recta is mediated by a combination of L- and T-type Ca2+ channels as well as store-operated cation channels.63,64,65,66,67
the preglomerular arterioles, including the afferent arteriole, without affecting efferent arteriolar contraction. This is the case for Ang II, ET-1, norepinephrine, and potassium chloride-induced depolarization. Agents that block L-type Ca2+ channels such as nifedipine, diltiazem, and verapamil primarily cause afferent vasodilation and impair autoregulatory responses to changes in renal perfusion pressure, affecting both myogenic and tubuloglomerular feedback (TGF responses). In contrast, T-type Ca2+ channels are active at both afferent and efferent arteriolar sites and influence vascular responsiveness. T-type Ca2+ channel blockers vasodilate afferent and efferent arterioles and prevent contractile responses to various stimuli at both sites. In afferent arterioles, T-type channels may act cooperatively with L-type channels to bring about membrane depolarization and Ca2+ entry. A primary action on the preglomerular vasculature also explains the increases in GFR and glomerular capillary pressure produced by Ca2+ entry blockers as well as inhibition of the TGF system. An example of a hormone that exerts its effects through different mechanisms is Ang II. Its effects are mediated by at least two mechanisms. Afferent arteriolar responses are highly dependent on Ca2+ entry via L-type channels, whereas the efferent arteriolar response is influenced by Ca2+ mobilization and Ca2+ entry via T-type channels and through store-operated channels in the absence of any entry through voltage-gated L-type channels. NO may suppress voltage-sensitive Ca2+ entry in both afferent and efferent arterioles. Ca2+ entry in outer medullary vasa recta is mediated by a combination of L- and T-type Ca2+ channels as well as store-operated cation channels.63,64,65,66,67
In addition to the smooth muscle cells of the resistance vessels, the mesangial cells within the glomerular tufts possess contractile capability, which may contribute not only to the regulation of blood flow through the glomerulus but also to the filtering capacity. Mesangial contraction is postulated to reduce the glomerular filtration coefficient (Kf) by decreasing the radius of capillaries or the surface area available for filtration, or both, but the precise mechanism is not clear. Many agents, including Ang II and vasopressin, reduce Kf. Low Kf values have also been observed during sodium depletion when plasma and local concentrations of endogenous Ang II are elevated. These responses reflect specific receptor-mediated effects on mesangial cells, because the response can be reversed by selective receptor antagonists in vivo and in cultured mesangial cells. However, podocytes are closely associated with mesangial cells in vivo and also respond to Ang II, suggesting that part of the actions of Ang II on Kf could be due to responses by podocytes. Some mesangial cell receptors exert stabilizing effects on mesangial cell contraction and counteract the influence of excessive levels of vasoconstrictor agents or serve metabolic functions. β-Adrenergic agonists and vasodilator prostaglandins (PGE2 and PGI2) increase cAMP in isolated glomeruli and mesangial cells and they directly oppose the apparent contractile effects of Ang II. Nevertheless, the structural mechanism by which mesangial cell contraction actually alters Kf remains unclear.2,68,69,70
Endothelial Interactions with Vascular Smooth Muscle
The vasculature is lined with a continuous layer of endothelial cells, which has many functions including serving as a diffusion barrier and preventing vascular thrombosis. Endothelial cells are dynamic metabolic units having membrane receptors and membrane-bound enzymes, which allow them to respond to and contribute to changes in the concentration of humoral agents. Membrane-bound ectoenzymes form or degrade, circulating vasoactive substances such as Ang II (angiotensin converting enzyme [ACE]), ET-1 (endothelin converting enzyme and metal-lopeptidase), bradykinin (kininase II), and adenonucleotides (three ectonucleotidases convert ATP, ADP, and AMP). Localization of ACE in preglomerular vessels allows the conversion of systemically delivered Ang I, an inactive decapeptide, to the biologically active octapeptide Ang II, that can then induce vasoconstriction locally or in downstream segments.2
The vascular endothelium serves an important paracrine role (Fig. 3.7). Endothelial cells participate in contractile and dilator mechanisms by responding to a variety of stimuli and increasing or decreasing formation of potent vasoactive substances that act locally to modulate the tone of adjacent smooth muscle cells. General classes consist of endothelium-derived relaxing factors (EDRF) and endothelium-derived contracting factors (EDCF). Specific examples of relaxing factors that cause renal vasodilation are NO, PGE2, and PGI2 (prostacyclin), carbon monoxide (CO), and an epoxyeicosatrienoic acid (EET), a hyperpolarizing factor that is a metabolite of the cytochrome P450 pathway. Examples of EDCF include Ang II, ET-1, thromboxane (TxA2), and oxygen-free radicals. These paracrine factors act on smooth muscle cells to modify vasomotor tone, proliferative state, and provide a balance between antioxidant defense mechanisms and excess generation of O2-derived free radicals. Thus, the endothelial cells are intimately involved in controlling the renal microcirculation.71,72
One of the most studied interactions between endothelial cells and smooth muscle cells involves the ability of the endothelium to modify the vascular responses to acetylcholine and other agents. Acetylcholine is a powerful vasodilator in vivo and also in isolated smooth muscle preparations that have an intact endothelium because it stimulates endothelial cells to produce vasodilatory paracrine substances. However, when applied to vascular preparations whose endothelium has been removed, acetylcholine induces vasoconstriction by acting directly on muscarinic receptors on smooth muscle cells. Many other substances have now been shown to stimulate the release of endothelium-derived vasoactive factors.
One of the major relaxing factors is NO derived from L-arginine. These paracrine systems will be discussed in later sections.2,73,74
One of the major relaxing factors is NO derived from L-arginine. These paracrine systems will be discussed in later sections.2,73,74
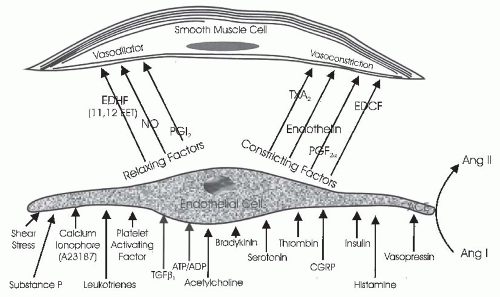 FIGURE 3.7 The interaction of endothelial cells with smooth muscle or mesangial cells. Agents that are known to influence endothelial-derived relaxing factors or nitric oxide (NO) and endothelial-derived constricting factors (EDCF) production by endothelial cells are shown. Endothelial cells also produce several vasoconstrictor and vasodilator agents, as shown in the figure and described in the text. |
Endothelial cells have a remarkable capability to transport substances across their layers through a variety of mechanisms. One of the most impressive features of endothelial cells lining the vasculature is their ability to form fenestrations that serve as extracellular channels. This feature occurs predominantly in capillary structures having large rates of transcapillary volume flux. Both glomerular and peritubular capillary systems have fenestrations. The glomerular capillaries have abundant, well-rounded fenestrations that are 50 to 100 nm in diameter and lack a diaphragm. These fenestrations constitute highly permeable pathways for the large volume of plasma filtrate that continuously traverses from the glomerular capillaries into the Bowman space. Although it is not clear whether subtle changes in the size of the fenestrations contribute to the regulation of the hydraulic conductivity of the glomerular capillary barrier, it is apparent that their integrity is essential for the maintenance of glomerular filtration.2,75
The fenestrations of the peritubular capillaries are bridged by a thin diaphragm and are smaller in diameter (20 nm). Considering the total number of capillaries, there is much more peritubular than glomerular capillary surface area. However, because the overall reabsorptive rate by the peritubular capillaries is nearly equal to the GFR, the average hydraulic conductivity of the peritubular capillaries per unit of surface area is estimated to be less than that of glomerular capillaries. Fenestrations also exist in the terminal segments of afferent arterioles, and they may provide a pathway for renin entry into the circulation from juxtaglomerular granular cells.2,76
TRANSCAPILLARY EXCHANGE IN RENAL MICROCIRCULATION
Forces Governing Ultrafiltration at the Glomerulus
Bulk movement of fluid across capillary membranes of the renal microcirculation is passive in nature, driven by physical forces. As blood flows from the afferent arterioles into the glomerular capillary tufts, the high hydrostatic pressure predominates over the counteracting forces caused by Bowman space hydrostatic pressure and plasma colloid osmotic pressure. Therefore, fluid is driven from the glomerular capillaries through the endothelial fenestrations, across the basement membrane, and between the podocyte foot processes into the Bowman space. This movement of fluid can be described quantitatively by the Starling filtration-reabsorption principle, which is based on the premises that (1) water and solutes flow through extracellular channels or pathways and (2) the diameters of these channels are large with respect to water molecules, hydrated ions, and solutes of low-molecular weight, such as urea, glucose, and amino acids. Thus, except for the larger solutes, mainly plasma proteins that approach or exceed the size of the channels, the filtrate is translocated without substantive compositional alterations. Detailed consideration of the structure and biochemical composition of the glomerular filtration barrier is provided in Chapter 1.
The physical forces acting across the glomerular membrane are glomerular capillary pressure (Pg), Bowman space
pressure (PB), glomerular plasma colloid osmotic pressure (πg), and colloid osmotic pressure of filtrate in the Bowman space (πB). The filtering capacity of the filtration barrier is expressed as the glomerular filtration coefficient (Kf), which is the product of the hydraulic conductivity of the glomerular membrane (Lp) and the total filtering surface area (Sf). Because the net forces change as fluid is filtered along the length of the glomerular capillaries, total GFR can be expressed by the equation:
pressure (PB), glomerular plasma colloid osmotic pressure (πg), and colloid osmotic pressure of filtrate in the Bowman space (πB). The filtering capacity of the filtration barrier is expressed as the glomerular filtration coefficient (Kf), which is the product of the hydraulic conductivity of the glomerular membrane (Lp) and the total filtering surface area (Sf). Because the net forces change as fluid is filtered along the length of the glomerular capillaries, total GFR can be expressed by the equation:
where x represents the normalized length of the glomerular capillaries, with 0 designating the afferent end and 1 designating the efferent end; σ (sigma) is the reflection coefficient, which has a range of 0 to 1. When sigma is 1, proteins are completely “reflected” by the capillary wall, and the colloid osmotic pressure is maximally effective. Normal glomerular capillaries are extremely efficient in restricting the passage of macromolecules, and the amount of protein present in the normal filtrate in the Bowman space is less than 0.1% of the plasma protein. For practical considerations, the effective colloid osmotic pressure is considered equivalent to that of the plasma in the glomerular capillaries (πg). As is shown in Figure 3.8, this value increases progressively along the length of the capillaries as a function of the relative volume of protein-free fluid that is filtered. Because colloid osmotic pressure is the major force retarding glomerular filtration, filtration is greatest in the initial segments of the glomerular capillaries and decreases progressively along the length of the capillaries.1,2,77
The exact hydrostatic pressure drop along the glomerular capillaries is uncertain because experimental assessment is not possible. Nevertheless, there are abundant parallel capillaries that collectively have a large cross-sectional area relative to that of the afferent and efferent arterioles; thus, the hydrostatic pressure drop along the glomerular capillaries is small as compared with the pressure drops across the afferent and efferent arterioles. Computations based on the number and dimensions of the glomerular capillaries yield estimates that are in the range of 1 to 4 mm Hg. Thus, Pg is usually treated as a constant value. With these simplifying assumptions and the use of average values for hydrostatic and colloid osmotic pressures in glomerular capillaries, the more commonly used formulation for GFR results:
The net, or mean, effective filtration pressure (EFP) is calculated as
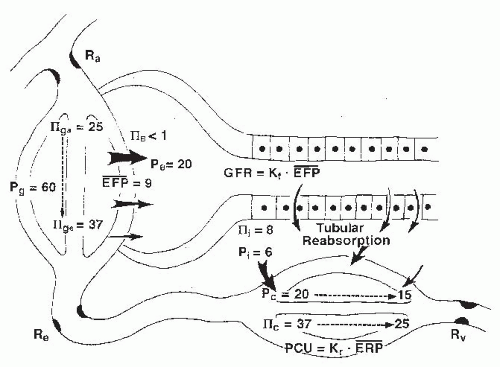 FIGURE 3.8 A schematic diagram of the forces responsible for the filtration of fluid from the glomerular capillaries and the reabsorption of fluid into the peritubular capillaries. The values are considered representative of forces in humans. Ra, afferent arteriole resistance; Re, efferent arteriole resistance; Pg,B,c,i, pressure in glomerular capillaries, Bowman’s space, peritubular capillaries, and renal interstitium; IIg,B,C,i, colloid osmotic pressure in glomerular capillaries, Bowman’s space, peritubular capillaries, and renal interstitium; EFP, effective filtration pressure; Kf, filtration coefficient; GFR, glomerular filtration rate. |
The increase in plasma protein concentration is a direct function of the filtration fraction, defined as the quotient of GFR and renal plasma flow. Because of the nonlinear relationship between plasma protein concentration and colloid osmotic pressure, the rate of increase in colloid osmotic pressure from the afferent to the efferent arteriole increases progressively (Fig. 3.9). Empirically derived relationships allow the prediction of colloid osmotic pressure (π) from the total plasma protein concentration (C) when the albumin-to-globulin (A/G) ratio is known. The commonly used Landis-Pappenheimer relationship
applies to an A/G ratio of about 1.2, which is considered normal for humans.2
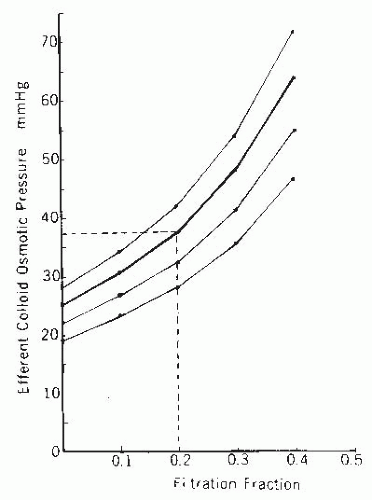 FIGURE 3.9 A nomogram relating the efferent arteriolar colloid osmotic pressure to the initial plasma colloid osmotic pressure and the filtration fraction. Normal afferent arteriolar colloid osmotic pressure, 25 mm Hg, is indicated by the thicker curve. An example of how to estimate efferent arteriolar colloid osmotic pressure for any given filtration fraction and plasma colloid osmotic pressure is shown by the dashed lines. |
The efferent arteriolar colloid osmotic pressure is determined by the initial plasma value and the filtration fraction. The nomogram in Figure 3.9 allows for the estimation of the efferent arteriolar colloid osmotic pressure and is independent of A/G ratios. For example, at a normal filtration fraction of 0.20 and normal plasma colloid osmotic pressure of 25 mm Hg, the predicted value for efferent colloid osmotic pressure is 37 mm Hg.
The hydrostatic pressure in Bowman space (PB) in humans has not been measured directly. In laboratory animals, PB is equal to proximal tubular pressure, which ranges from 11 to 15 mm Hg in rats and from 18 to 22 mm Hg in dogs. Also, proximal tubular pressure is slightly higher than the pressure in adjacent peritubular capillaries. Peritubular capillary pressure has also not been measured directly in humans, but it can be estimated from intrarenal venous pressure measurements obtained by retrograde passage of a renal vein catheter. Values obtained in humans are 20 to 25 mm Hg and provide reasonable estimates of proximal tubular pressure. This pressure plus an average efferent colloid osmotic pressure of 37 mm Hg provides a minimal glomerular pressure in humans in the range of 57 to 62 mm Hg; actual values are higher to the extent that there is net filtration pressure at the terminal end of the glomerular capillaries.
Micropuncture studies in animals also indicate that glomerular pressure is 50 to 60 mm Hg and approximately 40 mm Hg greater than the opposing hydrostatic pressure in the Bowman space. From this difference in transglomerular capillary hydrostatic pressure, it can be calculated that EFP ranges from 15 mm Hg at the afferent end of the glomerular capillaries to about 3 mm Hg at the efferent end, yielding an average EFP of 9 mm Hg (Fig. 3.8). Using this value and one of 120 mL per minute for total GFR, a Kf of 13 mL/min/mm Hg for the total nephron population is calculated. Assuming there are 2 million nephrons in both human kidneys, the Kf for a single glomerulus is approximately 6 to 7 nL/min/mm Hg. This value generally agrees with micropuncture measurements, which indicates that Kf for an individual glomerulus is 4 to 5 nL/min/mm Hg in dogs and 2 to 5 nL/min/mm Hg in rats. The large variation in Kf among rats is due in part to differences observed among different strains.2,77
The filtration process can operate under one of two conditions. The first condition is the case described previously, in which filtration continues throughout the entire length of the glomerular capillaries and a finite positive EFP remains at the efferent end of the glomerular capillaries. This pattern of disequilibrium is shown by the solid lines in the left panel of Figure 3.10. The second condition occurs when the increase in colloid osmotic pressure is so rapid that the forces favoring and opposing filtration become equal at some point within the capillary system, a condition termed filtration pressure equilibrium (Fig. 3.10, solid lines in right panel). Under equilibrium conditions, the latter part of the available filtering surface area is not used and becomes a functional reserve. Studies in some strains of rats have suggested that the normal condition is one of filtration equilibrium. Data from other strains of rats and dogs indicate that, under normal circumstances, glomerular capillary hydrostatic pressure is sufficiently high and the Kf is sufficiently low to prevent the achievement of filtration equilibrium within the glomerular capillaries, and thus filtration occurs along the entire length of the glomerular capillaries.2
A physiologic consequence of the equilibrium or disequilibrium of filtration pressures is the influence of plasma flow on GFR. Using a mathematical model presented later, the specific effect of plasma flow can be predicted for both conditions when the transcapillary hydrostatic pressure gradient is kept constant. As shown by the dashed line in Figure 3.10 (right panel), an increase in plasma flow to a system in filtration equilibrium diminishes the rate of increase of colloid osmotic pressure along the length of the glomerular capillaries. The EFP is not dissipated as quickly, and the point of equilibration of hydrostatic and colloid osmotic forces is moved distally, which, in effect, results in the recruitment of additional filtering surface area (Sf) and an increase in the functional Kf. Consequently, increases in plasma flow can increase the GFR proportionately even when glomerular capillary pressure is unchanged. In the case of filtration
pressure disequilibrium, increases in plasma flow increase GFR only modestly as a consequence of a reduced colloid osmotic pressure profile, and there is no net recruitment of previously unused surface area (see Fig. 3.10, dashed lines in left panel). Thus, the magnitude of a selective plasma flow effect is smaller during filtration pressure disequilibrium than during equilibrium. In humans, the low filtration fraction and the relative lack of plasma flow dependence of GFR suggest that the filtration process continues throughout the entire length of the glomerular capillaries (i.e., disequilibrium, as shown in the left panel of Fig. 3.9).1,2,77
pressure disequilibrium, increases in plasma flow increase GFR only modestly as a consequence of a reduced colloid osmotic pressure profile, and there is no net recruitment of previously unused surface area (see Fig. 3.10, dashed lines in left panel). Thus, the magnitude of a selective plasma flow effect is smaller during filtration pressure disequilibrium than during equilibrium. In humans, the low filtration fraction and the relative lack of plasma flow dependence of GFR suggest that the filtration process continues throughout the entire length of the glomerular capillaries (i.e., disequilibrium, as shown in the left panel of Fig. 3.9).1,2,77
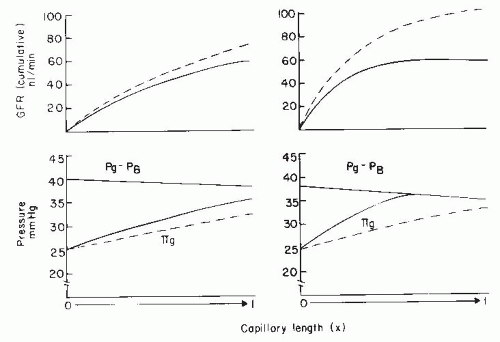 FIGURE 3.10 A comparison of filtration dynamics in conditions of filtration equilibrium (right) and disequilibrium when filtration occurs throughout the length of capillary (left). The lower panels represent the changes in the transcapillary hydrostatic pressure gradient (Pg – PB) and the glomerular plasma colloid osmotic pressure (πg), and the upper panels represent the cumulative GFR along the length of the glomerular capillary. The dashed lines indicate the changes occurring in response to doubling of plasma flow under both conditions. Pg, glomerular capillary hydrostatic pressure; PB, hydrostatic pressure in Bowman’s space. |
Glomerular Permeability to Macromolecules
Experiments examining the filterability of test molecules of different sizes, shapes, and charges have been used to characterize the hydrodynamic properties of the filtration barrier. A sieving coefficient (Φ), or fractional clearance of a test molecule, is obtained relative to that of a freely filtered reference molecule such as inulin. Accurate determinations can be made when both substances enter the urine by means of filtration and are not subjected to tubular reabsorption or secretion. Such data have been fitted to various theoretic models based on limiting membrane structures, consisting of an impermeable matrix that is perforated with cylindrical pores, rectangular slitlike openings, or a meshwork of fibrous or granular gel-like structures. An evaluation of molecular sieving or steric restriction in each model, however, is based on the principle of geometric exclusion of large solute molecules from a portion of the membrane that is accessible to water and small solutes. In essence, the larger molecules that approach or exceed the effective size of the channels are restricted or “sieved.” Conceptually, the simplest model that is applicable to the glomerular barrier consists of a size-discriminating membrane with a large population of fluid-filled cylindrical pores of about 5 nm in radius, which totals approximately 5% of the total surface area. There may also be a very small population of much larger pores.2,75
Studies involving quantitative consideration of macromolecular passage through capillary membranes have relied on the thermodynamic approach developed by Kedem and Katchelsky. Derivations for solute flux (Js) across a constraining membrane include a convection term, which is the solute flux that occurs as a consequence of the bulk volume flow (Jv), and a diffusion flux, which is a function of the concentration gradient of the solute. In its most elementary form, solute flux due to convection is
and solute flux due to diffusion is
where Jv is the volume flow (in this case the GFR), and Cs is the average concentration across the membrane; sigma (σ) is the reflection coefficient previously discussed. ΔCs is the concentration difference across the capillary wall, and PS is the diffusional, permeability surface-area product coefficient. With small uncharged molecules, such as glucose, sigma approaches zero and thus glucose flux is simply defined by the product of GFR and the plasma glucose concentration. For very large molecules that are restricted with almost complete efficiency, sigma approaches 1 and thus solute flux due to convection is negligible. The most relevant example is for plasma albumin. Using a value of 1 to 3 mg per deciliter for albumin concentration in early tubular fluid and a systemic plasma albumin concentration
of 3,600 mg per deciliter, sigma is greater than 0.99. Furthermore, the PS coefficient is so low (0.001 mL per minute) that solute flux due to diffusion also approaches zero. These quantitative considerations also highlight the difficulty in attempting to evaluate mechanisms of proteinuria. Theoretically, protein passage across the glomerular membrane could increase more than 100-fold, which could be accounted for by a change in sigma from 0.99 to 0.95. Such small changes in membrane permeability would not be expected to be associated with discernible morphologic changes.2,75
of 3,600 mg per deciliter, sigma is greater than 0.99. Furthermore, the PS coefficient is so low (0.001 mL per minute) that solute flux due to diffusion also approaches zero. These quantitative considerations also highlight the difficulty in attempting to evaluate mechanisms of proteinuria. Theoretically, protein passage across the glomerular membrane could increase more than 100-fold, which could be accounted for by a change in sigma from 0.99 to 0.95. Such small changes in membrane permeability would not be expected to be associated with discernible morphologic changes.2,75
Passage of macromolecules across capillary membranes is dependent on several factors in addition to the effective radius. These factors include the electrical charge and the structural conformation and rigidity of the molecule. As shown in Figure 3.10, the glomerular sieving coefficient or fractional clearance (usually determined as CD/CIN) of graded sizes of electrically neutral dextran molecules declines progressively as effective radius and molecular weight increase. Water, electrolytes, and other small, uncharged solute molecules with an effective Stokes-Einstein radius of less than 1.8 nm freely permeate. As the effective radius increases, there is a progressive restriction. The fractional clearance of macromolecules the size of immunoglobulin G (IgG) (5 nm) is essentially zero. For the same equivalent radius, the fractional clearances of albumin (3.6 nm) and negatively charged dextran sulfate are considerably lower than the clearances of uncharged molecules. In addition, polycationic macromolecules are filtered more readily than neutral molecules. These differences in transport of electrically charged macromolecules are due to the membrane-bound polyanionic glycoproteins that are rich in sialic acid and heparin sulfate residues, which set up a negative electrostatic field that repels polyanions. These are associated with the glycoprotein coat that covers the endothelial fenestrations, the basement membrane, and the podocytes. Partial loss of these anionic sites on the glomerular capillary wall can lead to albuminuria in the absence of any gross structural abnormalities and in cases of mild glomerulonephritis. Such a loss has been induced experimentally by neutralization of the electrostatic barrier with the polycation protamine. In more severe glomerular injury-associated proteinuria, a larger fraction of the filtrate appears to pass through a population of large diameter, nonselective pores.
In addition to size and charge, molecular configuration influences the sieving coefficient (Fig. 3.11). Rigid or globular molecules such as horseradish peroxidase or ficoll have lower sieving coefficients for any given molecular size than neutral dextran polymers with highly deformable linear structures. Thus, it is likely that the curve for neutral dextrans in Figure 3.11 overestimates the true permeability characteristics of more rigid, globular-structured macromolecules such as plasma proteins. Because shape, flexibility, and deformability contribute to the quantitative relationship between molecular size and transglomerular solute flux, it is difficult to establish the true dimensions of the extracellular channels. Data currently available indicate that the effective radius of the channels in the glomerular membrane is in the range of 4.5 to 6 nm.2,75
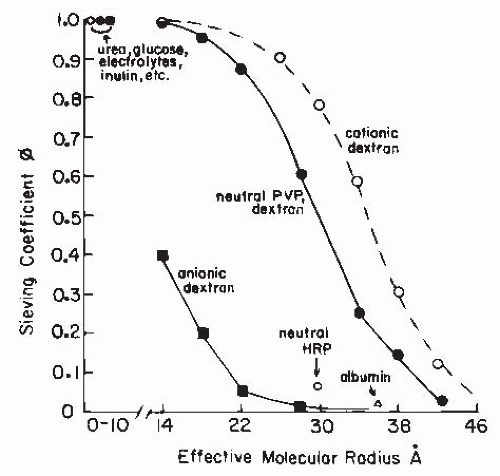 FIGURE 3.11 Representative sieving curves for several test molecules in the glomerular circulation. The curve representing neutral molecules is based on data obtained with the use of polyvinylpyrrolidone (PVP) and neutral dextran. The curves for anionic and cationic molecules are based on studies with charged dextrans. Also shown are the sieving values for neutral horseradish peroxidase (neutral HRP) and for albumin. The smaller molecules are shown to have a sieving coefficient of 1.0. See text for details. |
Recent studies have challenged the generally held notions described previously regarding glomerular permeability and have suggested that much greater amounts of albumin are filtered across the glomerular capillaries and that most of it is then reabsorbed in the proximal tubules by megalin and other macromolecule transporters. Studies based on measurements of glomerular permeability of fluorescent labeled albumin suggest that even normal glomerular capillaries allow passage of albumin that is avidly bound and retrieved by proximal tubules. This concept has been met with substantial resistance and alternative studies have failed to indicate such high levels of albumin passage across normal glomerular capillaries. Advanced multiphoton determinations have yielded a glomerular sieving coefficient of 0.001, a value consistent with the view that the primary determinant of albuminuria is of glomerular origin and that charge does play a significant role.78,79,80,81,82,83
The controversy about glomerular permselectivity highlights important recent findings regarding the extremely complex nature of the glomerular barrier because it consists of three distinct layers in series; each having its own selectivity characteristics. Gene targeted mouse models illustrate the
important role that podocytes have in restricting macromolecules. In particular, studies of the structural and molecular characteristics of the slit diaphragms between adjacent podocytes reveal an extremely complex network of molecular interactions that serve to maintain the normal structure of the podocytes and their close relationship with the basement membranes. The structure of the glomerular membrane is described in detail in Chapter 1. With regard to macromolecular permeability, the podocyte slit-diaphragm layer and its complex array of proteins, including nephrin, podocin, cadherin, and integrins, are clearly identified as the final barrier responsible for the extremely high degree of restriction. Nevertheless, the emerging consensus is that all of the three major restriction sites make a contribution. In essence, when the endothelial glycocalyx is compromised, proteinuria develops. Disorganization of the basement membrane also leads to proteinuria. Furthermore, disruption of the nephrin-actin cytoskeleton complex of the podocyte layer and foot process effacement are associated with the greatest degree of proteinuria. Conceptually, it is attractive to attribute a progressively greater reflection coefficient (sigma) to the three layers in series.81,84
important role that podocytes have in restricting macromolecules. In particular, studies of the structural and molecular characteristics of the slit diaphragms between adjacent podocytes reveal an extremely complex network of molecular interactions that serve to maintain the normal structure of the podocytes and their close relationship with the basement membranes. The structure of the glomerular membrane is described in detail in Chapter 1. With regard to macromolecular permeability, the podocyte slit-diaphragm layer and its complex array of proteins, including nephrin, podocin, cadherin, and integrins, are clearly identified as the final barrier responsible for the extremely high degree of restriction. Nevertheless, the emerging consensus is that all of the three major restriction sites make a contribution. In essence, when the endothelial glycocalyx is compromised, proteinuria develops. Disorganization of the basement membrane also leads to proteinuria. Furthermore, disruption of the nephrin-actin cytoskeleton complex of the podocyte layer and foot process effacement are associated with the greatest degree of proteinuria. Conceptually, it is attractive to attribute a progressively greater reflection coefficient (sigma) to the three layers in series.81,84
Hemodynamics in Peritubular Capillaries and Its Role in Fluid Reabsorption
Virtually all of the peritubular capillary network stems from efferent arterioles. About 85% of the postglomerular blood flow is distributed to peritubular capillaries in the cortex, and the remaining 15% goes to the medulla and papilla (Fig. 3.5). The overall density of peritubular capillaries and the total surface area are considerably greater than those of glomerular capillaries. The peritubular capillary wall consists of a fenestrated endothelial layer covered by a thin basement membrane. Per unit of surface area, it has a lower hydraulic conductivity and a slightly higher permeability to large molecules than the glomerular wall.
In a manner analogous to the process of filtration, the peritubular capillary reabsorption (PR) of interstitial fluid that is reabsorbed by the renal tubules is determined by the imbalance of hydrostatic and osmotic forces between the interstitial space and adjacent peritubular capillaries. If one considers the forces responsible for reabsorption into the capillaries, then
where Kr is the reabsorptive coefficient, πc and πi represent the average colloid osmotic pressures in the capillaries and in the interstitial fluid, and Pc and Pi represent the corresponding hydrostatic pressures.
As plasma emerges from the glomerular capillaries, it has a colloid osmotic pressure of 35 to 37 mm Hg (Fig. 3.8). Furthermore, the hydrostatic pressure drops about 40 mm Hg along the efferent arteriole (Fig. 3.3), yielding an initial peritubular capillary pressure of about 20 mm Hg. With regard to the interstitial compartment, πi and Pi are about 6 to 8 mm Hg and tend to cancel each other out. Thus, the mean effective reabsorption force is 15 mm Hg at the beginning of the peritubular capillary bed. As fluid is reabsorbed into the capillaries, plasma proteins are diluted and the colloid osmotic pressure progressively decreases to the original value entering the kidney. There is also a small decline in capillary hydrostatic pressure along the peritubular capillaries. Thus, there is an effective reabsorptive force over the entire length of the peritubular capillaries, which falls from about 15 mm Hg to about 8 mm Hg (Fig. 3.8). The hydraulic reabsorptive coefficient, Kr, for the peritubular capillaries is about 9 to 10 mL/min/mm Hg, which is slightly lower, overall, than the glomerular Kf. This suggests a lower hydraulic conductivity, which is compensated by the larger surface area of the peritubular capillaries.
With regard to macromolecular permeability, the situation existing in the peritubular circulation contrasts with that in the glomerulus because the convective component is directed inward in association with the continuous fluid reabsorption. Thus, the loss of macromolecules from the postglomerular capillaries occurs only as a consequence of diffusion of macromolecules from the plasma into the interstitial compartment. Although significant amounts of protein accumulate in the interstitium, the actual permeability is still quite low because of the low removal rate by the lymphatics in the renal cortex. Some studies indicate that the postglomerular circulation constrains molecules that can readily pass through the glomerular membrane. There also may be a small population of pores with diameters greater than 5 nm. Nevertheless, most of the channels have a high degree of efficiency in restricting albumin and other plasma proteins, so their reflection coefficients are very close to 1. This occurrence is due, in part, to an electrostatic barrier similar to that found in the glomerular capillaries such that negatively charged macromolecules permeate more slowly than neutral molecules of the same size. Thus, plasma proteins exert almost their full osmotic pressure across the peritubular capillaries. In spite of these high reflection coefficients, the concentration of albumin in the renal lymph, and presumably in the interstitial fluid, is about one-fourth that in systemic plasma. Although this concentration seems rather high, it should be noted that lymph flow is very low and less than 1% of net protein is lost from the plasma flowing through the peritubular capillaries.2
Maintaining the high density of peritubular capillaries is of critical importance in providing adequate oxygenation to the surrounding tubules. Renal interstitial inflammation may lead to reduced peritubular capillary density and the impairment of renal function, resulting in salt-sensitive hypertension. Peritubular capillary loss in renal transplant patients is associated with interstitial fibrosis and tubular atrophy, leading to reduced renal function.85,86
Lymphatic capillaries, primarily distributed throughout the cortex, are very permeable to protein and fluid. They
serve to return the proteins that leak out of the peritubular capillaries back to the circulation, and it is usually assumed that the protein concentration in the lymph reflects the protein concentration in the interstitial fluid. The normal renal lymph flow in humans is estimated to be about 2 to 5 mL per minute, or less than 1% of the plasma flow. Lymph flow is increased by elevations in interstitial hydrostatic pressure, such as those accompanying diuretic states, ureteral obstruction, or increases in renal venous pressure.87,88
serve to return the proteins that leak out of the peritubular capillaries back to the circulation, and it is usually assumed that the protein concentration in the lymph reflects the protein concentration in the interstitial fluid. The normal renal lymph flow in humans is estimated to be about 2 to 5 mL per minute, or less than 1% of the plasma flow. Lymph flow is increased by elevations in interstitial hydrostatic pressure, such as those accompanying diuretic states, ureteral obstruction, or increases in renal venous pressure.87,88
Capillary Uptake by the Vasa Recta
Efferent arterioles of juxtamedullary nephrons provide the vascular supply to the medulla. These efferent arterioles branch into long-looped capillaries, termed the vasa recta, which descend into the medulla in vascular bundles. The vasa recta bundles are intimately associated with and are surrounded by concentric rings of loops of Henle and collecting ducts. The medullary circulation has the important function of removing water and solutes reabsorbed from descending and ascending loops of Henle and collecting ducts without disrupting the large longitudinal osmotic gradients that exist in the inner medulla during water conserving states. This delicate balance is achieved by virtue of the low blood flow and an efficient countercurrent diffusion of fluid and small molecular-weight solutes, which occur because of the specialized structures of the hairpin-shaped parallel loops of the descending and ascending vasa recta. The end result is passive equilibration and shunting of fluid across the vasa recta loops, from the descending to the ascending limbs, and the trapping of solute at the bends. The descending vasa recta have a continuous thick endothelium but aquaporin-1 channels allow for water efflux. Because protein permeability is low, the high plasma protein concentration of the efferent arteriolar blood is preserved. In contrast, the ascending vasa recta have a highly fenestrated thin endothelium, which greatly facilitates passive reabsorption. The ascending vasa recta also have a higher permeability to protein. However, the hydrostatic pressure in the ascending vasa recta is relatively low, about 10 mm Hg, and probably not much higher than interstitial hydrostatic pressure. In the face of a very small outward hydrostatic pressure gradient, the transcapillary colloid osmotic pressure gradient provides an important reabsorptive force, favoring capillary fluid uptake throughout these specialized capillaries. Importantly, the outer medullary descending vasa recta are encircled at points by contractile pericytes that provide a means to locally regulate blood flow.2,15,19,89,90
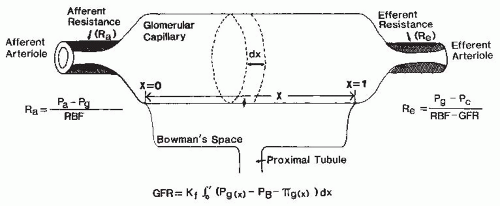 FIGURE 3.12 A “single capillary” model of glomerular filtration dynamics and afferent arteriolar (Ra) and efferent arteriolar (Re) resistances.Pa’ arterial pressure; Pg’ glomerular capillary pressure; Pc’ peritubular capillary pressure; PB’ Bowman’s space pressure; RBF, renal blood flow; GFR, glomerular filtration rate. |
A Quantitative Analysis of Filtration and Reabsorption Dynamics
The mechanisms regulating GFR involve complex interactions among the individual determinants. To achieve a better understanding of the singular effects of each determinant, one can examine the theoretical influence of selective changes in an idealized situation where the other determinants are held constant. Such theoretical predictions can be made from the simple mathematical model shown in Figure 3.12, which analyzes fluid flow dynamics along the length of a single filtering capillary and the resistances of the afferent and efferent arterioles.
This model can be used to analyze the effects on GFR of singular perturbations, such as changes in the transcapillary hydrostatic pressure gradient, the systemic plasma protein concentration, the glomerular plasma flow, and the filtration coefficient. As shown in Figure 3.13 (panel A), changes in the transcapillary hydrostatic pressure difference produce striking responses in GFR. An increase of 10% causes a greater relative increase in EFP leading to an increase in GFR of 19%. GFR is inversely related to plasma colloid osmotic pressure; as can be seen in panel B, a 10% increase of the plasma protein concentration reduces GFR by 25%. The influence of changes in Kf and in plasma flow on GFR are more complex because they affect the rate of rise of plasma colloid osmotic pressure along the capillary bed and thus EFP. Panel C in Figure 3.13 shows that GFR is affected more by decreases than by increases in Kf. The reduced effect of increases in Kf above the normal values reflects the achievement of filtration-pressure equilibrium. Once filtration equilibrium is reached, further increases in Kf enhance ultrafiltration in early portions of the capillary, which causes protein concentration to increase more rapidly. However, this effect is offset because the colloid osmotic pressure equilibrates with the
hydrostatic pressure difference at a more proximal site along the capillary. Thus, the mean EFP and the total GFR remain the same, although the locus of equilibrium is shifted to an earlier site.
hydrostatic pressure difference at a more proximal site along the capillary. Thus, the mean EFP and the total GFR remain the same, although the locus of equilibrium is shifted to an earlier site.
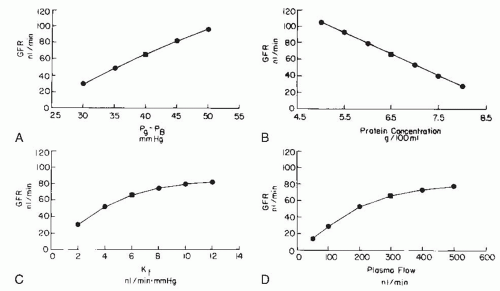 FIGURE 3.13 Theoretical effects of singular perturbations in (A) the transcapillary hydrostatic pressure gradient (Pg – PB), (B) the plasma protein concentration, (C) the filtration coefficient (Kf), and (D) the plasma flow at entry to glomeruli. For these simulations, control values (squares) estimated to be representative of single nephron function in humans were used: GFR =65 nL/min; plasma flow =300 nL/min; (Pg – PB) =40 mm Hg; plasma protein concentration =6.5 g/dL. GFR, glomerular filtration rate. |
Panel D of Figure 3.13 demonstrates that the effects of glomerular plasma flow on GFR are also nonlinear. In the absence of changes in the other determinants, GFR increases only modestly with increases in plasma flow. On the other hand, decreases in plasma flow below 200 nL per minute produce roughly proportional decrements in GFR. This increase in sensitivity is again due to the attainment of filtration equilibrium at the lower values of plasma flow. Glomerular plasma flow exerts these effects by modifying the intraglomerular profile of colloid osmotic pressure and thus mean EFP. The effects of increases in plasma flow during filtration equilibrium and not in equilibrium were discussed earlier and are shown in Figure 3.10. Changes in plasma flow have a relatively small effect on the colloid osmotic pressure profile during filtration disequilibrium (Fig. 3.10). A decrease in plasma flow increases the fraction of plasma being filtered per unit of capillary length in proximal segments. As a result, the rate of rise of colloid osmotic pressure is increased progressively. During filtration pressure equilibrium, GFR is highly plasma flow dependent. Thus, there are two major functional consequences of filtration pressure equilibrium. GFR is insensitive to increases in Kf and is strongly influenced by changes in plasma flow. In contrast, GFR is directly responsive to Kf and is less plasma flow dependent under disequilibrium conditions. In either situation, glomerular capillary pressure is quantitatively a much more powerful determinant of GFR than plasma flow.
A mathematical analysis that is of more physiologic relevance involves an integrated consideration of changes in preglomerular and efferent arteriolar resistance on glomerular dynamics. The predicted effects of constriction and dilation of either afferent or efferent arterioles under idealized conditions are presented in Figure 3.14, when the other resistances as well as other inputs are maintained at normal values. A selective increase in afferent resistance reduces plasma flow and hydrostatic pressure in glomerular and peritubular capillaries. GFR decreases proportionately more than plasma flow and thus the filtration fraction falls. In contrast, an increase in efferent arteriolar resistance reduces plasma flow but increases glomerular pressure. GFR initially increases slightly but then reaches a plateau. The plateau region of mean EFP is due to the counteracting effects of the increases in glomerular capillary and colloid osmotic pressures. From these quantitative considerations, it is apparent that the preglomerular resistance is ideally suited to control GFR. Efferent arteriolar resistance contributes to subtle alterations in GFR but exerts major effects on the dynamics of the postglomerular circulation. It is important to
emphasize that changes in filtration fraction alone cannot be used to determine the localization of resistance changes to a specific manipulation, condition, or drug. For example, combined increases in afferent and efferent resistances reduce the plasma flow proportionately more than the GFR, and the filtration fraction increases. Likewise, combined decreases in afferent and efferent arteriolar resistances increases blood flow proportionately more than GFR and filtration fraction falls. These changes in the filtration fraction have often been interpreted incorrectly as being indicative of selective change in efferent arteriolar resistance.
emphasize that changes in filtration fraction alone cannot be used to determine the localization of resistance changes to a specific manipulation, condition, or drug. For example, combined increases in afferent and efferent resistances reduce the plasma flow proportionately more than the GFR, and the filtration fraction increases. Likewise, combined decreases in afferent and efferent arteriolar resistances increases blood flow proportionately more than GFR and filtration fraction falls. These changes in the filtration fraction have often been interpreted incorrectly as being indicative of selective change in efferent arteriolar resistance.
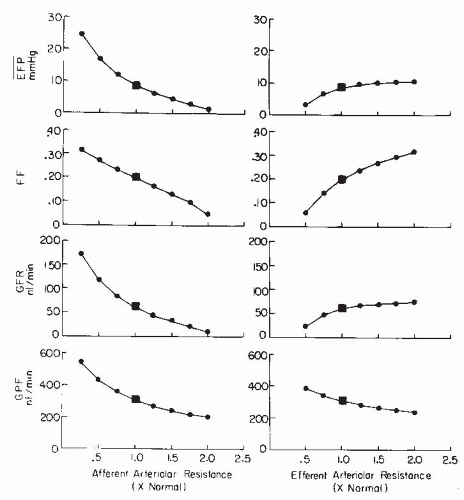 FIGURE 3.14 Effects of increases and decreases in afferent and efferent arteriolar resistance on the glomerular filtration rate (GFR), plasma flow (GPF), the filtration fraction (FF), and the mean effective filtration pressure (EFP). |
Control of Glomerular Dynamics by the Filtration Coefficient
In addition to the regulation of capillary flow and pressure by resistance changes of the preglomerular and postglomerular vascular segments, Kf and Kr may be influenced by many factors. Alterations in the size of the capillaries or closure of a fraction of the capillaries may reduce the available filtering surface area and thus influence Kf. The hydraulic conductivity may be altered by adjustments in the size and number of endothelial fenestrations, the thickness or permeability of the basement membrane, and the number or structural configuration of the slit pores between the foot processes. Recent attention has been focused on the role of the podocytes in control of GFR. Changes in any of these properties could be manifested as changes in Kf.91
Animal studies suggest that vasoconstrictor hormones and some vasodilators are capable of reducing Kf. Also, Kf may be reduced drastically in disease states that involve sclerosis of glomerular capillaries or thickening of the basement membrane. Kf may be increased slightly in certain circumstances, such as increased plasma colloid osmotic pressure. Differences in basal Kf are reported among different species and different strains and colonies of rats. Agents such as Ang II and catecholamines decrease Kf. Blockade of the vascular effects of Ang II negates the Kf lowering effect of prostaglandins E2 and I2 and parathyroid hormone (PTH). In addition, several vasodilators (acetylcholine, bradykinin, and histamine) decrease Kf in rats through a mechanism that is not clear. Although the vasodilator actions are primarily due to NO release, it is not apparent how this would decrease Kf. In contrast to the effects observed in rats, vasodilator
agents do not affect Kf appreciably in dogs. The reason for this apparent species difference is not known. Nevertheless, it seems clear that a variety of paracrine agents, including NO and ET-1, can influence Kf and filtration dynamics.1,36,77
agents do not affect Kf appreciably in dogs. The reason for this apparent species difference is not known. Nevertheless, it seems clear that a variety of paracrine agents, including NO and ET-1, can influence Kf and filtration dynamics.1,36,77
With regard to the postglomerular vasculature, the major regulator of hydrostatic pressure in the peritubular capillaries is the efferent arteriolar tone. For a given flow, an increase in efferent arteriolar resistance increases the pressure drop along this vessel and thus reduces the pressure in peritubular capillaries. An increase in downstream resistance due to venous obstruction or elevated tubular pressure increases hydrostatic pressure in the capillaries. Interstitial hydrostatic pressure changes in the same direction as pressure in the peritubular capillaries. Colloid osmotic pressure of blood entering the peritubular capillaries is primarily regulated by the filtration fraction. A higher colloid osmotic pressure exerts a greater reabsorptive force in the postglomerular circulation. The colloid osmotic pressure in interstitial fluid is determined by a balance of protein entry from circulating plasma and protein exit by means of the lymphatic circulation. In general, stimuli promoting efferent arteriolar constriction reduce hydrostatic pressure in peritubular capillaries and increase efferent arteriolar colloid osmotic pressure, changes that favor increased fluid reabsorption from the renal interstitium into the peritubular capillaries. Vasodilating stimuli have the opposite effects and are often accompanied by natriuretic and diuretic responses. In all cases, however, there is a very intimate coupling between the rate of fluid reabsorption from the tubules into the interstitium and fluid reabsorption from the interstitial compartment into peritubular capillaries.87
THE REGULATION OF RENAL HEMODYNAMICS
The high sensitivity of glomerular and peritubular capillary dynamics to variations in the intrarenal pressures and flows emphasizes the importance of regulatory mechanisms that maintain the intrarenal hemodynamic environment. Overall control is shared by several mechanisms that exert specific effects on various segments of the renal vasculature. Some of these mechanisms are intrinsic to the kidney, whereas others depend on extrarenal signals mediated by neural or hormonal stimuli.
Mechanisms of Autoregulation
Intrinsic paracrine signals can adjust intrarenal vascular resistance in response to a variety of extrarenal perturbations. Alterations in vascular resistance serve to counter the effect of the extrarenal disturbance to stabilize RBF and GFR. The most widely studied manifestation of these intrinsic mechanisms is the phenomenon of renal autoregulation. In response to alterations in renal arterial pressure over a wide range, the kidney adjusts its vascular resistance to maintain, or “autoregulate,” RBF. This range encompasses the physiologically relevant arterial pressures, both above and below normal. In response to reductions in arterial pressure, which may occur during situations such as sleep or recumbence, intrarenal mechanisms decrease renal vascular resistance (RVR) to maintain RBF and GFR at optimum levels. Likewise, increases in arterial pressure, which might occur during exercise or acute episodes of stress, elicit intrarenal signals that increase vascular resistance and thus maintain RBF and GFR at or near control levels. In addition to RBF and GFR, the microvascular and tubular pressures exhibit autoregulatory behavior. Because glomerular pressure and GFR are autoregulated, the predominant adjustments of vascular resistance are localized to the preglomerular arterioles. Figure 3.15 shows representative relationships between the renal arterial pressure and RBF, GFR, and segmental vascular resistances. The responses of vascular resistance to changes in perfusion pressure represent the most commonly investigated aspect of the renal autoregulatory mechanism, but other stimuli, such as increases in ureteral or renal venous pressure or changes in plasma colloid osmotic pressure, also elicit autoregulatory responses. The response serves a negative feedback function to counteract the effect of the disturbance and restore RBF or GFR back toward normal.1,2,92,93,94
Although complex interactions with multiple signaling pathways are involved in the total response, the autoregulatory component of the vasculature requires activation of voltage-dependent Ca2+ channels and is prevented by Ltype Ca2+ channel blockers. Much of the research oriented toward understanding this basic response is focused on the mechanisms by which messages are initiated, transmitted to, and received by the smooth muscle cells to affect the requisite alterations in vascular resistance. The two basic mechanisms that contribute to the autoregulation phenomenon are the myogenic and the TGF mechanisms. A third possible contributor has been identified recently, but the underlying mechanism is not known.2,92,93,94
The myogenic mechanism responds to a distending force on the vessel wall caused by an increase in arterial pressure. The actual distending force can be calculated from the law of Laplace that relates tangential wall tension (T) to the inner radius of the vessel (r) and the transmural pressure difference:
where Pa is intra-arteriolar hydrostatic pressure, and Pi is the interstitial fluid pressure. When the transmural pressure difference increases, wall tension is increased, which activates Ca2+ channels and leads to constriction and a reduction of the radius allowing the tension to return to normal. A myogenic response occurs in preglomerular vessels but not postglomerular efferent arterioles. This may be due to the differential activating mechanisms in these vessels because efferent arterioles do not normally have functional L-type Ca2+ channels. In addition to the afferent arteriole, the arcuate and interlobular arteries also display myogenic responses.
Although a large vessel such as the arcuate artery responds to pressure, its contribution to total resistance is quite small. Thus, the preglomerular arteriolar network has the ability to respond to extrinsic physical or mechanical disturbances by an intrinsic myogenic response of vascular smooth muscle. The initial autoregulatory adjustments in vascular resistance occur rapidly (a few seconds) as a result of a direct local vascular mechanism. Such a fast response is thought to buffer the glomerular capillaries and the tubular network from sudden changes in arterial pressure and protect from high systolic pressures, especially at higher frequencies. Longstanding glomerular hypertension is associated with proteinuria and the development of glomerular sclerosis.1,93,95,96,97
Although a large vessel such as the arcuate artery responds to pressure, its contribution to total resistance is quite small. Thus, the preglomerular arteriolar network has the ability to respond to extrinsic physical or mechanical disturbances by an intrinsic myogenic response of vascular smooth muscle. The initial autoregulatory adjustments in vascular resistance occur rapidly (a few seconds) as a result of a direct local vascular mechanism. Such a fast response is thought to buffer the glomerular capillaries and the tubular network from sudden changes in arterial pressure and protect from high systolic pressures, especially at higher frequencies. Longstanding glomerular hypertension is associated with proteinuria and the development of glomerular sclerosis.1,93,95,96,97
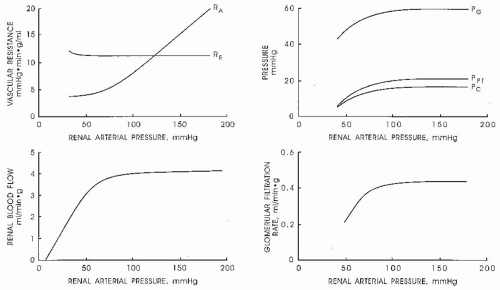 FIGURE 3.15 Representative relationships between renal arterial pressure and renal blood flow (lower left panel), glomerular filtration rate (lower right panel), and segmental vascular resistance (upper left panel) for afferent arteriolar resistance (RA), efferent arteriolar resistance (RE), and hydrostatic pressure (upper right panel) in glomerular capillary (Pg), proximal tubule (PPT), and peritubular capillary (PC). |
A contraction caused by an increase in intraluminal pressure is elicited by cell membrane depolarization and increased Ca2+ entry through voltage-gated L-type Ca2+ channels. L-type channel blockers inhibit the myogenic response and the stretch-activated Ca2+ channels in the preglomerular microcirculation. T-type Ca2+ channels contribute to the myogenic response as a blockade of T-type channels also attenuate autoregulatory responses. In afferent arterioles, the T-type channels may sense relatively small stimuli, which then cause sufficient Ca2+ entry and membrane depolarization to activate voltage-gated L-type channels to activate intracellular signaling pathways and to elicit contraction. The increased [Ca2+]i activates the inositol phosphate cascade to increase IP3 and DAG and activate PKC. Inhibition of PKC attenuates the autoregulatory constrictor response to a pressure increase. Subconstrictor concentrations of either Ang II or ET-1 potentiate myogenic contraction of afferent arterioles. NO attenuates the rate and strength of the myogenic response. Although endothelial cells play a role in the rate of autoregulation, stretchinduced, steady-state myogenic tone is observed in vessels without a functional endothelium. The actual mechanosensitive transducer on vascular smooth muscle cell membranes has not been completely characterized. Cell surface integrins have been postulated to serve as mechanotransducers by responding to shear, stretch, or tension. Sodium channels have also been shown to respond to mechanical deformation via a degenerin/epithelial sodium channel complex.2,14,92,93,98,99,100,101
Additional theories to explain the autoregulatory phenomenon evolved because of the recognition that slower acting hemodynamic mechanisms are responsive to the metabolic demands of tubular transport. The existence of structures within the kidney that seem ideally suited to act as communication links between the distal tubular segments and the vasculature provide the morphologic basis for the TGF hypothesis. Indeed, the unique configuration of the juxtaglomerular apparatus (Fig. 3.4) allows the macula densa to sense some aspect of fluid composition at the end of the ascending loop of Henle and transmit a signal(s) to the afferent arteriole of the parent glomerulus. Thus, the juxtaglomerular apparatus provides the anatomic basis for a negative feedback mechanism, operating in each nephron,
that maintains balance between the hemodynamic inputs that control GFR and the filtered load and the metabolically determined reabsorptive function of the tubules.1,2,102
that maintains balance between the hemodynamic inputs that control GFR and the filtered load and the metabolically determined reabsorptive function of the tubules.1,2,102
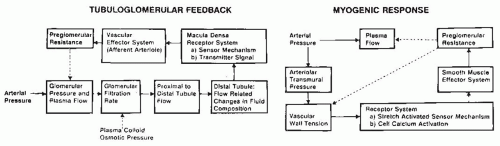 FIGURE 3.16 The macula densa tubuloglomerular feedback hypothesis (left panel) and the myogenic response (right panel) as mechanisms to explain renal autoregulation. Solid lines indicate direct relations; dashed lines indicate inverse effects. |
Autoregulation mediated by the TGF mechanism is shown in the left panel of Figure 3.16. For example, an increase in arterial pressure initially increases RBF, glomerular pressure, and GFR. The increased filtered load increases fluid and solute delivery from the proximal convoluted tubule into the loop of Henle. Such an effect leads to flow-dependent increases in NaCl concentration and osmolality of the tubular fluid in the ascending loop of Henle. The macula densa cells sense the increased tubular fluid NaCl or total solute concentration and transmit a vasoconstrictor signal(s) to the afferent arteriole and thus restore RBF and GFR to preexisting levels. Conversely, a decrease in arterial pressure causes a reduction in tubular fluid flow that elicits dilation of the afferent arterioles. The presence of primary cilia on the lumen of macula densa cells provides a flow sensing mechanism such that increased flow, per se, activates macula densa signals that elicit afferent arteriolar constriction. The TGF mechanism helps explain vascular responses that occur when the solute load to the distal nephron changes as a consequence of changes in tubular reabsorptive function such as those pharmacologically induced in the proximal reabsorption rate.2,12,14,103,104,105
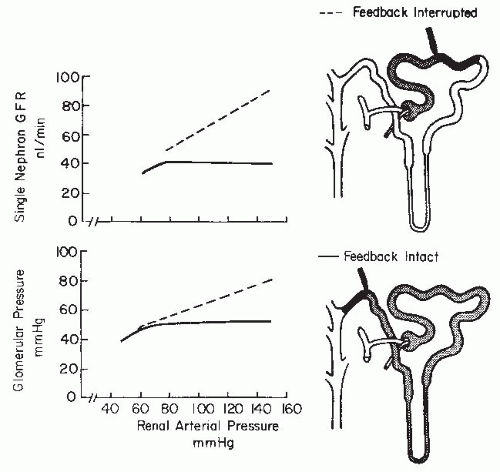 FIGURE 3.17 Responses of single nephron glomerular filtration rate (GFR) and glomerular pressure to changes in arterial pressure during conditions of intact flow to the macula densa (solid lines) and during interrupted flow conditions (dashed lines). |
Studies at the single nephron level indicate that the maintenance of flow to the distal nephron is a requisite for the full manifestation of autoregulation of GFR. As is shown in Figure 3.17, autoregulation of single nephron GFR in
response to acute changes in arterial pressure is highly efficient when tubular fluid flow to the distal nephron is maintained, but it is significantly impaired when flow past macula densa cells is interrupted. Similar responses have been reported for glomerular capillary pressure. Nevertheless, the impairment in GFR autoregulation is not as great as would be predicted for a fully passive mechanism, indicating that the TGF mechanism works in concert with the myogenic mechanism to yield the highly efficient autoregulation characteristic of renal circulation. Recent studies suggest that the interactions are synergistic, in that the presence of active macula densa signals augments the sensitivity of the myogenic response. The afferent arteriole is the effector limb of both mechanisms, and the blockade of Ca2+ entry through L-type channels inhibits both the myogenic and TGF responses. The highly localized myogenic component can respond very quickly to a pressure stimulus. The TGF loop is more complex, involving multiple structures and cell types, and its response to a pressure change being transmitted along the tubule is slower, on the order of 15 seconds. The relative importance of these two systems may vary according to experimental conditions. Normally each contributes about 45% to near perfect autoregulation initiated by an acute, single step change in renal perfusion pressure. A putative third component contributes roughly 10% to the final adjustments in RVR that occurs between 25 and 100 seconds.92,93,96,97,106
response to acute changes in arterial pressure is highly efficient when tubular fluid flow to the distal nephron is maintained, but it is significantly impaired when flow past macula densa cells is interrupted. Similar responses have been reported for glomerular capillary pressure. Nevertheless, the impairment in GFR autoregulation is not as great as would be predicted for a fully passive mechanism, indicating that the TGF mechanism works in concert with the myogenic mechanism to yield the highly efficient autoregulation characteristic of renal circulation. Recent studies suggest that the interactions are synergistic, in that the presence of active macula densa signals augments the sensitivity of the myogenic response. The afferent arteriole is the effector limb of both mechanisms, and the blockade of Ca2+ entry through L-type channels inhibits both the myogenic and TGF responses. The highly localized myogenic component can respond very quickly to a pressure stimulus. The TGF loop is more complex, involving multiple structures and cell types, and its response to a pressure change being transmitted along the tubule is slower, on the order of 15 seconds. The relative importance of these two systems may vary according to experimental conditions. Normally each contributes about 45% to near perfect autoregulation initiated by an acute, single step change in renal perfusion pressure. A putative third component contributes roughly 10% to the final adjustments in RVR that occurs between 25 and 100 seconds.92,93,96,97,106
Increases in flow through the loop of Henle elicit the constriction of the parent afferent arteriole with consequent reductions in glomerular pressure and the filtration rate of the same nephron. These responses are represented in Figure 3.18. Note that the response is nonlinear, with the most sensitive region in the physiologic range of tubular flow. Another important feature is that the reactivity or sensitivity of the TGF mechanism can be modified by a variety of paracrine agents, hormones, and pharmacologic agents. Increased sensitivity is generally associated with extracellular fluid volume contraction, and reduced responsiveness has been observed during expansion of extracellular fluid volume.107
The macula densa sensing segment is located at the end of the ascending loop of Henle, a nephron segment that is virtually impermeable to water and has a powerful NaCl cotransport mechanism. Such transport characteristics result in the delivery of a hypotonic fluid to the macula densa cells. The nature of the transport processes of the thick ascending limb is discussed in detail in Chapter 4. In essence, increases in fluid delivery from the proximal tubule lead to progressive increases in distal flow, sodium chloride concentration, and osmolality. This coupling between fluid flow through the ascending limb and tubular fluid solute concentration at the macula densa provides the means by which volume delivery out of the proximal tubule is sensed and regulated. The signal sensed by macula densa cells may be a specific constituent of tubular fluid such as sodium or chloride or total solute concentration.1,107,108
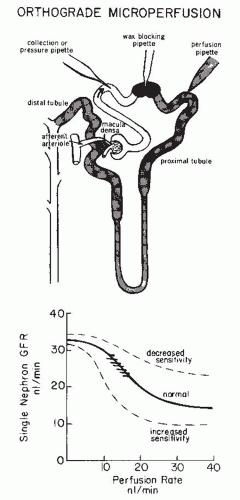 FIGURE 3.18 The relationships between the perfusion rate into a late proximal tubule and a single nephron glomerular filtration rate (GFR). Dashed lines show responses during conditions of decreased and increased feedback sensitivity. The stippled area shows the physiologic range of single nephron GFR as a function of late proximal flow rate. The technique used to obtain the feedback responses is illustrated in the top panel. |
The cellular mechanisms responsible for transmitting signals have remained controversial and intriguing. Macula densa cells, like those of the thick ascending limb of Henle, possess a Na-K-2Cl cotransporter, which is sensitive to the diuretic furosemide. This cotransporter must be functional for TGF signals to be transmitted, but it may not be the actual mechanism that activates intracellular signals, which appear to involve increases in Ca2+ entry from the basolateral side of the macula densa cells and increased [Ca2+]i in response to increases in tubular fluid osmolarity or NaCl concentration
of the luminal fluid. The mechanisms by which [Ca2+]i is related to the formation and release of vasoactive mediators of TGF signals remain unclear. Calcium changes can be counteracted by elevations in cAMP. These intracellular ionic changes signal the macula densa cells to form and secrete constrictor and dilator substances that influence vascular contraction as a function of macula densa transport. The actual final effector messenger between the macula densa cells and the afferent arteriole(s) remain under investigation. Early studies fostered the idea that the effector signal was locally formed Ang II. However, it is now clearly established that the changes in the activity of the renin-angiotensin system modulate the sensitivity of the feedback response but do not directly mediate TGF signaling. The effector agent is thought to operate primarily by activating voltage-dependent Ca2+ channels in the afferent arteriole and perhaps the interlobular artery. Attractive candidates that have been considered recently include purinergic agents such as adenosine and ATP or arachidonic acid metabolites. Several recent studies link the secretion of ATP by macula densa cells to afferent arteriolar constriction via the activation of P2 receptors and associated increases in Ca2+ entry via voltage-dependent Ca2+ channels. In support of this notion, a defective P2X receptor function is associated with impaired TGF function of juxtamedullary nephrons.
of the luminal fluid. The mechanisms by which [Ca2+]i is related to the formation and release of vasoactive mediators of TGF signals remain unclear. Calcium changes can be counteracted by elevations in cAMP. These intracellular ionic changes signal the macula densa cells to form and secrete constrictor and dilator substances that influence vascular contraction as a function of macula densa transport. The actual final effector messenger between the macula densa cells and the afferent arteriole(s) remain under investigation. Early studies fostered the idea that the effector signal was locally formed Ang II. However, it is now clearly established that the changes in the activity of the renin-angiotensin system modulate the sensitivity of the feedback response but do not directly mediate TGF signaling. The effector agent is thought to operate primarily by activating voltage-dependent Ca2+ channels in the afferent arteriole and perhaps the interlobular artery. Attractive candidates that have been considered recently include purinergic agents such as adenosine and ATP or arachidonic acid metabolites. Several recent studies link the secretion of ATP by macula densa cells to afferent arteriolar constriction via the activation of P2 receptors and associated increases in Ca2+ entry via voltage-dependent Ca2+ channels. In support of this notion, a defective P2X receptor function is associated with impaired TGF function of juxtamedullary nephrons.
An alternative view is that the ATP is metabolized to adenosine, which elicits afferent arteriolar vasoconstriction. Consistent with this proposal, mice lacking adenosine A1 receptors do not exhibit TGF responses in superficial nephrons. Also, mice lacking the nucleotidase involved in degrading ATP to adenosine have impaired TGF. Another possibility is that an arachidonic acid metabolite such as 20-HETE participates in mediating TGF-dependent vasoconstriction. Studies show that increased luminal NaCl concentration leads to NO release, which counteracts the constrictor response. In contrast, PGE2 release is increased by reduced NaCl concentration.2,12,103,107,109,110,111,112
The Modulation of Tubuloglomerular Feedback Activity by Vasoactive Agents
Macula densa cells also signal the juxtaglomerular cells to regulate renin synthesis and release. Mechanisms of renin release are discussed in the section on the renin-angiotensin system. In brief, the directional changes in renin release and Ang II formation are opposite to those that are required for Ang II to mediate TGF. For example, high tubular flows and elevated luminal NaCl concentrations are associated with reduced renin release but TGF-mediated afferent arteriolar constriction. Nevertheless, Ang II exerts an important role in modulating TGF activity during changes in salt diet, extracellular fluid volume, and renal perfusion pressure. Tubuloglomerular feedback is absent in mice lacking AT1A receptors, although the renal vasculature is capable of responding to Ang II. Tubuloglomerular feedback is nonresponsive in animals unable to produce Ang II when ACE is mutated.2,14,104
The neuronal NO synthase (NOS) isoform localized in macula densa cells produces NO in response to increased tubular flow above the normal range, which modulates TGF activity. A blockade of NO synthesis augments the strength of TGF responses, whereas enhanced NOS levels attenuate the vasoconstrictor response to increased distal nephron flow. Salt uptake across the luminal membrane by a furosemide-sensitive Na-K-2Cl transporter may link increases in cellular cAMP and [Ca2+]i to NO production. O2 radicals generated in the vicinity of the juxtaglomerular apparatus can act to scavenge NO, limiting macula densa NO signaling and thereby producing vasoconstriction and enhancing TGF activity. Normal TGF is found in gene knockout animals lacking neuronal NOS.2,113,114,115
Arachidonic acid metabolites also modulate TGF activity and interact with other vasoactive modulators. Cyclooxygenase 2 (COX-2) has been localized to macula densa cells and the surrounding ascending loop of Henle cells; the release of PGE2 from macula densa cells occurs in response to reduced luminal NaCl. A COX-2 metabolite attenuates the vasoconstrictor autoregulatory and TGF-mediated response of the afferent arteriole to an increase in arterial pressure. Such a dilator agent also appears to contribute to the macula densa production of NO, which inhibits afferent arteriolar responses to pressure. Thromboxane A2 and a cytochrome P450 metabolite such as 20-HETE are also involved in the constrictor limb of TGF. However, gene targeting rendering the thromboxane receptor nonfunctional has no effect on TGF activity.104,116,117,118
Recent evidence supports the existence of a second TGF loop that links increases in connecting tubule sodium reabsorption via epithelial sodium channels to dilation of the afferent arteriole of the parent glomerulus. It is noteworthy that the response of this positive feedback loop is opposite to the constrictor signal arising from macula densa cells in response to increased salt delivery to the end of the thick ascending limb of Henle. The connecting tubule signal transmitted to the afferent arteriole to increase GFR involves COX-derived prostaglandins and epoxygenase-derived EETs. The magnitude of this feedback response is enhanced by Ang II acting on AT1 receptors to stimulate epithelial sodium channel activity and sodium reabsorption. The connecting tubule-glomerular feedback circuit may function to dampen the effects of vasoconstrictor stimuli on the afferent arteriole.119,120
The Renin-Angiotensin System
The Formation of Ang II
The renin-angiotensin system exerts control of renal hemodynamics via its major vasoactive metabolite Ang II, which acts as both a circulating hormone and a locally generated paracrine agent. Renin is a proteolytic enzyme that cleaves Ang I from renin substrate (angiotensinogen) that is formed primarily by the liver but also in the kidney. Renin is synthesized primarily in epithelioid granular cells of the
juxtaglomerular apparatus and is secreted into the surrounding interstitium; renin is also formed in proximal tubule cells and principal cells of connecting tubule and collecting duct segments. Angiotensinogen availability in the plasma and intrarenal compartments is less than is required to produce maximum reaction velocity, so alterations in substrate levels contribute to the regulation of Ang I production. The inactive decapeptide Ang I is then cleaved by ACE to form the active octapeptide Ang II. There are abundant amounts of endothelium-bound ACE in the lungs and in almost all other tissues. Most of the Ang II in the systemic arterial blood is formed in the lungs. The major sites of ACE localization in the kidney are on the luminal surface of endothelial cells lining arteries and arterioles (in particular, the afferent arterioles), but also the efferent arterioles and the glomerular capillaries, and on the brush border and basolateral membranes of the proximal tubule; extravascular ACE is also present in the interstitial compartment and on the lumen of collecting duct segments.2,13,121,122,123,124,125
juxtaglomerular apparatus and is secreted into the surrounding interstitium; renin is also formed in proximal tubule cells and principal cells of connecting tubule and collecting duct segments. Angiotensinogen availability in the plasma and intrarenal compartments is less than is required to produce maximum reaction velocity, so alterations in substrate levels contribute to the regulation of Ang I production. The inactive decapeptide Ang I is then cleaved by ACE to form the active octapeptide Ang II. There are abundant amounts of endothelium-bound ACE in the lungs and in almost all other tissues. Most of the Ang II in the systemic arterial blood is formed in the lungs. The major sites of ACE localization in the kidney are on the luminal surface of endothelial cells lining arteries and arterioles (in particular, the afferent arterioles), but also the efferent arterioles and the glomerular capillaries, and on the brush border and basolateral membranes of the proximal tubule; extravascular ACE is also present in the interstitial compartment and on the lumen of collecting duct segments.2,13,121,122,123,124,125
Several peptidases act on angiotensinogen to form biologically active peptides other than Ang II. Angiotensin with amino acids 1 to 7 is formed by neutral endopeptidase, but appears to have only slight effects on the renal vasculature under physiologic conditions. Elevated levels of Ang 1 to 7 occur during ACE inhibition and may dilate renal and nonrenal vascular beds. Ang III (angiotensin with amino acids 2 to 8) has actions similar to that of Ang II, which can be blocked by Ang II receptor antagonists. Ang IV (angiotensin with amino acids 3 to 8), a hexapeptide, is reported to produce vasodilation by the release of NO or prostanoids from endothelial cells by acting on a specific AT4 receptor. The recently described enzyme ACE-2 forms Ang (1 to 9) from Ang I and Ang (1 to 7) from Ang II. Thus, ACE-2 can produce more Ang (1 to 7) from Ang II and, in this manner, reduces the available Ang II.124,126,127,128
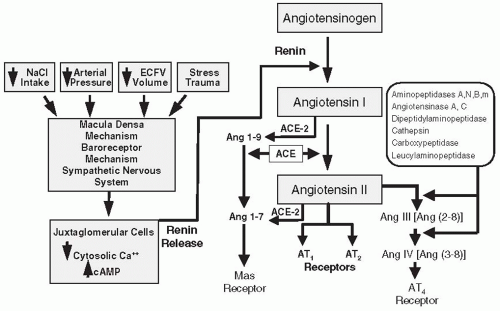 FIGURE 3.19 A schematic representation of the renin-angiotensin system and the mechanisms of renin release. |
Related posts:


Stay updated, free articles. Join our Telegram channel

Full access? Get Clinical Tree


