Fig. 1 a–c
Dose reduction using iterative reconstruction techniques at multidetector computed tomography (MDCT). a Normal-dose MDCT in the venous phase (120 kVp, ref. mAs 230) reconstructed with standard filtered backprojection shows colorectal liver metastases. b Image appearance (120 kVp, ref. mAs 150) using iterative reconstruction (SAFIRE level 3) is slightly different in general due to reduced image noise. Lesions are shown with the same conspicuity. Patient dose is reduced by 36%. c At higher iterative reconstruction levels (SAFIRE level 5), the image appearance is pixilated (plastic-like), especially the liver parenchyma and perirenal fat
MR Imaging Technique
MR examination of the liver must include unenhanced T1-weighted and T2-weighted pulse sequences and contrast- enhanced sequences. Specific pulse sequences vary by manufacturer, patient compliance, and the clinical question being addressed. In- and opposed-phase (or outof- phase) T1-weighted imaging is recommended to allow for maximal tumor detection and characterization of fatty tumors and steatosis/nonsteatosis. T2-weighted pulse sequences with fat suppression provide better lesion contrast than non-fat-suppressed sequences. Diffusionweighted imaging (DWI) has become a standard technique in liver imaging and it is now available on all scanners. In general, DWI depends upon the microscopic mobility of water, called Brownian motion, in tissue. Watermolecule diffusion (and thus the measured signal intensity) depends on tissue cellularity, tissue organization, intactness of cellular membranes, and extracellular space. Usually, low values of diffusion are found in most tumors, which are attributed to their high cellularity [14]. Thus, DWI is helpful for detecting liver metastases and hepatocellular carcinoma (HCC) [15–17]. Preliminary results show its potential for lesion characterization [18], although this is a matter of ongoing discussion [19].
Administration of contrast agents is of importance in liver MR imaging. In general, after intravenous (IV) bolus application of nonspecific (extracellular) gadoliniumbased contrast agents, dynamic imaging (using breathhold T1-weighted gradient-echo pulse sequences) is performed for lesion characterization, detecting tumors in cirrhosis, evaluating tumor response to therapy, and detecting marginal tumor recurrences following tumor ablation. Liver-specific (or hepatobiliary) MR contrast agents are available: gadobenate dimeglumine (Multi- Hance®, Bracco) and gadoxetic acid (Primovist® or Eovist ®, Bayer Healthcare) can be administered IV as a bolus, as with nonspecific gadolinium chelates for dynamic imaging. Liver-specific agents are, to a certain degree, taken up into hepatocytes after IV injection (gadobenate dimeglumine 4–5%; gadoxetic acid ~50%). They provide T1 enhancement of liver tissue in hepatobiliary-phase imaging, which is performed 20 min (gadoxetic acid) or 1–2 h (gadobenate dimeglumine) after contrast material injection. Liver-specific agents are used to improve detection of metastases and to characterize lesions [20–23].
Benign Hepatic Lesions
Cysts
Cysts are common, usually asymptomatic, liver lesions with an incidence between 5% and 14% of the population. At US, hepatic cysts are anechoic, with an imperceptible wall and increased acoustic enhancement behind the cyst. On CT scans, a hepatic cyst appears as a well circumscribed, homogeneous mass with attenuation values similar to water (<15 HU), lacking any mural thickening or nodularity and without contrast enhancement after IV contrast material administration. Small lesions may appear to have higher attenuation measurements because of partial volume averaging. Occasionally, unenhanced scans may suggest the diagnosis of small cysts if the lesions are well visualized as hypodense, whereas very small metastases are usually not discernible on unenhanced scans. In most instances, however, these small lesions remain problematic for characterization at CT. On MR imaging examinations, cysts are well-defined, homogeneous lesions that appear hypointense on T1-weighted images and markedly hyperintense on T2-weighted images. The marked increased T2 signal intensity of even very small cysts can be very helpful to confirm the benign nature of small lesions.
Hemangioma
Hemangioma is the most common benign liver tumor. Typical US characteristics of hemangioma include a sharply circumscribed, well-defined, hyperechoic lesion with distal acoustic enhancement. These are usually homogeneous in appearance when small. Larger hemangiomas (>4 cm) may not demonstrate all of the characteristic appearances and, in particular, are often heterogeneous in appearance.
Hemangiomas are well-defined, hypodense masses on unenhanced CT images. They are hypointense on T1- weighted and markedly hyperintense on T2-weighted images. MRI is useful in differentiating hemangiomas from solid neoplasms based on the long T2 relaxation time (=hyperintensity) of hemangioma compared with other hepatic masses [24, 25]. When using a relatively long T2 echo time (>140 ms), the presence of a homogeneous, bright, light-bulb-appearing lesion is characteristic of a benign lesion, either cyst or hemangioma. Exceptions to this include cystic metastases, gastrointestinal stromal tumor (GIST), and neuroendocrine tumor metastases. Hemangiomas show three distinctive patterns of enhancement at CT/MRI [26], with the key characteristic feature being that areas of lesion enhancement should closely but not exactly follow the enhancement characteristics of blood pool elsewhere [27].
Small lesions (up to ~2 cm) may show immediate and complete filling in the arterial phase, with sustained enhancement in the venous and delayed phases (type I, also termed flash filling) [28] (Fig. 2). The most common enhancement pattern is one of peripheral nodular discontinuous enhancement, which progresses with increased fill-in over time (type II). Larger lesions (>5 cm) or lesions with central thrombosis/fibrosis may lack central fill-in (type III) (Fig. 3). With liver-specific contrast agents, the appearance of hemangiomas in the dynamic arterial and venous phases is similar to that with nonspecific gadolinium chelates. However, in the delayed phase, after 3 min, there may be “pseudo washout” (hypointensity) due to early hepatocellular enhancement of liver parenchyma. In the hepatobiliary phase, hemangiomas tend to be hypointense to the parenchyma, which should not be confused with metastases (Fig. 4).
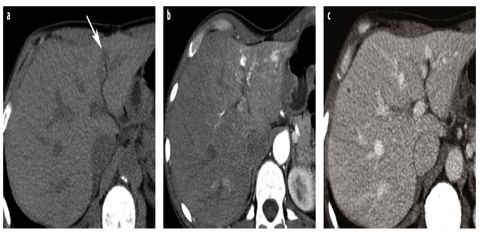
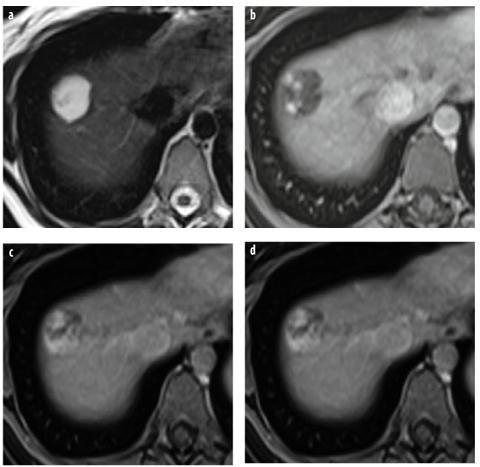
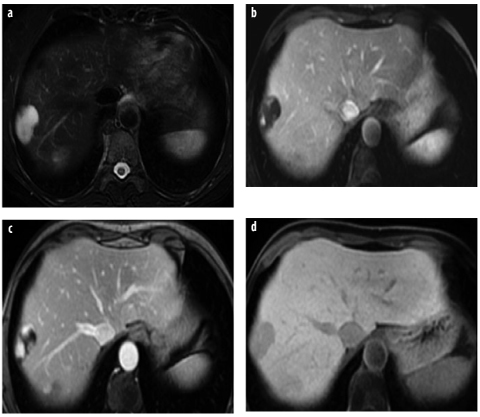
Fig. 2 a–c
Hemangioma type 1. a Unenhanced computed tomography (CT) shows a small, hypodense lesion adjacent to the falciform ligament (arrow). b Contrast-enhanced CT in the arterial phase shows rapid and complete enhancement of the hemangioma, which persists in the venous phase (c). Attenuation of the hemangioma in the enhanced phases is similar to that of the aorta
Fig. 3 a–d
Hemangioma type 3: nonspecific gadolinium chelates. a T2-weighted turbo spin-echo (TSE) image shows a very hyperintense lesion in the right lobe. b, c Dynamic gadolinium-enhanced T1-weighted gradient- echo (GRE) magnetic resonance (MR) images (arterial, venous, and equilibrium phases) show peripheral nodular enhancement with progressive centripetal fill-in. d In the equilibrium phase, after 5 min, there is no complete fill-in
Fig. 4 a–d
Hemangioma type 3: gadoxetic acid. a T2-weighted TSE image shows a large, lobulated lesion of very high signal intensity. b–d Dynamic gadoxetic-acid-enhanced imaging shows peripheral nodular enhancement in the b arterial and c venous phases. In the d hepatobiliary phase, there is marked lesion hypointensity due to washout in the lesion and enhancement of surrounding liver parenchyma
Studies indicate that noncontrast DWI may help differentiate between hemangioma and solid lesions, as the apparent diffusion coefficient (ADC) in hemangiomas is higher than in solid lesions [29].
Focal Nodular Hyperplasia
Focal nodular hyperplasia (FNH) is a benign lesion usually of no clinical consequence other than the confusion it causes when incidentally detected during abdominal imaging examinations. The sonographic appearance of the lesion is nonspecific: the lesion may be isoechoic or slightly hypoechoic [30] to liver, whereas in patients with diffuse hepatic steatosis, it is always hypoechoic. Several common features aid in characterizing FNH lesions. One characteristic feature in larger lesions is a lobular contour, uncommon in malignant lesions. A key feature is the common visualization of central scar, present in approximately two thirds of larger lesions but only one third of small lesions (<3 cm) [31]. The central scar is most often hyperintense on T2-weighted images, with a commashaped or spoke-wheel appearance; this is a key differentiating feature from fibrolamellar HCC, in which the central scar is predominately low signal on T2-weighted MR. The use of color/power Doppler US may demonstrate blood vessels within the scar [32].
FNH are isodense or minimally hypodense on unenhanced and equilibrium-phase postcontrast CT and sometimes detectable only by the mass effect on adjacent vessels. On unenhanced MR images, FNH often has signal intensity similar to hepatic parenchyma, but is usually slightly different on either T1- or T2-weighted images (Fig. 5). Due to the prominent arterial vascular supply, FNH undergoes marked homogenous enhancement during the arterial phase of contrast-enhanced CT/MR imaging, with rapid washout of contrast to isodensity/iso – intensity on venous-phase images [31]. The central scar often enhances on delayed scans [30], which is typical of fibrous component. Another key feature is that other than the scar, these lesions tend to be highly homogeneous in appearance, differentiating them from fibrolamellar HCC.
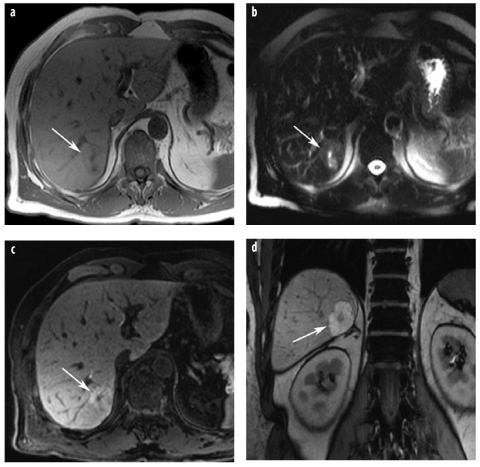
Fig. 5 a–d
Focal nodular hyperplasia (FNH). a The lesion (arrow) is isointense on T1- weighted image and shows a small central scar. b On T2-weighted images, the lesions is also iso intense (arrow), the central T2-weighted bright scar is better discernible. c, d T1- weighted images with liver-specific contrast agent in axial and coronal planes show homogenous uptake of the liver-specific agent, typical for FNH (arrow). The central spokewheel scar is nicely depicted
With liver-specific MR contrast agents, FNH shows enhancement on delayed images after administration of hepatobiliary contrast agents (such as gadoxetic acid or gadobenate dimeglumine) (Fig. 5). This feature is particularly helpful for differentiating between hypervascular metastases (which do not accumulate liver-specific agents) or hepatic adenoma and incidentally encountered FNH [28, 33]. The influence of oral contraceptives on FNH growth is still being discussed. Studies with serial imaging show that growth during follow-up is rare (3–11%) [34, 35] and that oral contraceptives do not appear to stimulate growth [35].
Hepatocellular Adenoma
Hepatocellular adenoma (HCA), while relatively uncommon, is frequently encountered in appropriate populations due to its known association with oral contraceptive and estrogen stimulation and administration of anabolic steroids. Histologically, HCA is composed of cells resembling normal hepatocytes but lacking bile ducts. This is a key feature for histological differentiation between adenoma and FNH [35].
Reports on imaging features of adenomas stress the heterogeneous and varied appearance, with variable consistency in the commonly seen appearances often being hypervascular and when large and heterogenous due the presence of fat, necrosis, or hemorrhage [35, 36] (Fig. 6). These tumors often contain intratumoral fat, and as T1- weighted chemical-shift MR imaging is sensitive for detecting fat, this technique can be extremely helpful in characterizing adenomas. The second typical feature of adenoma is its propensity for spontaneous hemorrhage. If no tumor capsule is present, such hemorrhage may lead to spontaneous rupture with hypotension and even death.
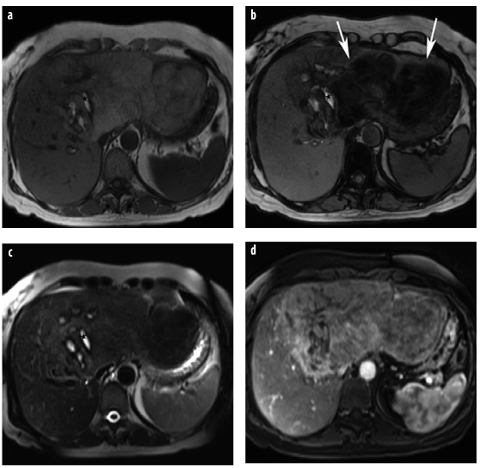
Fig. 6 a–d
Hepatocellular adenoma (HCA). a T1-weighted in-phase GRE images demonstrate a very large mass in a young woman. The mass is inhomogeneous and shows bright spots, suggestive of hemorrhage (asterisk). b Typical signal intensity drop on the opposed-phase image, indicative of intratumoral fat (arrows), whereas the hemorrhage (methemoglobin) does not lose signal intensity. c T2-weighted TSE sequence confirms the presence of hemorrhage (asterisk). Intratumoral fat and hemorrhage are typical for adenoma. d On gadolinium-enhanced image, there is moderate and inhomogeneous enhancement. In a large, very inhomogeneous adenoma, malignant degeneration cannot be ruled out radiologically. However, at surgery, the lesion was an adenoma with central hemorrhage
The presence of intratumoral fat helps to narrow the differential diagnosis, as hemangioma can be excluded and metastases and FNH only very rarely contain fat. On dynamic contrast-enhanced CT or MR, adenomas usually show marked arterial-phase enhancement, with rapid transition to either iso- or hypoattenuating/intense to hepatic parenchyma on portal-venous-phase imaging. Hepatobiliary MR contrast agents (gadobenate, gadoxetic acid) are effective in differentiating small adenomas from FNH due to differences in appearance on the hepatobiliary phase (20 min-1 h). At this phase, liver parenchyma and FNH retain contrast enhancement, whereas adenomas typically do not [37, 38].
The development of genetic classification of tumors has resulted in a new understanding that HCA is not a single form of tumor but a heterogeneous group of tumors with different genetic and pathologic features and natural biology. HCA are classified into three categories based on genetic features that in many ways correlate with specific imaging [39, 40]. The most common subtype is the inflammatory adenoma, typified by intense arterial enhancement and usually lacking any demonstrable fat content (Fig. 7). These lesions often have peliotic changes and thus may retain their contrast enhancement into delayed phases and demonstrate higher T2 signal at MR. These lesions are associated with intratumor bleeding and/or rupture and a slightly increased risk of malignant degeneration.
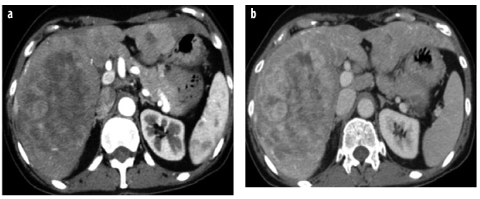
Fig. 7 a,b
HCA, inflammatory type. a Arterial- phase CT shows strong and progressive contrast enhancement, which is retained in the b delayed phase and is typical for peliotic changes in inflammatory adenoma
The second most common category, the human plasma fibronectin (HNF)-1α-mutated HCA, is seen almost exclusively in women, with almost all having a history of oral contraceptive use [39]. These lesions have a high incidence of intracellular fat deposition, resulting in associated imaging findings (Fig. 8). These lesions are the least aggressive subtype and have no risk for developing malignancy and little risk of bleeding unless they are large.
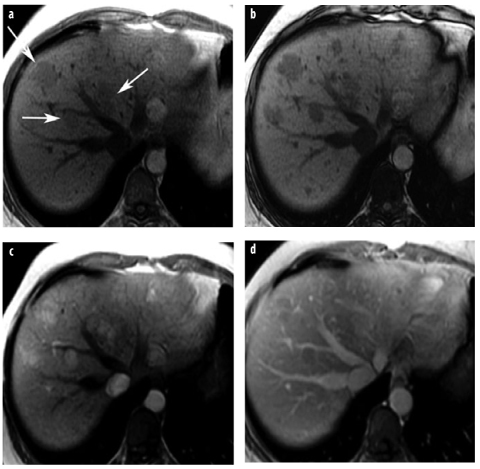
Fig. 8 a–d
HCA in adenomatosis. Human plasma fibronectin (HNF)-1α-mutated type. a, b T1-weighted GRE images: a in-phase image shows several mildly hypointense lesions in the right lobe (arrows), which show considerable signal intensity drop on the b opposed-phase image due to intratumoral fat. c, d After contrast, lesions are hypervascular in the c arterial-phase image, with washout in the d venous phase
The third category of HCA represents those with β- catenin mutations. This genetic alteration has a higher association with malignant degeneration and is associated with testosterone administration and glycogen storage disease. There are no specific imaging features associated with this category, and classification can only be suggested by genetic testing from the tumor. A small percentage of adenomas remain unclassified.
Biliary Hamartomas (von Meyenburg Complex)
Bile-duct hamartomas are congenital malformations of the ductal plate but have no connection with bile ducts. They are of no clinical significance but are incidentally encountered in patients undergoing abdominal imaging examinations. These hamartomas appear as small cystic lesions of round, oval, or irregular shape found either in the periportal region or diffusely spread throughout the liver (Fig. 9). They are usually <10 mm in diameter and lack contrast enhancement; occasionally, however, peripheral rim enhancement may simulate small hypo-vascular metastases [36]. If the enhancement is very thin (<2mm) and only seen on equilibrium-phase images, this is typical of fibrous component of biliary hamartomas and can help characterize these otherwise homogeneous lesions [41]. Occasionally, bile duct hamartomas can be very large, up to 20 cm, and be symptomatic from internal hemorrhage or pressure on adjacent structures [42].
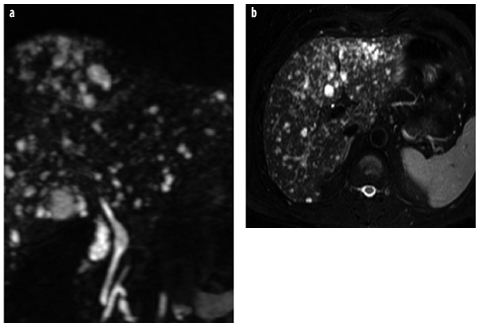
Fig. 9 a, b
Biliary hamartomas (von Meyenburg complex). a, b Coronal and axial T2- weighted images show multiple small cystic lesions of different sizes and shapes (starrysky appearance), typical for biliary hamartomas
Hepatic Abscess and Echinococcus
Abscess appearances can vary depending on etiology (peribiliary abscesses tend to be small and scattered adjacent to the biliary tree; hematogenous distribution via the hepatic artery or via the portal vein in appendicitis or diverticulitis tends to lead to larger lesions). US reveals a cystic lesion with internal echoes. On CT, hepatic abscess appears as a hypodense lesion with a capsule that may show enhancement; cluster sign may be noted when multiple abscesses are present as focal clusters of lesions [43]. CT appearance of hepatic abscess is nonspecific and can be mimicked by cystic or necrotic metastases. Clinical information and laboratory values play a key role in guiding the radiologic diagnosis. Though present in only a small minority of cases, central gas is highly specific for abscess (Fig. 10). On MR imaging, hepatic abscesses are hypointense relative to liver parenchyma on T1-weighted images and markedly hyperintense on T2-weighted images, often surrounded by a local area of slight T2 hyperintensity representing perilesional edema (Fig. 10).
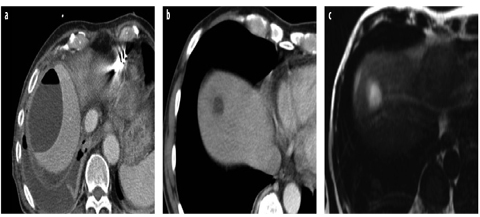
Fig. 10 a–c
Abscesses. a Typical large subcapsular abscess with an air-fluid level and a reactive pleural effusion. b. In another patient, computed tomography (CT) shows a small, thick-walled abscess after pancreatic surgery. c T2-weighted MR image of the same patient shows the thick, indistinct wall and peripheral edema
CT appearance of amoebic liver abscess is nonspecific. It usually appears as a solitary, hypodense lesion, with an enhancing wall that may be smooth or nodular, and is often associated with an incomplete rim of edema. With MR imaging, lesions are hypointense on T1-weighted images and heterogeneously hyperintense on T2-weighted images [44].
On CT scan, involvement of liver by Echinococcus granulosus (hydatid cyst) appears as unilocular or multilocular cysts with thin or thick walls and calcifications, usually with daughter cysts seen as smaller cysts, with septations at the margin of or inside the mother cyst (i.e., this appearance is quite different from a “usual” multicystic tumor). On MR imaging, the presence of a hypointense rim on T1- and T2-weighted images and a multiloculated appearance are considered to be important diagnostic features.
Malignant Primary Tumors
Hepatocellular Carcinoma
HCC is the most common primary liver cancer worldwide and is particularly prominent in the Asian and Mediterranean populations. In European countries, HCC is found mostly in patients with chronic liver disease (particularly hepatitis B or C, liver cirrhosis, or hemochromatosis). HCC consists of abnormal hepatocytes arranged in a typical trabecular, sinusoidal pattern. It may be solitary, multifocal, or diffusely infiltrating.
The imaging appearances of HCC can vary dramatically, but generally can be separated into appearances based on early versus late presentation. Early presentation is identified in patients with chronic liver disease, who either undergo screening for HCC with imaging or undergo frequent liver imaging due to complications of chronic liver disease. In these patients, lesions are typically small (<3 cm) and homogeneous in appearance. In noncirrhotic patients, it is usually asymptomatic, and the patient will not present for imaging until symptoms occur due to a very large lesion, usually heterogeneous in appearance.
US appearance is variable, with iso-, hypo-, or hyperechogenicity (increased echogenicity is often due to tumoral fat). Smaller lesions are typically homogeneous and larger lesions heterogeneous. A surrounding fibrous capsule is often present and relatively characteristic for HCC, appearing as a hypoechoic rim surrounding the lesion.
On unenhanced CT images, most HCCs are hypo- or isodense (the latter particularly if small). The presence of intratumoral fat can lower CT attenuation and is suggestive of primary hepatocellular tumors when seen in appropriate clinical settings; however, this can also be seen in benign adenomas, metastatic liposarcoma, or germ cell tumors in and rare benign angiomyolipomas. Due to their predominant arterial supply, many small HCCs enhance vividly in the arterial phase of hepatic contrast enhancement, becoming iso- or hypoattenuating with hepatic parenchyma in the portal-venous phase of enhancement. Delayed-phase images show most HCC lesions as hypodense compared with surrounding liver (Fig. 11). The washout of contrast in these tumors — differently from the liver parenchyma, which remains enhanced — is a key method by which to characterize HCC in patients, as many benign lesions may show arterial enhancement but most (but not all) do not exhibit this washout. Small HCCs may have a nodule-in-nodule appearance on CT and MR images, especially if the focus of HCC develops within a siderotic regenerative nodule (Fig. 12). At MR imaging, such a nodule may show higher signal intensity on T2-weighted images and display hypervascularity on arterial-phase images.
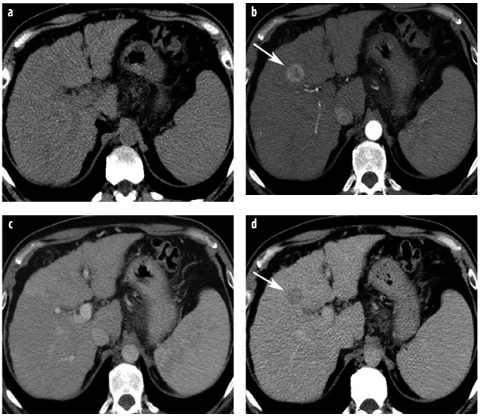
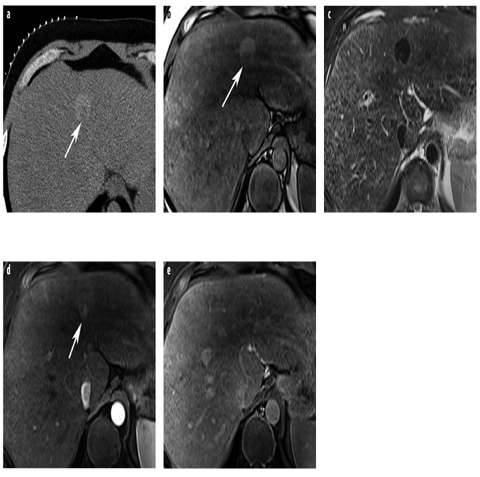
Fig. 11 a–d
Hepatocellular carcinoma (HCC) quadruple-phasic CT for detection and characterization. a Noncontrast CT shows liver cirrhosis and splenomegaly. In segment 4, a lesion is only faintly seen. b In the late arterial phase, a hypervascular HCC is depicted in segment 4 (arrow). c In the venous phase, the lesion is not visible. d The delayed-phase scan reveals lesion washout; the lesion is now hypoattenuating (arrow). The combination of arterial hypervascularity and washout is a highly specific sign of malignancy
Fig. 12 a–e
HCC with nodule-in-nodule appearance. a Unenhanced CT shows a siderotic (hyperattenuating), large nodule, which contains a low-density (nonsiderotic) focus (arrow). b On T1-weighted GRE opposedphase MR image, the marginal nodule shows low signal intensity (arrow). c The large nodule shows siderosis on T2-weighted TSE images; the marginal focus displays higher signal intensity. d, e Dynamic gadolinium-enhanced T1-weighted GRE images show arterial hypervascularity of the malignant focus (arrow) (d) and washout in the equilibrium phase (e)
Several studies address the required phases of scanning for optimizing HCC detection and characterization. Arterial- phase imaging is the most sensitive for detecting small lesions, with highest visibility in the late arterial phase to allow time for contrast diffusion into the tumor parenchyma with no need for early arterial phase imaging [6, 45, 46]. A venous phase is always necessary for tumor detection and assessment of venous structures (Fig. 13), as well as other abdominal organs. For HCC detection, the delayed phase can detect a few lesions that would otherwise go undetected [47] and is also helpful in differentiating HCC from other benign enhancing lesions by demonstrating tumor washout greater than in the liver parenchyma [48]. Unenhanced images are important for documenting siderotic nodules as being different from arterial enhancing lesions and for detecting intratumoral fat; however, to reduce radiation dose, such images can be obtained only intermittently in those patients undergoing serial imaging examinations. It is mandatory, however, in the follow-up after chemoembolization or tumor ablation and for patients in whom hemorrhage may be suspected. In summary, a three- to four-phasic MDCT protocol is recommended by most centers to optimally detect and characterize HCC (Fig. 11). For obvious reasons relative to radiation dose, if a patient is expected to need numerous serial examinations, MR would therefore make a preferred choice.
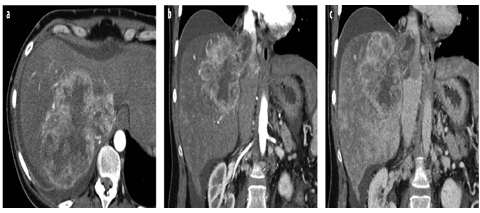
Fig. 13 a–c
Large HCC with tumor thrombus in the inferior vena cava (IVC). a Arterial-phase MDCT shows a large HCC with peripheral irregular rim enhancement, which grows into the right hepatic vein and the IVC. b Arterial- and c venous-phase images in the coronal plane better demonstrate the extension of tumor thrombus in the IVC above the diaphragm
The presence of focal hypervascularity in the arterial phase may lead to false-positive diagnoses [49]: transient focal enhancement of liver parenchyma during arterial phase enhancement, often termed transient hepatic attenuation differences (THAD), can be caused by a multitude of factors. In cirrhotic patients, transient focal enhancement most often is caused by arterial-portal shunting, resulting in inappropriately early focal areas of portal-venous distribution enhancement in the liver. These usually are peripheral, often wedge shaped, and are not round. Subcapsular lesions that do not show a substantial mass effect or a round nature should be evaluated carefully before suggesting the diagnosis of HCC. The combination of hyperdensity on arterial-phase images combined with washout to hypodensity on venous- or delayed-phase images, although not sensitive (33%), is a very specific (100%) feature for the presence of HCC [50] (Fig. 11). Diffusely infiltrating and small HCCs in cirrhosis may be difficult to detect with CT. The larger HCC lesions typically have a different appearance, with a mosaic appearance due to hemorrhage and fibrosis. Also, ~10% of small HCC can appear hypodense to liver and are thought to be well-differentiated lesions.
Related posts:
 Enterography: Small Bowel Imaging That Impacts Patient Management
 to Perform and Report Magnetic Resonance Imaging for Pelvic Floor Dysfunction: An Interactive Case-Based Approach
 Should it Be Integrated into Screening and Clinical Routine Imaging?
 Vascular Disease: Diagnosis and Therapy
 and Acquired Pathologies of the Pediatric Gastrointestinal Tract
 for the Spread of Disease in the Abdomen and Pelvis
Stay updated, free articles. Join our Telegram channel

Full access? Get Clinical Tree


