Fig. 1 a, b
a Coronal steady state with free precession magnetic resonance (MR) image shows irregular liver contour and massive ascites. Of note are the fibrosiderotic nodules, also known as Gamna-Gandy bodies, causing marked susceptibility artifacts within the spleen. b Corresponding axial turbo spinecho T2-weighted MR image shows irregular liver contour and massive ascites. Note susceptibility artifacts within the spleen are less pronounced due to the pulse-sequence design (180° refocusing pulse)
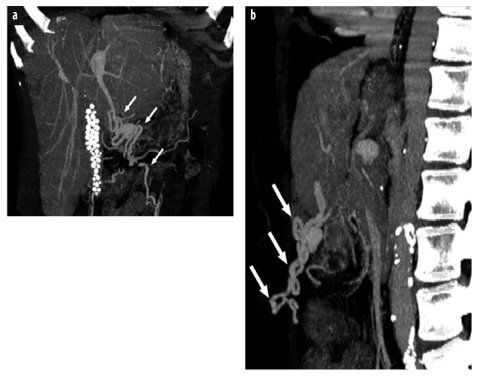
Fig. 2 a, b
a Postcontrast coronal thick-slice maximum intensity projection from a multidetector computed tomography (MDCT) data set of a 59-year-old woman with liver cirrhosis and recanalized paraumbilical veins (arrows). Note calcified gallstones. b Corresponding sagittal view
Cirrhosis markedly distorts the hepatic parenchyma, producing either a smooth, nodular, or lobular appearance of the hepatic capsule in the majority of cases. Margins that are either smooth or deformed by multiple small nodules are typical in micronodular cirrhosis. These micronodules underlying the surface of the liver are often not visualized at computed tomography (CT) or magnetic resonance imaging (MRI). At present, high-resolution transabdominal sonography with a 7.5-MHz transducer may represent the best imaging tool for visualizing these small nodules. Coarse nodularity of the margin is the result of macronodular cirrhosis. Finally, a lobular liver is usually caused by marked segmental atrophy and hypertrophy rather than by large regenerative nodules. Tremendous overlap in the frequency of smooth and nodular livers among different causes of cirrhosis usually prevents etiological distinction.
Approximately 25% of end-stage cirrhotic livers appear normal in size and shape in all cross-sectional imaging modalities; another third may be diffusely atrophic. The majority of end-stage cirrhotic livers exhibit a combination of segmental hypertrophy and atrophy, with the predominant finding being hypertrophy of liver segments 1–3. Focal atrophy is most common in segments 4–8 and may range from mild to complete involution of the affected segments. Occasionally, segments 2/3 and 5/7 may be atrophic. This is most often seen in patients with primary sclerosing cholangitis. Another rare finding in patients with primary sclerosing cholangitis is a higher attenuation in segment 1, causing a pseudotumor in the caudate lobe. Diffuse hypertrophy, however, may be seen in patients with primary biliary cirrhosis.
Approximately 25% of all patients with end-stage cirrhosis show an inhomogeneous appearance in all parts of the liver on unenhanced CT, T2-weighted magnetic resonance (MR) images, and T1-weighted images acquired during the hepatocyte phase following administration of a combined (extracellular and hepatobiliary) gadoliniumcontaining contrast agent, such as gadoxetate or gadobenate [1, 2]. On cross-sectional imaging, four different patterns of diffuse fibrosis may be seen:
Patchy, poorly defined regions of low attenuation on unenhanced CT (or hypointensity on T1-weighted and hyperintensity on T2-weighted MRI)
Thin, perilobular bands of low attenuation on unenhanced CT
Thick, fibrosis bridging of low attenuation surrounding regenerative nodules (most commonly seen in patients with primary biliary cirrhosis)
Diffuse fibrosis causing high-attenuation perivascular cuffing (most commonly seen in patients with primary biliary cirrhosis).
A commonly used scoring system to grade diffuse fibrosis is the METAVIR score, originally developed to grade fibrosis in hepatitis C patients. METAVIR scores are defined by fibrosis (F) stage:
F0 No fibrosis
F1 Portal fibrosis without septa
F2 Portal fibrosis with rare septa
F3 Numerous septa without cirrhosis
F4 Cirrhosis.
Besides diffuse fibrosis, as mentioned above, radiologists must be familiar with an entity called focal or confluent hepatic fibrosis. In patients with liver cirrhosis, focal fibrosis can be confused with HCC due to an overlap of imaging features. Focal fibrosis usually appears bright on T2-weighted MR images, dark on unenhanced T1-weighted images, and demonstrates delayed enhancement following extracellular contrast agent administration (Fig. 3). Focal confluent fibrosis may be seen in all types of cirrhosis; it occurs most commonly in primary sclerosing cholangitis, and least commonly in primary biliary cirrhosis [3]. Additional imaging features are: (1) focal retraction of the liver capsule over the area of fibrosis, (2) incomplete involvement of liver segments with accompanying atrophy, and (3) characteristic location in segments 4a, 4b, 5, and 8, with a wedge-shaped structure radiating from the porta hepatis.
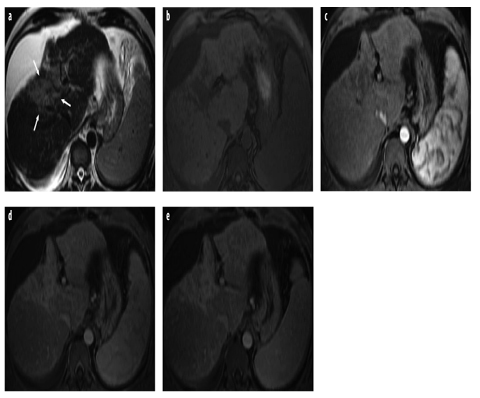
Fig. 3 a–e
a Axial turbo spin-echo T2- weighted magnetic resonance (MR) image shows cirrhotic liver with ascites. Note hyperintense area with capsular retraction, representing confluent or focal hepatic fibrosis (arrows). b–e Corresponding axial gradientecho T1-weighted images acquired before and after administration of an extracellular gadolinium-containing contrast agent: b unenhanced; c arterial phase; d portal venous phase; e delayed phase
Spectrum of Focal Lesions in Liver Cirrhosis
Another characteristic sign of liver cirrhosis is the development of a spectrum of focal lesions ranging from benign regenerative nodules to malignant HCC. In 1995, the International Working Party introduced a new nomenclature for hepatocellular nodules, replacing former pathological descriptions such as adenomatous hyperplasia, macroregenerative nodule, and other terms with the term dysplastic nodule [4]. Currently, focal liver lesions in cirrhosis are classified as:
Regenerative nodules
Low-grade dysplastic nodules
High-grade dysplastic nodules
Dysplastic nodule with a HCC subfocus
Well-differentiated HCC
Poorly differentiated HCC.
Regenerative Nodules
By definition, regenerative nodules are present in all cirrhotic livers; however, these nodules are visualized in only 25% of unenhanced CT scans and approximately 50% of MR images. These nodules may present as high-attenuation lesions on unenhanced CT due to their iron and/or glycogen content, or simply because they are surrounded by lower-attenuation fibrosis. On portal venous phase contrast-enhanced scans, these nodules are rarely revealed. On MR images, these focal lesions can appear hypo-, iso-, or hyperintense on T1-weighted images, with isointense being the most usual and hyperintense the most unusual. On T2-weighted images, they typically appear as hypointense nodules (iron causes local magnetic field inhomogeneities, with decrease of liver signal intensity due to shortening of the T2 relaxation time). Following the administration of a gadolinium-containing extracellular contrast agent (GBCA), regenerative nodules usually appear hypointense during arterial and portal venous phases and become more isointense during the equilibrium and delayed phases. Using a combined gadolinium-containing contrast agent, such as gadoxetate, regenerative nodules generally demonstrate contrast uptake and excretion during the hepatocyte phase due to preserved hepatocellular function and intact organic ion transporters; therefore, regenerative nodules demonstrate signal intensity similar to that of background liver during the hepatocyte phase.
Dysplastic Nodules
Dysplastic nodules develop from regenerative nodules and contain atypical hepatocytes but do not have definite features of malignancy on histology. They are present in 15–25% of cirrhotic livers and are histologically classified as low or high grade, depending on the degree of dedifferentiation. High-grade dysplastic nodules are considered premalignant and can undergo malignant transformation in a period as short as 4 months and are rarely detected by CT. If detected, they may appear slightly hyper- or isodense on unenhanced scans. On MR imaging, they appear iso- or hyperintense on T1-weighted images and iso- to hypointense on T2-weighted images. Following administration of an extracellular contrast agent, dysplastic nodules usually are hypodense/hypointense during the arterial, portal venous, and delayed phases. However, these lesions occasionally demonstrate hyperenhancement during the arterial phase, thus mimicking HCC. Using a combined MR contrast agent such as gadoxetate, their appearance during the hepatocyte phase varies [2, 5, 6]. As with regenerative nodules, dysplastic nodules receive their blood supply mainly from the portal vein, although high-grade nodules may develop arterial hypervascularity. With progression of atypia, the number of expressed organic ion transporters decreases, reducing their ability to take up gadolinium ethoxybenzyl diethylenetriamine pentaacetic acid (Gd- EOB-DTPA). In the hepatocyte phase of gadoxetate, nodules that retain their ability to take up the agent but not excrete it appear homogenously or heterogeneously hyperintense due to intracellular cholestasis, whereas nodules that have lost their ability to take up the agent appear hypointense. Such hypointense nodules can be mistaken for HCCs in the hepatocyte phase. On the other hand, MR imaging with hepatobiliary contrast agents is the only modality that can detect these premalignant lesions [7] and open the window for the treatment of early HCC.
Related posts:
 Enterography: Small Bowel Imaging That Impacts Patient Management
 to Perform and Report Magnetic Resonance Imaging for Pelvic Floor Dysfunction: An Interactive Case-Based Approach
 Should it Be Integrated into Screening and Clinical Routine Imaging?
 Vascular Disease: Diagnosis and Therapy
 Abdominal Disease: Diagnosis and Therapy
 Urography in Children
Stay updated, free articles. Join our Telegram channel

Full access? Get Clinical Tree


