Laboratory Evaluation of Kidney Disease


Laboratory Evaluation of Kidney Disease


Lesley A. Inker

Richard A. Lafayette

Ashish Upadhyay

Andrew S. Levey


Diseases of the kidney are often “silent” until late in the course of disease, when clinical signs and symptoms of uremia mark the onset of kidney failure. In contrast, laboratory evaluation for kidney disease reveals earlier manifestations and is an essential part of the clinical assessment of health and disease. In this chapter, we begin with a general approach to the laboratory evaluation of acute and chronic kidney disease (CKD). We then focus on glomerular filtration rate (GFR) as an index of overall kidney function, and proteinuria and other abnormalities in the urine sediment as markers of structural damage. In addition, we review all aspects of the routine urinalysis. Tubular functions, including concentration and dilution of the urine, urinary acidification, and reabsorption and secretion of electrolytes and other solutes are described in other chapters, as are production of hormones and metabolism by the kidney and novel biomarkers for specific diseases.


GENERAL APPROACH

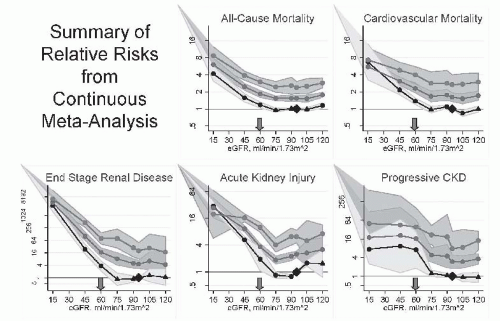
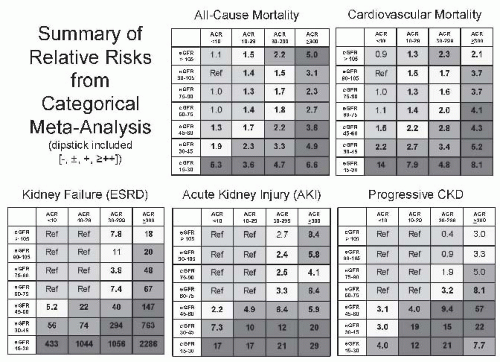
Recent guidelines define kidney diseases according to alterations in kidney structure and function and their duration (Fig. 9.1 and Table 9.1).1,2 Kidney diseases are further classified by severity of reduction in GFR and magnitude of albuminuria and by cause, reflecting the pathogenesis and pathologic abnormalities. The level of GFR is generally accepted as the best overall index of kidney function, and other kidney functions often decline in parallel to GFR in acute and chronic kidney diseases. Albuminuria generally reflects structural damage to the glomerular filtration barrier. Both measures appear to reflect kidney involvement in systemic vascular diseases as well as primary kidney diseases, and recent studies show that the severity of reduced GFR and magnitude of albuminuria are associated with a graded increase in risk for adverse outcomes across a wide variety of settings, including patients with acute and chronic kidney diseases, patients with increased risk from cardiovascular disease, and the general population (Figs. 9.2 and 9.3).3 Abnormalities in the urine sediment, such as renal tubular cells and cellular casts, signify kidney damage and may provide a clue to the cause of kidney disease, but quantification is not well studied. Abnormalities on imaging studies and pathologic abnormalities are sufficient for diagnosis of acute or chronic kidney disease. A history of kidney transplantation is sufficient for a diagnosis of chronic kidney disease.

Recent guidelines also suggest simplification of initial diagnostic testing for detection and evaluation of acute and chronic kidney diseases. Although the importance of timed urine collections is acknowledged for gold standard measures of GFR and albumin excretion rate, they are impractical for routine general clinical practice. In this chapter, we emphasize initial testing using estimation of GFR from serum levels of endogenous filtration markers, estimation of albumin excretion rate from untimed “spot” urine albuminto-creatinine ratio, and interpretation of reagent pads on the urine dipstick. Timed urine collections can be considered for more accurate assessment of GFR or albuminuria or further evaluation of abnormalities observed on the urine dipstick.


GLOMERULAR FILTRATION RATE


Glomerular Filtration: Determinants and Measurement


Normal Glomerular Filtration

The human kidney contains approximately 1 million glomeruli.4,5 This number is determined at birth but is quite variable and a lower nephron number may be associated with development of hypertension and kidney disease in later life.6,7 Each glomerulus attains an adult size of approximately 150 to 200 µm in diameter, providing a total surface area provided for filtration that approximates 1 square meter.8 Approximately 180 L per day (or 125 mL per minute) of tubular fluid are produced from the rich renal plasma flow by the process of ultrafiltration. Glomerular filtration, driven by the high hydrostatic pressure across the glomerular capillaries, is facilitated by a hydraulic permeability of the glomerular capillary wall that is one to two orders of magnitude greater than other capillaries.9


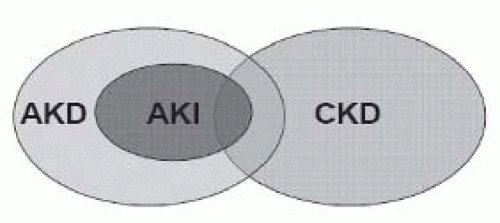
FIGURE 9.1 Conceptual model for integration of acute kidney injury (AKI), chronic kidney disease (CKD), and acute kidney diseases and disorders (AKD). Overlapping ovals show the relationships among AKI, AKD, and CKD. AKI is a subset of AKD. Both AKI and AKD without AKI can be superimposed upon CKD. Individuals without AKI, AKD, or CKD have no known kidney disease or disorder (NKD), not shown here. (Reproduced from Kidney Disease: Improving Global Outcomes (KDIGO) Acute Kidney Injury Work Group. KDIGO Clinical Practice Guideline for Acute Kidney Injury. Kidney Int Suppl. 2012;2(1):1-126.)

The glomerular filtration barrier is both size- and charge-dependent. Substances with molecular weights lower than 10,000 daltons cross the glomerular capillary wall as easily as water and electrolytes.10,11,12 Micropuncture sampling of glomerular filtrate in amphibians and mammals shows the filtrate to be identical in nonprotein composition to plasma, with electrolyte concentrations conforming to the Gibbs-Donnan relationship.11,13 As discussed later, plasma proteins are excluded from the filtrate as a consequence of the unique structure of the glomerular capillary wall.


TABLE 9.1 Definitions of Kidney Disease


Functional Criteria


Structural Criteria


Acute kidney injury (AKI)


Increase in serum creatinine by 50% within 7 days, OR


No criteria


Increase in serum creatinine by 0.3 mg/dl within 2 days, OR


Oliguria


Chronic kidney disease (CKD)


GFR <60 mL/min/1.73 m2 for ≥3 months


Kidney damage for ≥3 months, including Albumin excretion rate >30 mg/d, OR, Urine sediment abnormalities, OR, Imaging abnormalities, OR Pathologic abnormalities, OR History of kidney transplantation


Acute kidney diseases and disorders (AKD)


AKI, OR


GFR <60 mL/min/1.73 m2 <3 months, OR Decrease in GFR by >35% or increase in serum creatinine by >50% for <3 months


Kidney damage for <3 months, as defined by above


No kidney disease or disorder (NKD)


GFR >60 mL/min/1.73 m2, AND Stable serum creatinine


No kidney damage


Note: AKI and CKD have formal consensus definitions. The definition for AKD is proposed as an operational definition to classify individuals with alterations in kidney function and structure and function who do not meet the definitions for AKI and CKD. NKD indicates no functional or structural alterations that meet the definition for AKI, CKD, or AKD. Clinical judgement is required or individual decision-making regarding the extent of evaluation that is necessary to assess kidney function and structure. Glomerular filtration rate (GFR) may be assessed from estimated or measured GFR. Estimated GFR does not reflect measured GFR in AKI as accurately as in CKD. Albuminuria may be assessed from timed urine collections or “spot” urine albuminto-creatinine ratio. Novel markers of kidney damage have been proposed, but none have been validated for inclusion in the definitions of AKI or CKD. A history of kidney transplantation is considered a marker of kidney damage for CKD but not AKD.


Determinants of the Glomerular Filtration Rate

In principle, the GFR is dependent on the number of nephrons (N) and the single-nephron glomerular filtration rate (SNGFR), as described below:


In normal individuals, regulation of GFR occurs via regulation of SNGFR. In patients with kidney disease, in whom the nephron number may be reduced, regulation of SNGFR remains important in modulating GFR. SNGFR is determined by two major factors. The first factor is the net ultrafiltration pressure (PUF), determined by the difference between the net transcapillary hydraulic pressure (ΔP) favoring filtration and the net oncotic pressure (Δπ)
opposing filtration. ΔP is determined by the difference between the glomerular capillary hydraulic pressure (PGC) and that in the earliest proximal tubule (PT). Δπ is determined by the glomerular oncotic pressure alone as the ultrafiltrate is virtually protein free. The second factor, Kf, describes the surface area and permeability characteristics of the glomerular ultrafiltration barrier. This relationship can be expressed by the equation:


FIGURE 9.2 Summary of KDIGO Controversy Conference continuous meta-analysis (adjusted relative risk [RR]) for general population cohorts with albumin-to-creatinine ratio (ACR). Mortality is reported for general population cohorts assessing albuminuria as urine ACR. Kidney outcomes are reported for general population cohorts assessing albuminuria as either urine ACR or dipstick. Estimated glomerular filtration rate (eGFR) is expressed as a continuous variable. The three lines represent urine ACR of <30 mg per g or dipstick negative and trace (blue), urine ACR 30 to 299 mg per g or dipstick 1 + positive (green), and urine ACR >300 mg per g or dipstick ≥2+ positive (red). All results are adjusted for covariates and compared with reference point of eGFR of 95 mL/min/1.73m2 and ACR of <30 mg per g or dipstick negative (diamond). Each point represents the pooled RR from a meta-analysis. Solid circles indicate statistical significance compared with the reference point (P <0.05); triangles indicate nonsignificance. Red arrows indicate eGFR of 60 mL/min/1.73m2, threshold value of eGFR for the current definition of chronic kidney disease (CKD). HR, hazards ratio; OR, odds ratio. (Reproduced from Levey AS, de Jong PE, Coresh J, et al. The definition, classification and prognosis of chronic kidney disease: a KDIGO Controversies Conference report. Kidney Int. 2011;80:17-28.) (See Color Plate.)


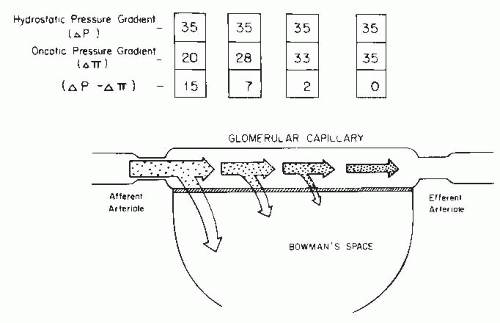
Absent from this equation is the renal plasma flow rate. Alterations in renal plasma flow affect SNGFR largely by affecting Δπ. Changes in determinants of SNGFR as plasma traverses the glomerular capillary are demonstrated in Figure 9.4. For a detailed analysis of these determinants and the multiple factors that result in the regulation of glomerular filtration, the reader is directed to Chapter 2.

In acute and chronic kidney disease, decreased GFR can be due either to a decrease in nephron number or SNGFR. Interestingly, in a number of experimental chronic kidney diseases characterized by decreased nephron number, SNGFR is elevated, perhaps reflecting compensation in processes to maintain whole kidney GFR. Moreover, in some diseases, increased SNGFR precedes the decline in nephron number, thereby raising the hypothesis that hyperfiltration in single nephrons may give rise to the development or progression of chronic kidney disease.14


Normal Range and Variability of Glomerular Filtration Rate

The GFR cannot be measured directly. Instead, as discussed later, it is assessed from the urinary clearance of an ideal filtration marker, such as inulin. When measured repeatedly in a single individual, under constant conditions and according to a standard protocol, the GFR appears relatively constant. Homer Smith measured the inulin clearance in one “hospitalized but otherwise normal subject” 15 times during 1 year; the range was 113 to 137 mL per minute with a mean of 122 mL per minute.15 However, variation among individuals is quite large, and normal values show considerable spread. As discussed later, the major causes of variability in healthy individuals are age, gender, and body size. Hence,
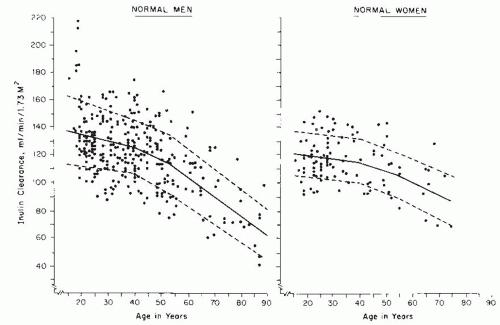
measured values of GFR are typically adjusted for body size (surface area) and are traditionally compared to normative values for age and gender (Fig. 9.5).16 Even after elimination of these sources of variation, important variability remains. A compilation of inulin clearance measurements in hydrated young adults (adjusted to a standard body surface area of 1.73 m2) shows the mean value in men to be 131 mL per minute with a coefficient of variation (CV) (defined as the standard deviation divided by the mean) of 18%, and the mean value in women to be 120 mL per minute, with a CV of 14%.15,16 The following sections discuss causes of normal variation. These same factors also contribute to variation in GFR in patients with kidney disease.


FIGURE 9.3 Summary of KDIGO Controversy Conference categorical meta-analysis (adjusted relative risk [RR]) for general population cohorts with albumin-to-creatinine ratio (ACR). Mortality is reported for general population cohorts assessing albuminuria as urine ACR. Kidney outcomes are reported for general population cohorts assessing albuminuria as either urine ACR or dipstick. Estimated glomerular filtration rate (eGFR) and albuminuria are expressed as categorical variables. All results are adjusted for covariates and compared with the reference cell (Ref). Each cell represents a pooled relative risk from a meta-analysis; bold numbers indicate statistical significance at P <.05. Incidence rates per 1,000 person-years for the reference cells are 7.0 for all-cause mortality, 4.5 for cardiovascular disease mortality, 0.04 for kidney failure, 0.98 for acute kidney injury (AKI), and 2.02 for kidney disease progression. Absolute risk can be computed by multiplying the RRs in each cell by the incidence rate in the reference cell. Colors reflect the ranking of adjusted relative risk. The point estimates for each cell were ranked from 1 to 28 (the lowest RR having rank number 1, and the highest number 28). The categories with rank numbers 1 to 8 are green, rank numbers 9 to 14 are yellow, the rank numbers 15 to 21 are orange, and the rank numbers 22 to 28 are colored red. (For the outcome of kidney disease progression, two cells with RR 1.0 are also green, leaving fewer cells as orange.) (Reproduced with permission from Levey AS, de Jong PE, Coresh J, et al. The definition, classification and prognosis of chronic kidney disease: a KDIGO Controversies Conference report. Kidney Int. 2011;80:17-28.) (See Color Plate.)


FIGURE 9.4 The changes in hydrostatic and oncotic pressures that occur as plasma traverses the glomerular capillary. As water is filtered without protein, the oncotic pressure gradually rises, thereby decreasing the net pressure favoring filtration. The pressure favoring filtration falls toward zero and filtration stops in this model before the plasma reaches the efferent arteriole. (From Deen WM, Robertson CR, Brenner BM. Glomerular ultrafiltration. Fed Proc. 1974;33:14, with permission.)


FIGURE 9.5 Normal values for glomerular filtration rate, adjusted for body surface area, in men and women of various ages. (From Wesson LG, ed. Physiology of the Human Kidney. New York: Grune & Stratton; 1969, with permission.)

Age, Sex, Body Size, and Ethnicity. The surface area adjustment was first introduced to minimize variability in urea clearance results among normal adults and children.17,18,19 Based on the relationship of GFR to glomerular surface area, it is not surprising that the level of GFR is related to kidney size, which in turn, is related to body surface area and metabolic activity.20 Measured values for GFR are conventionally factored by 1.73 m2, the mean surface area of men and women 25 years of age. Nonetheless, as described earlier, surface-area adjusted values for GFR are approximately 8% higher in young men than in women of the same age.

Glomerular tuft volume, renal size, and GFR increase during growth and development. The surface area adjustment is not appropriate for newborns, whose adjusted GFR is less than 50% of the value achieved at approximately 1 year of age.21,22 More recent studies strongly suggest that in newborns, GFR should be expressed in mL/min/kg, with the normal value being 0.6 to 1.6 mL/min/kg. Such an approach reduces the apparent variation in measured GFR more than 10-fold.23 Beyond age 1 to 2 years, however, GFR values in normal children, adjusted to 1.73 m2, are the same as those for young adults.

The appropriateness of the surface area correction in obesity remains controversial.24 Because adipose tissue is less metabolically active than lean body mass, the physiologic matching of GFR to body surface area may not be the same in obese as in lean individuals. There are few data to relate measured GFR to body size, metabolic activity, and risks for development of kidney disease in obesity, leaving many important questions unanswered.25 Are estimates of body surface area from height and weight as accurate in obese as in lean individuals? Does GFR increase with weight gain in proportion to body surface area? If so, is the resulting hyperfiltration associated with increased risk for development of kidney disease, as hypothesized in other conditions with hyperfiltration, such as diabetes? If so, indexing GFR to body surface area in obesity may obscure detection of an important marker of disease. Cross-sectional and longitudinal studies of measured GFR in obesity, in association with measures of body size and metabolic activity, and markers of kidney damage are necessary to answer these questions.24

Most studies of measured GFR in populations without kidney disease have been conducted in North America or
Europe, so data on nonwhite races and other ethnicities is limited. Reports on small to moderate numbers of subjects have suggested a lower average value,26,27 but these studies are somewhat limited by differences in GFR measurement methods and by incomplete ascertainment of protein intake (see below). A more recent report from a representative population in Pakistan suggests mean values of GFR in young adults only slightly below those in whites, with similar agerelated decline.28

In older studies, both cross-sectional and longitudinal studies in normal men demonstrate an age-related decline in GFR of approximately 10 mL/min/1.73 m2 per decade after the age of 30 years.16,29,30,31 Recent studies in the general population have not been performed, but studies in kidney donors demonstrated a 4 mL/min/1.73m2 lower measured GFR per decade up to the age of 45 years and a 7.5 mL/min/1.73m2 lower measured GFR per decade thereafter.32 Thus, using the data from the general population, during the 50 years from age 30 to 80, GFR declines by almost 40% from approximately 130 to 80 mL/min/1.73 m2. Crosssectional studies in normal women indicate roughly similar results, but comparable longitudinal studies have not been performed and there may be subtle differences related to effects of hormones, pregnancy, and propensity toward illnesses that impact the kidney. This age-related decline in GFR is consistent with the anatomic observation that the number of glomeruli in the normal human kidney declines with age; in the sixth and seventh decades, the number of glomeruli is less than one-half the number present in young adults.4,33 The cause of age-related decline in GFR is not completely understood, but progressive glomerular sclerosis, independent of traditional kidney disease risk factors, likely contributes to the loss of glomeruli.34,35 Recent epidemiologic studies demonstrate that this decline in GFR is associated with increased risk for all-cause and cardiovascular disease mortality as well as kidney disease, casting doubt on the traditional interpretation that it is normal.36

Pregnancy. Marked increases in GFR occur during pregnancy; elevations to an average as much as 50% occur during the first trimester, and these high levels persist until shortly after term.37,38,39,40 These increments in GFR are associated with an increase in renal plasma flow and relatively constant filtration fraction throughout most of pregnancy, reflecting hemodynamic consequences of widespread vasodilatation. Late in pregnancy, it appears that hyperfiltration becomes dependent on reduced plasma oncotic pressure. This change persists in the very early postpartum period, but the GFR returns to normal in the first 4 to 8 weeks following the end of pregnancy.40,41

Interestingly, pregnancy-induced hyperfiltration also occurs in women with preexisting chronic kidney disease.42 This observation suggests that the physiologic vasodilatation of pregnancy can further augment the single-nephron hyperperfusion and hyperfiltration associated with chronic kidney disease. However, this phenomenon may be restricted to women with only very mild reductions in GFR. Improvement of GFR was not observed in one study of 23 women with chronic kidney disease and pre-pregnancy serum creatinine levels greater than 1.4 mg/dL.43

Protein Intake. The effect of protein intake to modulate GFR in experimental animals was recognized 70 to 80 years ago.44,45 It is now clear that these effects occur in humans, although the magnitude of the effect varies widely among studies.46 Important causes of variation include the duration of protein feeding (habitual protein intake vs. meat meals or amino acid infusions), the type of protein (animal vs. vegetable or soya protein sources; essential vs. nonessential amino acids), and the filtration marker used to measure GFR (inulin vs. creatinine).

In a classic study, Pullman et al.47 placed healthy humans on low (0.1 to 0.4 g/kg/day), medium (1.0 to 1.4 g/kg/day), and high (2.6 g/kg/day) protein diets for 2 weeks. Compared to the low protein diet, inulin clearance increased after ingestion of the medium and high protein diets by 9% and 22%, respectively. These changes were accompanied by parallel changes in renal plasma flow, indicating a hemodynamic basis for the changes in GFR. A longer period of habituation may have greater effects on GFR. Similarly, in patients with chronic malnutrition, inulin clearance was 27% to 64% lower than after repletion of nutritional status,48,49,50,51 and returned to near normal values only after 1 month of refeeding. In addition, malnourished patients had smaller kidneys, suggesting that differences in kidney function were due to structural as well as hemodynamic alterations.48 Increases in GFR and kidney size in association with increased protein intake have been noted in diverse clinical circumstances, such as in patients receiving total parenteral nutrition and in insulin-dependent diabetic patients with poor metabolic control.52 Some studies suggest a greater response to animal than vegetable protein in habitual diets as well as in response to protein loads.53,54,55 A recent study assessing the impact of sustained high protein feeding demonstrated an increase in GFR in young subjects (24 ± 1 years old), but actually a small decrease in GFR in older subjects (70 ± 2 years old).56

After a meat meal, GFR, renal plasma flow, and splanchnic blood flow rise within an hour and remain elevated for several hours.57 In humans, the increment in inulin clearance is about 10%,58,59 and appears to be less than the increment in creatinine clearance.46 Nonessential amino acids are more potent than essential amino acids in inducing the postprandial rise in GFR, and branched-chain amino acids appear to have little or no effect.

It had been proposed that protein-induced hyperfiltration represents “renal reserve capacity,” which is lost prior to the reduction in baseline GFR associated with kidney disease.60 However, it has now been shown conclusively that changes in GFR occur in response to changes in habitual protein intake or meat meals in patients with kidney disease and reduced GFR.59,60,61,62,63 This is consistent
with studies in animals with experimental kidney diseases, which show that changes in protein intake further modulate the determinants of single-nephron GFR. In particular, a high protein diet raises the already increased glomerular plasma flow and transcapillary hydrostatic pressure gradient.64,65 Thus, protein-induced hyperfiltration augments the hyperperfusion and hyperfiltration of chronic kidney disease.

Diurnal Variation. A normal diurnal variation in filtration rate occurs, with 10% higher values occurring in the afternoon than in the middle of the night.66 In large part, the diurnal variation is thought to be related to variation in protein intake during the day.16,60 Possibly, diurnal variation may also be related to transient reductions in GFR associated with exercise. Indeed, a decrease of 40% or more is seen with severe exertion.16,67,68 However, diurnal variation is also observed in quadriplegics,69 arguing against physical activity as the sole cause of diurnal variation. Possibly, diurnal variation may also reflect variation in hydration. GFR increases with overhydration and decreases with water restriction. However, the changes are small except when gross disturbances in fluid balance occur.

Antihypertensive Therapy. As a result of powerful mechanisms for autoregulation of renal hemodynamics (Chapter 3), the level of GFR remains relatively constant throughout a wide range of blood pressure. Nonetheless, antihypertensive therapy can be associated with reductions in GFR, due, in part, to the effect of lowering blood pressure and, in part, to specific effects of classes of antihypertensive agents. Indeed, marked reduction in GFR can complicate treatment in patients with severe hypertension and acute or chronic kidney disease,70 which is an effect thought to be due to the loss or reset of autoregulation due to sclerosis of the renal vasculature from hypertensive injury.71 In normal individuals and in patients with kidney disease, GFR is transiently reduced by a variety of antihypertensive agents, including diuretics, beta-blockers, central alpha-2 agonists, and peripheral alpha blockers.72 In contrast, angiotensin-converting enzyme (ACE) inhibitors, angiotensin receptor blockers (ARBs), calcium channel blockers, and directly acting vasodilators do not regularly lower GFR in healthy subjects. A large study in patients with chronic kidney disease and well-controlled hypertension showed persistent small (less than 5 mL per minute), but significant, reductions in GFR associated with the use of ACE inhibitors as well as diuretics and beta-blockers.73 In addition, after controlling for the effect of these classes of antihypertensive agents, a small effect of lowering blood pressure remained. Because the effects of the various classes of medications and of lowering blood pressure appear to be independent, a clinically significant reduction in GFR could occur in patients with chronic kidney disease undergoing treatment with multiple antihypertensive agents.


Measurement of the Glomerular Filtration Rate

Clearance. As mentioned earlier, the GFR is assessed from the clearance of filtration markers, substances excreted by glomerular filtration that can be used to assess the GFR. The “gold standard” for the measurement of GFR is the urinary clearance of inulin. The term clearance was introduced into kidney physiology by Van Slyke and his colleagues in reference to studies of the excretion of urea in 1929.18 Two years later, Jollife and Smith extended the use of the term to the excretion of creatinine and later to the excretion of many other substances.74 In the many decades since these pioneering studies, the concept of clearance has maintained its primacy as the cornerstone of our understanding of the measurement of glomerular filtration.

The clearance of a substance is defined as the rate at which it is cleared from the plasma per unit concentration. The clearance of substance “x” (Cx) is given in the following equation:


where Ax is the amount of x eliminated from the plasma and Px is the average plasma concentration. Hence, Cx is expressed in units of volume per time. The value for clearance does not represent an actual volume, but a virtual volume of plasma that is completely cleared of the substance per unit of time, without reference to the route of elimination. The value for clearance is related to the efficiency of elimination: the greater the rate of elimination, the higher the clearance.

Relationship of Glomerular Filtration Rate to Urinary Clearance. For a substance that is cleared by urinary excretion, the clearance formula may be rewritten as follows:


where Ux is the urinary concentration of x and V is the urine flow rate. The term Ux × V is defined as the urinary excretion rate of x. If substance x is filtered freely across the glomerular capillary walls and excreted only by glomerular filtration, then the rate of filtration is equal to the rate of urinary excretion:


where the term GFR × Px is defined as the filtered load of x. By substitution into Equation 9.2:


Hence, substance x would be defined as an “ideal filtration marker” whose urinary clearance could be used to measure GFR.


However, if substance x is also reabsorbed or secreted by the renal tubules, then the following equations apply:


where TRx and TSx are the rates of tubular reabsorption and secretion of x, respectively, and TRx /Px and TSx /Px are the clearances of substance x due to reabsorption (CTRx) and secretion (CTSx), respectively. In this case, the rate of urinary excretion (Ux × V) does not equal the filtered load (GFR × Px), and clearance does not equal GFR. Therefore, the value for urinary clearance of x (Cx) is determined not only by the rate of glomerular filtration, but also by the mechanism of excretion by the kidney. For substances that are filtered and secreted, clearance exceeds GFR, and for substances that are filtered and reabsorbed, clearance is less than GFR.

Inulin Clearance. The requirements for an ideal filtration marker, as outlined by Smith,15 include the following:

1. It is freely filtered at the glomerulus. It passes from the glomerular capillary blood into Bowman’s space unhindered by its size, charge, or binding to plasma proteins.

2. It is not altered during its passage through the nephron. It is not reabsorbed, secreted, synthesized, or metabolized by the tubules.

3. It is physiologically inert and does not alter the function of the kidney.

Inulin, a 5,200-dalton, inert, uncharged polymer of fructose, meets these criteria, and it remains the standard for experimental and clinical measurement of GFR.15,75,76 The conclusion that inulin is freely filtered and is neither secreted nor reabsorbed in the normal kidney was originally based on indirect evidence, but a large body of direct micropuncture observations have verified this assumption.11,77,78,79,80 Similar evidence is not available, however, in all experimental kidney diseases. For example, in several models of acute kidney failure with extensive tubular basement membrane damage, leakage of inulin across the tubules is readily demonstrated.81,82 In such situations, of course, the urinary excretion of inulin is less than the filtered load, and inulin clearance is less than GFR.

Although the measurement of inulin clearance is a highly accurate and reproducible means of estimating GFR, there are several disadvantages that make it impractical for clinical use. First, the classical method includes measurement under fasting conditions in the morning, a continuous intravenous infusion, multiple clearance periods requiring repetitive blood and urine collections over 3 hours, oral water loading to stimulate diuresis, bladder catheterization to assure complete urine collection, and careful timing of blood sampling at the midpoint of the urine collection. Period-to-period variability in GFR (intratest variation; expressed as CV) is approximately 10%. Intratest variation may reflect incomplete bladder emptying and is often used to judge the quality of a urinary clearance study.15 However, one recent study has shown that the precision of GFR determinations is only weakly affected by intratest variability,83 probably because averaging over several clearance periods minimizes error due to incomplete bladder emptying. In a study in normal individuals using the classical method of inulin clearance, the CV for repeated measurements within an individual (intertest CV) was 7.5%.84 These estimates of measurement error are probably lower than would be observed in most clinical settings. Second, inulin is difficult to dissolve in aqueous solutions, difficult to measure, and is in short supply. Because of these disadvantages, clinical assessment of GFR generally utilizes other filtration markers and clearance methods.

Urinary Clearance of Endogenous Filtration Markers. In principle, the simplest alternative to inulin clearance would be the urinary clearance of an endogenous filtration marker. The advantage of this method is that clearance can be computed from urine collections and blood sampling under usual clinical conditions without the need for administration of an exogenous marker. Indeed, this method is widely used for measuring creatinine clearance, as discussed later. The most common method is to collect a 24-hour urine collection and a single serum measurement, assuming a steady state. The urine collection is performed at home. At the onset of the collection period, the patient is instructed to empty the bladder and discard the urine. During the collection period, all subsequent urine is saved. At the end of the period, the patient is asked to void completely and to add this last specimen to the urine collection. Shortly thereafter, the blood sample is obtained.

Unfortunately, the accuracy of this method is limited because neither creatinine nor any other known endogenous filtration marker meets all the criteria for an ideal filtration marker and because timed urine collections under usual clinical conditions are notoriously inaccurate. Errors in timing or completeness can result from misunderstanding by the patient or personnel of the instructions, such as omitting urine specimens during the interval or incompletely emptying the bladder at the start or end of the collection period. At first glance, it might appear that the use of short urine collection intervals, such as 1-hour, carried out under close supervision by trained personnel might overcome these difficulties. However, using a shorter collection period, the small errors due to incomplete bladder emptying would have a greater impact on the estimate of the urine volume and hence the urine flow rate. Indeed, the 1-hour technique has been largely abandoned because the extra effort and personnel required do not significantly improve the accuracy as compared to the 24-hour
clearance.85 However, averaging the results of three to four 30-minute collection periods does significantly improve the accuracy, probably due to cancellation of errors from incomplete bladder emptying.86

A similar method can be used to compute clearance for patients who are not in a steady state balance by obtaining additional blood samples during the urine collection to estimate the average serum concentration. The most common strategies are to collect blood at the mid-point of the urine collection, or at the beginning and end of the urine collection, and to average the serum concentrations.

Alternative Clearance Methods and Exogenous Filtration Markers. All alternative clearance methods have been designed to facilitate GFR measurement; however, all have limitations that should be understood for proper interpretation. Table 9.2 summarizes the strengths and limitations of these alternative clearance methods and markers, as well as the gold standard method.75,87,88,89

Changes to the clearance method include substitution of bolus intravenous or subcutaneous injection for a constant intravenous infusion and use of plasma clearance techniques to eliminate the need for urine collection. With a bolus injection, the pattern of decline in serum levels is more accurately modeled as an exponential rather than linear of decline.83 In the bolus subcutaneous technique, the marker substance (e.g., 125I-iothalamate, 51Cr-EDTA) can be given with a small dose of aqueous epinephrine to slow its release into the circulation, providing fairly constant plasma levels.90,91 More recently subcutaneous continuous infusions have been used.92

Plasma clearance is computed from Equation 9.3 using either the entire area or a one-compartment or twocompartment model of the plasma disappearance plot.93,94,95 There are several caveats. First, a relatively long time (3 to 5 hours) is required to accurately determine the declining plasma concentration of the marker, with longer times for people with reduced GFR. Second, filtration markers utilized for this method must meet an additional criterion of rapid equilibration with the extracellular volume, and inulin is therefore not appropriate for use.96 Third, for some markers, simultaneous assessment of plasma and urinary clearance of a filtration marker typically yields a higher level for plasma clearance, presumably due to extrarenal excretion of the marker.97,98 This underestimation is more apparent at a lower GFR. Fourth, plasma clearance overestimates GFR in patients with moderate to severe edema probably because of the larger than expected volume of distribution and lower than expected plasma levels of the marker.99

Alternative exogenous markers include radioisotopelinked markers 125I-iothalamate, 51Cr-ethylene diamine tetraacetic acid (EDTA), and its analogue, 99mTc-diethylene triamine pentaacetic acid (DTPA), that can be readily and inexpensively measured using radioactive counters; and nonradioactive markers iohexol and iothalamate that can be measured by X-ray fluorescence and high performance liquid chromatography (HPLC) methods. The advantage of the latter two is the avoidance of radiation exposure; however, the assay methods are more expensive and generally performed in specialized laboratories. All other filtration markers deviate from ideal behavior. Overall, there is suggestion by some but not all studies that iothalamate clearance results in a higher GFR than inulin clearance, presumably due to secretion of iothalamate by the tubules. Other studies suggest that iohexol clearance may underestimate inulin clearance. DTPA readily dissociates from its radioactive tracer, allowing binding of the tracer to plasma proteins leading to retention of the tracer and underestimation of GFR.

GFR can also by measured by counting of a radioactive exogenous filtration marker over the kidneys and bladder. This technique can be combined with renal imaging, usually using 99mTc-DTPA, and is useful for determination of split kidney function.88,100 Several studies indicate poor correlation of 99mTc-DTPA dynamic renal imaging with simultaneous urinary or plasma clearance, reflecting both bias and imprecision, and lesser accuracy than estimated GFR.101,102,103 Currently, magnetic resonance imaging (MRI) is being investigated for measurement of GFR. Many protocols are in use which will require consolidation before introduction into clinical practice.104,105

Because of these limitations, all values for measured GFR contain an element of error, which differentiates them from true GFR. As such there is variability in the literature as to how each of these markers and methods compare to the gold standard method.
Estimation of the Glomerular Filtration Rate


Relationship of Glomerular Filtration Rate to the Plasma Solute Concentration

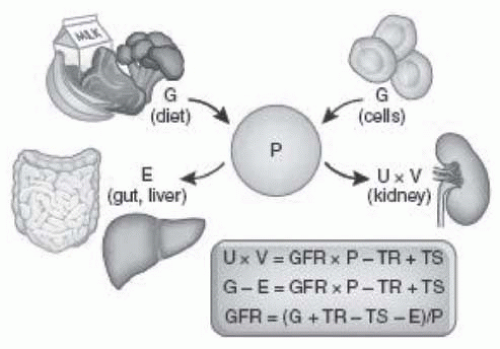
The plasma level of a solute (Px) is determined by its generation (Gx) from cells and diet, extrarenal elimination (Ex) by gut and liver, and urinary excretion (Ux × V) by the kidney (Fig. 9.6).106 Physiologic processes other than GFR that affect the plasma level of a solute (Px) are termed “non-GFR determinants.” The following discussion relates concepts of plasma levels of filtration markers, their non-GFR determinants, and the physiologic basis for GFR estimating equations.

An important concept for this discussion is the steady state of solute balance. A steady state with regard to substance x is achieved when the rate of generation in body fluids (either from endogenous production or exogenous intake) is constant and equal to its rate of elimination from body fluids (either from excretion or metabolism). Therefore, in the steady state, the plasma concentration of substance x is constant:


where Gx and Ex are the rates of generation and extra-renal elimination of x. If the substance is excreted only in the
urine, in the steady state, the rate of generation can be assessed from the urinary excretion rate.


TABLE 9.2 Strengths and Limitations of Glomerular Filtration Rate Measurement Methods and Markers


Approach


Strengths


Limitations


Methods


Urinary Clearance


Bladder catheter and continuous intravenous infusion of marker


▪ Gold standard method


▪ Invasive


Spontaneous bladder emptying


▪ Patient comfort


▪ Less invasive


▪ Possibility of incomplete bladder emptying


▪ Low flow rates in people with low levels of GFR


Bolus administration of marker


▪ Shorter duration


▪ Rapidly declining plasma levels at high levels of GFR


▪ Longer equilibration time in extracellular volume expansion


24-hour urinary collection


▪ Cumbersome


▪ Prone to error


Plasma clearance


▪ No urine collection required


▪ Potential for increased precision


▪ Overestimation of GFR in extracellular volume expansion


▪ Inaccurate values with one-sample technique, particularly at lower GFR levels


▪ Longer duration of plasma sampling required for low GFR


Nuclear imaging


▪ No urine collection or repeated blood samples required


▪ Relatively short duration


▪ Less accurate


Markers*


Inulin


▪ Gold standard


▪ No side effects


▪ Expensive


▪ Difficult to dissolve and maintain into solution


▪ Short supply


Creatinine


▪ Endogenous marker, no need for administration


▪ Assay available in all clinical laboratories


▪ Secretion which can vary among and within individuals


Iothalamate


▪ Inexpensive


▪ Long half-life


▪ Probable tubular secretion


▪ Requirement for storage, administration, and disposal of radioactive substances when iothalamate-125 used as tracer


▪ Use of nonradioactive iothalamate requires expensive assay


▪ Cannot be used in patients with allergies to iodine


Iohexol


▪ Not radioactive


▪ Inexpensive


▪ Sensitive assay allows for low dose


▪ Possible tubular reabsorption or protein binding


▪ Use of low doses requires expensive assay


▪ Cannot be used in patients with allergies to iodine


▪ Nephrotoxicity and risk for allergic reactions at high doses


EDTA


▪ Widely available in Europe


▪ Probable tubular reabsorption


▪ Requirement for storage, administration, and disposal of radioactive substances when 51Cr is used as tracer


DTPA


▪ Widely available in the United States


▪ New sensitive and easy to use assay for gadolinium


▪ Requirement for storage, administration, and disposal of radioactive substances when 99mTc used as tracer


▪ Requires standardization for 99mTc


▪ Dissociation and protein binding of 99mTc


▪ Concern for NSF when gadolinium is used as the tracer


51Cr, chromium-51; 99mTc, technetium-99m; DTPA, diethylene triamine pentaacetic acid; EDTA, Ethylenediaminetetraacetic acid; GFR, glomerular filtration rate; NSF, nephrogenic systemic fibrosis.


FIGURE 9.6 Determinants of the serum level of endogenous filtration markers. The plasma level (P) of an endogenous filtration marker is determined by its generation (G) from cells and diet, extrarenal elimination (E) by gut and liver, and urinary excretion (UV) by the kidney. Urinary excretion is the sum of filtered load (GFR × P), tubular secretion (TS), and reabsorption (TR). In the steady state, urinary excretion equals generation and extrarenal elimination. By substitution and rearrangement, GFR can be expressed as the ratio of the non-GFR determinants (G, TS, TR, and E) to the plasma level. (Reproduced from Stevens LA, Levey AS. Measured GFR as a confirmatory test for estimated GFR. J Am Soc Nephrol. 2009;20(11):2305-2313.)


By rearrangement of Equations 9.7 and 9.10 and solving for Px, we obtain the following:


Hence, Px is inversely related to GFR, and directly related to its non-GFR determinants.


For a substance that is eliminated entirely by glomerular filtration, this relationship simplifies to the following.


If the rate of generation is constant across individuals and over time, the level of GFR can be estimated by the plasma level and proportionality constant.


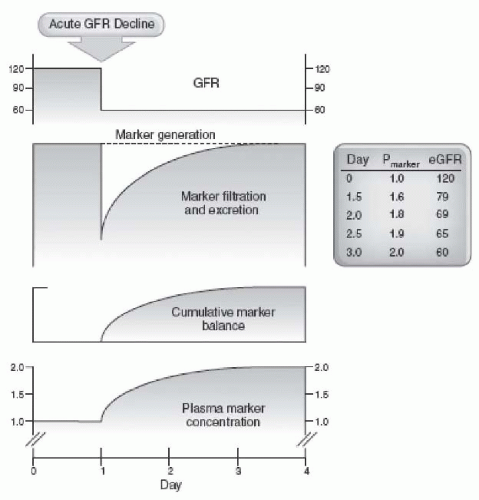
Figure 9.7 shows the hypothetical change in levels of a filtration marker GFR after an acute change in GFR.106,107 After an acute GFR decline, generation of the marker is unchanged, but filtration and excretion are reduced, resulting in retention of the marker (a rising positive balance) and a rising plasma level (non-steady state). Although GFR remains reduced, the rise in plasma level leads to an increase
in filtered load (GFR × Px) until it equals generation (Gx). At that time, cumulative balance and the plasma level plateau at a new steady state. In this example, a halving of GFR is associated with a doubling of the plasma concentration of the marker.


FIGURE 9.7 Effect of an acute glomerular filtration rate (GFR) decline on generation, filtration, excretion, balance, and serum level of endogenous filtration markers. GFR is expressed in units of milliliter per minute per 1.73 m2. Tubular secretion and reabsorption and extrarenal elimination are assumed to be zero. (Reproduced with permission from Stevens LA, Levey AS. Measured GFR as a confirmatory test for estimated GFR. J Am Soc Nephrol. 2009;20(11):2305-2313. Modified from Kassirer JP. Clinical evaluation of kidney function—glomerular function. N Engl J Med. 1971;285:385-389.)


Physiologic Basis of Glomerular Filtration Rate Estimating Equations

This section discusses general principles of GFR estimating equations. Specific estimating equations for GFR are discussed in more detail later in the chapter. Estimating GFR from the plasma level of endogenous filtration markers has the advantages of eliminating the need for infusion of an exogenous filtration marker and urine collections. Unfortunately, the plasma levels of all endogenous filtration markers are influenced by physiologic processes other than GFR, these processes are generally not measured in clinical practice, and clinical conditions affecting these physiologic processes are not known for all filtration markers.

Estimating equations for GFR are regression equations that estimate measured GFR from plasma levels of endogenous filtration markers and demographic and clinical variables as observed surrogates for the unmeasured physiologic processes (non-GFR determinants).108 By definition, an estimating equation provides a more accurate estimate of measured GFR than the plasma concentration alone. For example, the equation below shows the hypothetical relationship of numerical values for demographic and clinical variables X, Y, and Z to generation of the filtration marker (Gx).


Therefore, by substitution into Equation 9.14


where eGFR is estimated GFR and a, b, c, and d are regression coefficients relating Px and other variables to measured GFR, and ε is the error based on uncertainty due to measurement, biologic variability, and statistical techniques used to derive the coefficients. Estimating equations for GFR are often expressed on the logarithmic scale and, therefore, have the appearance of


where a is a negative coefficient to account for the inverse relationship between GFR and the plasma level of the filtration marker.

GFR estimating equations are derived in the steady state; hence, GFR estimates are more accurate in the steady state than in the non-steady state. In the non-steady state (Fig. 9.7), the rate and direction of change in the level of the
filtration marker and eGFR are affected by the magnitude of change in GFR, but also by the non-GFR determinants and the volume of distribution of the filtration marker.109 Hence, the plasma level of the filtration marker reflects the magnitude and direction of the change in GFR but does not accurately reflect the level of GFR. After a fall in GFR, the decline in eGFR is less than the decline in GFR, and eGFR thus exceeds GFR. Conversely, after a rise in GFR, the rise in eGFR is less than the rise in GFR, and eGFR is thus less than GFR. As the plasma level approaches the new steady state, eGFR approaches GFR and the level of the filtration marker varies inversely with GFR.


Development and Validation of Glomerular Filtration Rate Estimating Equations

Development and validation of GFR estimating equations should be undertaken with appropriate attention to epidemiologic and statistical techniques. In general, a large sample size (n > 500 subjects) with a wide range of GFR is required for developing a GFR estimating equation. It is important to include both men and women across a wide age range and from a variety of racial and ethnic groups for international use. Validation should be undertaken in a separate population, selected according to similar criteria and with similar clinical and demographic characteristics to the development population. GFR should be measured in both populations using either inulin or an exogenous filtration marker and clearance method validated against inulin clearance. Plasma or serum concentrations of the endogenous filtration markers should be measured using assays calibrated to reference standard. The development process should proceed according to a protocol for introduction and selection of important covariates that are hypothesized to reflect non-GFR determinants of the filtration markers. The validation process should systematically evaluate bias, precision, and accuracy in the overall validation population and in clinically relevant subgroups (Table 9.3).110 Bias reflects a systematic difference in performance, generally due to differences between the development and validation population in measurement methods for GFR, assays for filtration markers, or selection of study subjects. Imprecision reflects random error, and is generally greater at higher GFR values, due to greater GFR measurement error and greater variation in non-GFR determinants, than at lower GFR. In principle, the use of multiple filtration markers can improve precision by cancelling errors due to variation in non-GFR determinants.


TABLE 9.3 Metrics for Evaluation of Glomerular Filtration Rate Estimating Equations


Criteria


Metric


Definition


Bias


Median difference


mGFR — eGFR


Median percent difference


(mGFR — eGFR)/mGFR* 100


Precision


IQR difference


Interquartile range of (mGFR — eGFR)


IQR % difference


Interquartile range of [(mGFR — eGFR)/m GFR ] * 100


Accuracy


Median absolute difference


Median of the absolute value of eGFR — mGFR


P30


Percent of estimates within 30% of measured GFR


RMSE


Square root of mean (log mGFR — log eGFR)2


* Measures of accuracy assess precision when bias is 0 (development datasets).
IQR, interquartile range; eGFR, estimated glomerular filtration rate; mGFR, measured glomerular filtration rate; RMSE, root-mean-square deviation. From Stevens LA, Zhang Y, Schmid CH. Evaluating the performance of equations for estimating glomerular filtration rate. J Nephrol. 2008;21(6):797-807.


Creatinine as a Filtration Marker

Creatinine is the most frequently measured endogenous filtration marker in routine clinical practice. It has been estimated that serum creatinine is measured more than 280 million times per year in the United States.111 The classical assay was first introduced more than 125 years ago by Jaffé.112 The normal level of GFR is sufficient to maintain a low concentration of creatinine in serum, approximately 0.7 to 0.9 mg per dl in healthy young people. Reference ranges cited by clinical laboratories vary because of variation in serum creatinine assays. More importantly, reference ranges are difficult to interpret because of variation among individuals in non-GFR determinants (Table 9.4)113; serum creatinine may not rise above the upper limit of the reference range unless GFR is less than 60 mL/min/1.73 m2. Recent interest in more accurate GFR estimation has led to worldwide standardization of serum creatinine assays and reporting of estimated GFR when serum creatinine is measured.114 Using eGFR overcomes some of these limitations, but imprecision remains, especially at higher GFR.


TABLE 9.4 Clinical Conditions that Cause Errors in the Estimation of GFR from Measurement of Creatinine Clearance or Serum Creatinine


Effect on


Condition


Ccr


Pcr


Comment


Plasma Ketosis


None


Increase


Interference with the picric acid assay for creatinine


Medications


Certain cephalosporins or flucytosine


None


Increase


Interference with the picric acid and iminohydrolase assays for creatinine, respectively


Cimetidine or trimethoprim


Decrease


Increase


Inhibition of tubular secretion of creatinine


Dietary Protein


Ingesting cooked meat


Increase


Increase


Transient increase in GFR and creatinine generation


Restriction of dietary protein


Decrease


Decrease


Sustained decrease in GFR and creatinine generation


Muscle Change


Vigorous prolonged exercise


Decrease


Increase


Transient decrease in GFR and increase in muscle creatinine generation


Muscle wasting


None


Decrease


Decrease in muscle creatinine generation


Muscle growth


None


Decrease


Increase in muscle creatinine generation


Kidney Diseasea


Increase


Decrease


Decrease in GFR, but stimulation of tubular secretion of creatinine, and possible decrease in creatinine generation


a Effects on Ccr and Pcr relative to effects on GFR (i.e., Ccr is higher than expected and Pcr is lower than expected for the reduction in GFR; see text). Ccr, creatinine clearance; Pcr, serum creatinine; GFR, glomerular filtration rate.
From Levey AS. Clinical evaluation of renal function. In: Greenberg A, ed. Primer of Kidney Diseases. San Diego: Academic Press; 1998:23.


Kidney Handling of Creatinine

Creatinine is small (molecular weight 113 daltons, molecular radius 0.3 nm) and not bound to plasma proteins; hence, it passes freely through the glomerular capillary wall into the Bowman’s space. However, it is also secreted by the tubules, probably by the same pathway used for other organic cations.115 Therefore, creatinine is excreted not only by glomerular filtration, but also by tubular secretion.


where Scr is serum creatinine concentration (virtually identical to plasma concentration) and TScr is the rate of tubular secretion. Consequently, it is not an ideal filtration marker. The true relationship between creatinine clearance and GFR is as follows


where TScr/Pcr is the clearance of creatinine due to tubular secretion (CTScr). Thus, at all levels of GFR, creatinine clearance exceeds GFR by an amount equal to the clearance of creatinine due to tubular secretion.

Tubular Secretion of Creatinine. Creatinine secretion was recognized long ago,116 and has been reemphasized in the modern era.117 It was not initially recognized as a limitation to the estimation of GFR from creatinine clearance; the major reason was related to the method of measurement of serum creatinine used in the past. As discussed later, the classical method, the Jaffé reaction, used a colorimetric reaction that detects both creatinine and a number of noncreatinine chromogens in serum, but not in urine. Thus, the serum “chromogen creatinine” exceeded the true serum creatinine measured by more accurate methods, and using the “chromogen creatinine” to calculate creatinine clearance led to a systematic underestimation of the true value. On the other hand, because of tubular secretion, the true creatinine clearance exceeded GFR. The net result was that estimated creatinine clearance deviated little from GFR in normal individuals. With the introduction of more accurate methods to measure serum creatinine, the discrepancy between creatinine clearance and GFR became more apparent.


Using older assays, the level of serum creatinine in the low range is overestimated, and average creatinine secretion in normal individuals accounted for 5% to 10% of the excreted creatinine. Hence, creatinine clearance exceeded GFR by approximately 10 mL/min/1.73 m2. However, with the newer assays, normal serum levels are lower, so creatinine secretion can exceed GFR by much larger amounts. The magnitude of this overestimation has not been well quantified. Most studies find proportionately greater creatinine secretion in patients with reduced GFR, which leads to a clear disparity between creatinine clearance and GFR.118 Moreover, the magnitude of creatinine secretion is variable among individuals and over time. Only some of the factors responsible for this variability are known. The level of GFR appears to be a major determinant.117 The mean difference between Ccr and GFR (the clearance due to tubular secretion) within the range of GFR from 40 to 80 mL/min/1.73 m2 is approximately 35 mL/min/1.73 m2 and lower at lower GFR.

Other factors determining the magnitude of creatinine secretion are the type of kidney disease and the quantity of dietary protein intake. Patients with polycystic kidney disease and tubulointerstitial diseases have lower mean values for creatinine clearance due to secretion than patients with glomerular diseases and other diseases,61 perhaps reflecting more serious tubular injury and limitation of tubular secretion. On the other hand, higher protein intake is associated with higher mean values for creatinine clearance due to secretion,61 perhaps due to stimulation of secretion due to protein ingestion. This finding may account for the greater effect of protein loads on creatinine clearance compared to GFR.46

Several commonly used medications, including cimetidine and trimethoprim,119 competitively inhibit creatinine secretion, thereby reducing creatinine clearance and raising the serum creatinine concentration, despite no effect on GFR. Clinically, it can be difficult to distinguish a rise in serum creatinine due to drug-induced inhibition of creatinine secretion from a decline in GFR. A clue to inhibition of creatinine secretion is that urea clearance and blood urea nitrogen concentration are unchanged.

Some investigators have proposed using cimetidine to inhibit creatinine secretion during creatinine clearance measurements, thereby permitting a more accurate assessment of GFR.120,121 However, complete inhibition of creatinine secretion may require prolonged high dose cimetidine therapy.122 Variable inhibition of tubular secretion by cimetidine makes interpretation of the test difficult.

Tubular Reabsorption of Creatinine. To a limited extent, creatinine may also be reabsorbed by the tubules. Studies in normal animals and humans with very low urine flow rates,123,124,125 and in patients with decompensated congestive heart failure or uncontrolled diabetes mellitus126,127,128,129,130 have demonstrated a ratio of clearances of creatinine and inulin < 1.0. Reabsorption of creatinine may be due to its passive back-diffusion from the lumen to blood because of the high tubular creatinine concentration that occurs during low urine flow. Based on the clearance ratios observed in these studies, the maximum effect of creatinine reabsorption probably would be a 5% to 10% decrease in creatinine clearance.


Creatinine Metabolism

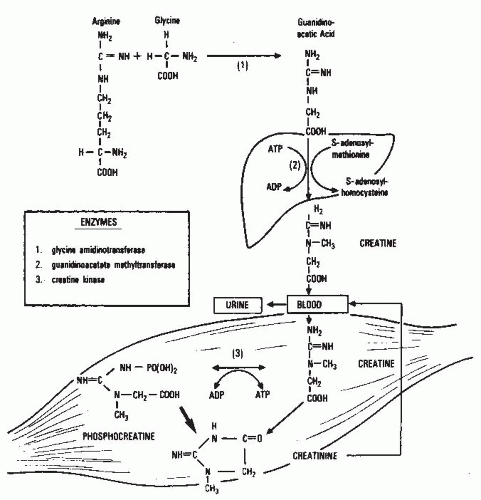
Generation. Creatinine is distributed throughout total body water. It is generated in muscle from the nonenzymatic conversion of creatine and phosphocreatine (Fig. 9.8).131 Approximately 98% of the total creatine pool is contained in muscle and about 1.6% to 1.7% per day is converted to creatinine.131 For example, in an individual with a total creatine pool of 100 g, creatinine generation would be 1.6 to 1.7 g per day. Thus, creatinine generation is proportional to muscle mass, which can be estimated from age, gender, and body size (Fig. 9.9).132 Based on five reports containing data on 1,100 healthy individuals and patients without renal or hepatic disease, Walser derived the following equations to estimate urine creatinine excretion133:


where creatinine excretion (given in mg/kg/day) is assumed to equal creatinine generation and age is given in years. These equations do not take into account racial and ethnic differences in muscle mass. African American men and women have higher muscle mass and, consequently, higher creatinine excretion than their European American counterparts.134,135,136,137,138

Recently, Ix and colleagues derived equations in a pooled dataset of six studies of 2,466 black and white subjects with and without kidney disease and diabetes.139 These equations were more accurate than those proposed by Walser and may be more generalizable.


The relationship of creatinine generation to age, gender, and body weight is affected by muscle mass and diet. Muscle wasting is associated with a decreased creatine pool, which leads to decreased creatinine generation and excretion.140,141,142,143 However, some muscle diseases are associated with increased creatine turnover,141 which in principle could transiently
increase creatinine generation and excretion. Reduction in dietary protein causes a decrease in the creatine pool by 5% to 15%, which is probably due to the reduction of the availability of creatine precursors, arginine, and glycine.131,144 Of greater importance is the effect of creatine in the diet. Creatine is contained largely in meat; uncooked lean beef contains about 3.5 to 5 mg of creatine per g.145,146 Elimination of creatine from the diet decreases urinary creatinine excretion by as much as 30%.144,147,148 Conversely, ingesting a creatine supplement increases the size of the creatine pool and increases creatinine excretion.144,149,150,151 Meat intake also affects creatinine generation and excretion independent of its effect on the creatine pool. During cooking, a variable amount (18% to 65%) of the creatine in meat is converted to creatinine, which is absorbed from the gastrointestinal tract. Therefore, following ingestion of cooked meat, there is a sudden transient increase in the serum creatinine concentration and urinary creatinine excretion. These findings are not observed when a similar quantity of uncooked meat is ingested.152,153


FIGURE 9.8 Pathways of creatinine metabolism. (From Heymsfield SB, Arteaga C, McManus C, et al. Measurement of muscle mass in humans: validity of the 24-hour urinary creatinine method. Am J Clin Nutr. 1983;37:478, with permission.)

Extrarenal Elimination. Extrarenal loss of creatinine is not detectable in normal individuals, but may account for up to 68% of daily creatinine generation in patients with severe decrease in GFR. One likely, but still not established, mechanism is degradation of creatinine within the intestinal lumen by microorganisms due to induction of the enzyme creatininase.154,155,156,157,158

Thus, in patients with kidney disease, creatinine excretion underestimates creatinine generation:


where Ecr is the rate of elimination of creatinine by extrarenal routes.


Measurement of Creatinine

Creatinine can be measured easily in serum, plasma, and urine and a variety of methods are used by clinical laboratories. The National Kidney Disease Education Program (NK-DEP) and the International Federation of Clinical Chemistry and Laboratory Medicine (IFCC) have recently completed standardization of serum creatinine assays to minimize differences in clinical laboratories and facilitate more accurate reporting of estimated GFR.114,159 The reference standard for creatinine assay is isotope dilution mass spectrometry (IDMS) using either gas or liquid chromatography.114,160,161 All instruments can now be calibrated to standardized serum creatinine using secondary reference materials and proficiency testing programs.162 Calibration does not eliminate the problem of interference by specific substances in serum with specific assays.161


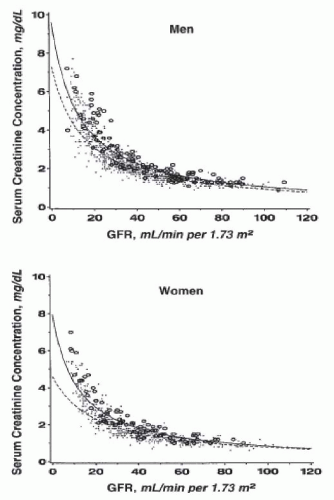
FIGURE 9.9 Relationship of serum creatinine concentration to measured glomerular filtration rate (GFR) in the Modification of Diet in Renal Disease Study. GFR was measured as the urinary clearance of 125I-iothalamate. Serum creatinine concentration was measured using a Beckman Astra CX3 analyzer and a kinetic alkaline picrate assay.33,47 Regression lines were computed from the relationship of reciprocal of serum creatinine versus GFR. When GFR is 60 mL/min/1.73 m2, the 95% confidence interval for the serum creatinine concentration is 1.4 to 1.8 mg per dl for white men (n = 802) and 1.3 to 1.5 for African American men (n = 113) (left panel), and 1.1 to 1.4 mg per dl (97.2 and 123.8 µmol per L) for white women (n = 502) and 1.0 to 1.2 mg per dl (88.4 and 106.1 µmol per L) for African American women (n = 84) (right panel). These levels are close to the upper limit of the reference range. Confidence intervals for serum creatinine levels are wider at lower levels of GFR. (Reproduced with permission from Stevens LA, Coresh J, Greene T, et al. Assessing kidney function—measured and estimated glomerular filtration rate. N Engl J Med. 2006;354(23):2473-2483.)

The classic method uses the Jaffé reaction in which creatinine reacts directly with picrate ion under alkaline conditions to form a red-orange complex that is easily detected and quantified.163 However, in normal subjects, up to 20% of the color reaction in serum or plasma is due to substances other than creatinine. Two classes of positive interferences have been described: substances such as glucose, ascorbate, and uric acid, which slowly reduce the alkaline picrate, and substances such as acetoacetate, pyruvate, other ketoacids, fluorescein, furosemide, hemoglobin, paraquat and diquat, and serum proteins which react with alkaline picrate to form colored complexes. The error in measurement can be greater, however, in diabetic ketoacidosis due to the increased concentration of acetoacetate, and in patients taking certain cephalosporins which can contribute to the colorimetric reaction. Very high serum bilirubin levels can cause falsely lower creatinine levels. In patients with kidney disease, noncreatinine chromogens are not retained to the same degree as creatinine. Consequently, the overestimation of serum creatinine and the corresponding underestimation of creatinine clearance are reduced. In general, noncreatinine chromogens are not present in sufficient concentration in urine to interfere with creatinine measurement. Hence, measurement of creatinine clearance in normal individuals using the Jaffé reaction results in values that are approximately 20% lower than the true value.

The kinetic alkaline picrate method takes advantage of the differential rate of color development for noncreatinine chromogens compared to creatinine. It significantly reduces, but does not eliminate, both types of positive interferences described earlier. A survey by the College of American Pathologists (CAP) in 2004 found that assays based on the alkaline picrate method were the most widely used in clinical laboratories in the United States.162

To circumvent interferences in the alkaline picrate reaction, other methods have been developed which are increasingly used by clinical laboratories. Enzymatic methods include the creatinine iminohydrolase and creatininasecreatinase-sarcosine oxidase methods. The antifungal agent, flucytosine, interferes with the creatinine iminohydrolase method, whereas bilirubin, dopamine, dobutamine, ascorbic acid, and sarcosine may interfere with the creatinasecreatininase methods. HPLC is a fairly sensitive and analytically specific method for measuring serum creatinine, but technically more difficult than enzymatic methods. Enzymatic and HPLC methods usually provide values that are 10% to 20% lower than kinetic alkaline picrate methods and are closer to the reference standard.


Serum Creatinine as an Index of Kidney Function

Based on substitutions and rearrangements of Equations 9.20 and 9.24, the relationship between GFR and serum creatinine is as follows:


Estimating equations have been developed to estimate creatinine clearance164,165,166,167,168,169,170 and GFR.171,172,173,174 Most use age, sex, and body size as surrogates for creatinine generation. According to the June 2008 Chemistry Survey of the College of American Pathologists (CAP), 77% of clinical laboratories report eGFR when serum creatinine is measured.114


Due to its relative ease of use, one of the first estimating equations to be widely used is the Cockcroft and Gault formula.164


where Ccr is expressed in mL per minute, age is expressed in years, body weight is expressed in kg, and Scr is expressed in mg per dl. The formula was derived in 236 men (mean measured creatinine clearance of 73 mL per minute) in 1973. The formula for women was based on the assumption that creatinine generation is 15% less in women than in men. The Cockcroft and Gault formula was extensively validated before standardization of creatinine assays, but cannot be re-expressed for use with standardized creatinine assays. Use of standardized serum creatinine values in the Cockcroft and Gault equation leads to overestimates of creatinine clearance. Because measured creatinine clearance exceeds measured GFR, these overestimations may be particularly misleading.

Recent studies have developed equations to estimate GFR rather than creatinine clearance. The most commonly used equation is the Modification of Diet in Renal Disease (MDRD) Study.132,175


where eGFR is expressed in mL/min/1.73 m2, Scr is expressed in mg per dl, and age in years. The MDRD Study equation has now been re-expressed for standardized serum creatinine as


The MDRD Study equation was developed in 1,628 patients with chronic kidney disease (mean GFR of 40 mL/min/1.73 m2) who were predominantly white and had predominantly nondiabetic kidney disease. The equation was reported in 1999 and has been validated in African Americans with hypertensive nephrosclerosis, diabetic kidney disease, and kidney transplant recipients.176 Inclusion of the race term significantly improved the prediction, which is likely because of the larger muscle mass in African Americans compared to whites. The MDRD Study equation is more accurate than the Cockcroft-Gault equation as well as measured urinary creatinine clearance. Its main disadvantage is a systemic underestimation of measured GFR and imprecision at higher values. Because of this, NKDEP recommends that eGFR > 60 mL/min/1.73 m2 using this equation not be reported as a numeric value.

In 2009, the Chronic Kidney Disease Epidemiology Collaboration (CKD-EPI) reported a more accurate equation using a large diverse dataset pooled from multiple studies. The development dataset included 8,254 individuals from 10 studies with a mean measured GFR of 68 mL/min/1.73 m2. The validation dataset included 3,859 individuals from 16 additional studies with measured GFR.177


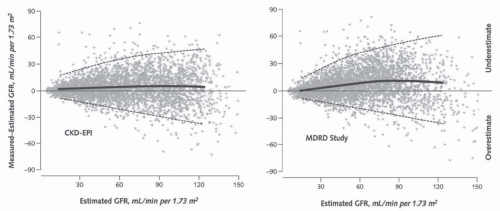
where eGFR is expressed in mL/min/1.73 m2, standardized serum creatinine is expressed as mg per dl, age is expressed in years, χ is 0.7 for females and 0.9 for males, α is —0.329 for females and —0.411 for males, min indicates the minimum of Scr/χ or 1, and max indicates maximum of Scr/χ or 1. The CKD-EPI equation uses the same variables as the MDRD Study equation, but includes a nonlinear term for serum creatinine that substantially reduces bias at higher GFR, enabling numeric eGFR reports throughout the range (Fig. 9.10). The main disadvantage is imprecision in the high range for eGFR. Most but not all studies confirm the greater accuracy of the CKD-EPI equation compared to the MDRD Study equation.178,179,180,181,182,183,184 In addition, because of lesser bias, use of the CKD-EPI equation leads to lower prevalence estimates of decreased GFR in crosssectional studies and more steep risk relationships of eGFR to adverse outcomes in longitudinal studies.111

Modifications to the MDRD Study and CKD-EPI equations have been proposed to account for racial, ethnic, and regional differences in diet and muscle mass.185,186,187 Where these modifications lead to more accurate GFR estimations, it may be reasonable to substitute them for the MDRD Study and CKD-EPI equations, but it is not clear from the current literature whether these modifications truly reflect population differences in non-GFR determinants or methodologic differences, such as GFR measurement, serum creatinine assay, or subject selection.

Currently, most clinical laboratories report eGFR using the MDRD Study. In April 2011, large commercial clinical laboratories in the United States began to use the CKD-EPI equation and it is likely that it will be used more widely in the future. Only a small number of clinical laboratories in the United States report estimated creatinine clearance using the Cockcroft and Gault equation. However, since 1979, the U.S. Food and Drug Administration (FDA) has recommended the Cockcroft and Gault equation for pharmacokinetic studies used for drug development and labeling. For these reasons, drug dosing recommendations by pharmacists are generally based on estimated creatinine clearance computed using the Cockcroft and Gault rather than the MDRD Study or CKD-EPI
equations.188 One study shows a relatively high concordance in drug dosing recommendation using all three of the equations compared to measured GFR, and the NKDEP suggests using GFR estimates reported by clinical laboratories for drug dosing.189,190 Further guidance by the FDA is needed.


FIGURE 9.10 Comparison of performance of Modification of Diet in Renal Disease (MDRD) Study and Chronic Kidney Disease Epidemiology Collaboration (CKD-EPI) equations by estimated glomerular filtration rate (GFR) in the external validation dataset. Left. Measured versus estimated GFR. Right. Difference between measured and estimated versus estimated GFR. Shown are smoothed regression line and 95% confidence interval (computed using the lowest smoothing function in R), using quantile regression, excluding lowest and highest 2.5% of estimated GFR values. To convert GFR from mL/min/1.73 m2 to mL/s/m2, multiply by 0.0167. (Reproduced with permission from Levey AS, Stevens LA, Schmid CH, et al. A new equation to estimate glomerular filtration rate. Ann Intern Med. 2009;150(9):604-612.)

In summary, there are limitations to the use of estimating equations based on the physiologic, analytical, and statistical principles described earlier.106,108 Tables 9.4 and 9.5 list clinical situations in which estimating equations may not be accurate and clearance measurements may be indicated as a confirmatory test.106


TABLE 9.5 Clinical Situations in Which Estimating Equations for Creatinine Clearance or Glomerular Filtration Rate Measurements May Not be Accurate and Clearance Measurements May be Recommended


Extremes of age and body size


Severe malnutrition or obesity


Diseases of skeletal muscle


Paraplegia or quadriplegia


Vegetarian diet


Rapidly changing kidney function


Pregnancy


Prior to dosing drugs with significant toxicity that are excreted by the kidneys


Urea as a Filtration Marker

A relationship between serum urea and kidney function was recognized long before the development of the concept of clearance of or techniques to assess GFR.191 The factors influencing both the production of urea and its renal excretion, however, are considerably more complex and variable than those for creatinine (Table 9.6).113 In the United States, urea is traditionally assayed as urea nitrogen. The usual concentration of serum urea nitrogen (for historical reasons, often referred to as the blood urea nitrogen, or BUN) in healthy young people is in the range of 8 to 12 mg per dl, but the reference ranges in clinical laboratories are wider to take into account variation among individuals. The urea clearance is rarely used today as a measure of kidney function, and the serum urea nitrogen concentration has been replaced largely by the serum creatinine concentration as an index of GFR in routine clinical practice. Nonetheless, measurement of the BUN remains useful both as a diagnostic aid in distinguishing among the various causes of acute decline in GFR and as a rough correlate of uremic symptoms in kidney failure. To understand the utility and shortcomings of BUN measurements, a brief summary of the kidney handling and metabolism of urea is presented subsequently.


Kidney Handling of Urea

Urea (molecular weight 60 daltons) is filtered freely by the glomerulus and reabsorbed in both the proximal and distal
nephron. Hence, urea excretion (UUN × V) is determined by both the filtered load and tubular reabsorption (TRUN)


TABLE 9.6 Clinical Conditions that Cause Errors in the Estimation of Glomerular Filtration Rate from Measurement of Urea Clearance or Blood Urea Nitrogen


Effect on


Condition


Curea


BUN


Comment


Extracellular Volume


Dehydration


Decrease


Increase


Increased urea reabsorption


Reduced renal perfusion (volume depletion, congestive heart failure)


Decrease


Increase


Reduced GFR, increased urea reabsorption, increased urea generation


Overhydration


Increase


Decrease


Reduced urea reabsorption


Increased renal perfusion (volume expansion, pregnancy, syndrome of inappropriate ADH secretion)


Increase


Decrease


Increased GFR, reduced urea reabsorption


Dietary Protein or Catabolism


Restriction of dietary protein


Decrease


Decrease


Sustained decrease in GFR and reduced urea generation


Increased dietary protein


Increase


Increase


Sustained increase in GFR and increased urea generation


Accelerated catabolism (fever, trauma, GI bleeding, cell lysis, therapy with tetracycline or corticosteroids)


None


Increase


Increased urea generation


Liver Disease


Decreasea


Decreasea


Decreased GFR, decreased urea reabsorption, decreased urea generation


Kidney Disease


Nonea


Decreasea


Decreased GFR, no change in urea reabsorption, decreased urea generation (if dietary protein is restricted)


a Effects on Curea and BUN relative to effects on GFR (i.e., Curea is lower than expected for the reduction in GFR).


ADH, antidiuretic hormone; BUN, blood (serum) urea nitrogen; Curea, urea clearance; GFR, glomerular filtration rate; GI, gastrointestinal. From Levey AS. Clinical evaluation of renal function. In: Greenberg A, ed. Primer of Kidney Diseases. San Diego: Academic Press; 1998.


Consequently, clearance of urea (or urea nitrogen, CUN) is less than GFR


A large fraction of the filtered load of urea is reabsorbed in the proximal convoluted tubule. In the medullary collecting duct, urea reabsorption is linked closely to water reabsorption. In the absence of antidiuretic hormone (diuresis), the medullary collecting duct is relatively impermeable to urea; thus, urea reabsorption is minimal. Conversely, in the presence of antidiuretic hormone (antidiuresis), permeability rises and urea reabsorption increases. In normal individuals, the ratio of urea clearance to GFR varies from as high as 0.65 during diuresis to as low as 0.35 during antidiuresis.

In patients with GFR less than 20 mL/min/1.73 m2, the ratio of urea clearance to GFR is higher (0.7 to 0.9) and is not influenced greatly by the state of diuresis. Thus, urea clearance is approximately 5 mL per minute less than GFR. By coincidence, at this level of GFR, the difference between the values of GFR and urea clearance is similar to the difference between the values of creatinine clearance and GFR. Hence, the average of the clearances of urea and creatinine approximates the level of GFR.172,173 This coincidence provides a relatively simple method to assess GFR in advanced renal disease. A single blood sample and 24-hour urine collection may be analyzed for creatinine and urea nitrogen
and the values for clearance may be averaged. However, the kidney handling of urea and creatinine is influenced by different physiologic and pathologic processes and may vary independently, causing deviations from this approximation.


Urea Metabolism

The metabolism of urea, its relationship to dietary protein intake, and the effect of renal insufficiency on protein metabolism are discussed in detail in Chapter 72. Briefly, urea is the end product of protein catabolism and is synthesized primarily by the liver. Approximately one quarter of synthesized urea is metabolized in the intestine to carbon dioxide and ammonia; thus, the ammonia that is generated returns to the liver and is reconverted to urea.

Dietary protein intake is the principal determinant of urea generation and may be estimated as follows:


where EPI is estimated protein intake, GUN is urea generation, and both are measured in g per day.192 Usual protein intake in the United States is approximately 100 g per day,193,194,195 corresponding to a usual value for urea nitrogen generation of approximately 15 g per day.

In the steady state, urea generation can be estimated from the measurements of urea excretion, as shown below:


where GUN and UUN × V are measured in g per day, weight is measured in kg, and 0.031 g/kg/day is a predicted value for nitrogen losses other than urine urea nitrogen.196 For a 70-kg individual with a dietary protein intake of 100 g per day, urea excretion and other nitrogen losses would be approximately 13 and 2 g per day, respectively.


Measurement of Urea

The urease method assays the release of ammonia in serum or urine after reaction with the enzyme urease.197 The presence of ammonium in reagents or use of ammonium heparin as an anticoagulant may falsely elevate the BUN, as can the drugs chloral hydrate, chlorbutanol, and guanethidine.198 Urea is also subject to degradation by bacterial urease. Bacterial growth in urine samples can be inhibited by refrigerating the sample until measurement or by adding an acid to the collection container to maintain urine pH < 4.0.


Blood Urea Nitrogen as an Index of Kidney Function and Protein Intake

In the steady state, the BUN level reflects the levels of urea clearance and generation.


Consequently, many factors influence the level of BUN (Table 9.6). Nonetheless, the BUN can be a useful tool in some clinical circumstances.

As mentioned earlier, the state of diuresis has a large effect on urea reabsorption and a small effect on GFR, but does not affect creatinine secretion. Hence, the state of diuresis affects urea clearance more than creatinine clearance, and is reflected in the ratio of BUN to serum creatinine. The normal ratio of BUN to serum creatinine is approximately 10:1. In principle, a reduction in GFR without a change in the state of diuresis would not alter the ratio. However, conditions causing antidiuresis (dehydration or decreased kidney perfusion) would decrease GFR and increase urea reabsorption, thus raising the BUN-to-creatinine ratio. Consequently, the BUN-to-creatinine ratio is a useful aid in the differential diagnosis of acute GFR decline. Conversely, overhydration or increased renal perfusion would raise GFR and decrease urea reabsorption, thus lowering the serum creatinine and the BUN-to-creatinine ratio.

Also important is the well-recognized relationship of the level of renal function, the BUN level, and clinical features of uremia. A useful “rule” is that a BUN level greater than 100 mg per dl is associated with a higher risk of complications in both acute and chronic kidney failure and may indicate the need to initiate dialysis.199,200 In both acute and chronic kidney disease, restriction of dietary protein intake to 40 to 50 g per day would reduce urea nitrogen excretion to approximately 4.5 g per day. Consequently, the BUN level might rise to only 40 to 60 mg per dl, despite severe reduction in GFR. Although protein restriction may temporarily ameliorate some of the uremic symptoms, severe reduction in GFR is associated with development of uremic symptoms despite only moderate elevation in BUN.

Urea generation and the BUN are also influenced by factors other than protein intake.192 An increase is observed after the administration of corticosteroids, diuretics, or tetracyclines; after the absorption of blood from the gut; and in infection, renal failure, trauma, congestive heart failure, and sodium depletion. Decreases in urea generation and BUN may occur in severe malnutrition and liver disease. These conditions may also affect the BUN and the BUN-to-creatinine ratio.


Cystatin C as a Filtration Marker

Cystatin C has been proposed as an endogenous filtration marker. Assays for cystatin C are available in some countries in Europe but are not yet available in the United States. Research studies show that serum levels in healthy young adults are approximately 0.8 mg per L.201

Only gold members can continue reading. Log In or Register to continue

Stay updated, free articles. Join our Telegram channel

May 29, 2016 | Posted by in NEPHROLOGY | Comments Off on Laboratory Evaluation of Kidney Disease

Full access? Get Clinical Tree

Get Clinical Tree app for offline access