Imaging of Gastrointestinal Malignancies
Sean D. Curran
Lawrence H. Schwartz
Introduction
The imaging of gastrointestinal (GI) malignancies continues to evolve and improve. Several different imaging modalities are often required in the workup once a cancer is suspected or identified. Barium studies remain useful for assessment of luminal tumors and their extent. Cross-sectional studies such as computed tomography (CT), magnetic resonance imaging (MRI), and ultrasonography (US) remain the main modalities for diagnosis and staging of most cancers (1,2). Endoscopic ultrasound (EUS) is a powerful tool in experienced hands for diagnosis and intervention in selected patients with esophageal, rectal, and pancreatic cancer. The emergence of the combination of fluoro-deoxy glucose positron emission tomography (FDG-PET) and positron emission tomography CT (PET-CT) in a single scanner has overshadowed PET in recent years due to its increased ability to fuse the functional information of PET with the accurate anatomical localization of CT, showing excellent results in detection and recurrence of colorectal cancer (CRC) and esophageal cancer, as well as treatment response of gastrointestinal stromal tumors (GISTs) and lymphoma. Significant improvement in the spatial resolution of CT with the introduction of 16- and 64-slice scanners has enabled the generation of clear images in the sagittal and coronal planes, rendering CT arteriography (CTA) an adequate replacement for invasive arteriography for assessment of hepatic vessels prior to surgery. In the future, functional imaging in the form of PET-CT and MRI will likely become an essential tool in the detection and monitoring of treatment response for many of these malignancies (3).
Imaging of cancers once diagnosed often determines and directs appropriate therapies that are stage dependent (Fig. 9.1). Determination of involvement of locoregional lymph nodes is critical, and imaging by CT or MRI can determine this by size (>1 cm on short axis diameter). However, it is well known that normal-size lymph nodes can harbor cancer cells and that enlarged nodes may not represent cancer (4).
Barium studies still remain the initial radiologic workup for suspected luminal cancers (5). The location and extent of the tumor may be shown to help direct biopsy or stent placement when required. Double-contrast barium enema (DCBE) can detect polyps and small tumors in those able to tolerate the procedure. Virtual colonoscopy (computed tomography colonography [CTC]) has not been proven accurate enough to be used as a screening method and is limited due to its inability to sample lesions.
Physics of Imaging
There are significant differences in the physical principles on which the major imaging modalities are based. Although a detailed description of the physics of medical imaging is beyond the scope of this chapter, the essential points are briefly covered in this section.
Ultrasonography
High-frequency sound waves are transmitted through the body by a transducer. The transducer converts electric pulses into sound waves using a piezoelectric material. Transducer frequencies range from 2 to 16 MHz. The time of flight of the sound wave to be received back to the transducer is used to determine the depth of an object. The speed of sound in tissue is more than five times that in air; ultrasound functions only when there is no air between the probe and the target. Sound waves are reflected back in varying degrees, depending on the reflectivity of the tissues at interfaces. The amount reflected is based on both the angle of incidence and the difference between the acoustic impedances of the tissues on either side of the interface. The received echo signals are detected and translated into luminance to form an image with depth perception.
Spatial resolution in ultrasonography has two distinct components: an axial component and a lateral component. The axial resolution is defined as the ability to discern two objects that lie on top of one another. It is dependent on the length of the transmitted ultrasonographic signal. The lateral resolution, the ability to discriminate between two adjacent objects, is determined by the transducer beam width.
Tissue harmonic imaging refers to use of the second and greater fundamental frequencies to generate an image, thus reducing artefact and scatter at least in the near field. This technique has been shown to improve visualization of many structures, especially in the “difficult to scan” or obese patient.
Computed Tomography
CT uses conventional x-rays to generate two- and three-dimensional images with the help of a computer. The technology has continued to improve as scanners become faster each year. Early CT scanners used an incremental technology in which images were produced at a given table position. Each slice of the patient’s anatomy was obtained by moving the x-ray tube in a circle around the patient, with the table remaining stationary. Image reconstruction started during the scan and was completed shortly after the scan was done. The table was
then moved and the process completed for each slice until the predetermined field of view (FOV) was covered.
then moved and the process completed for each slice until the predetermined field of view (FOV) was covered.
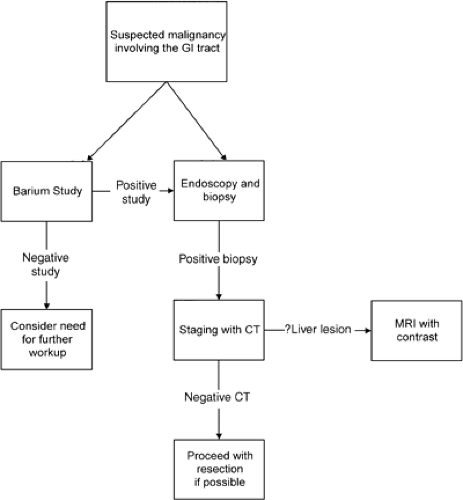 FIGURE 9.1. Algorithm for the investigation of a suspected malignancy involving the lumen of the gastrointestinal (GI) tract. CT, computed tomography; MRI, magnetic resonance imaging. |
All newer generation CT scanners are spiral, in which the tube (x-ray source) continuously rotates around the patient who is continuously moved (translated) at a certain speed defined by the pitch. There is continuous data acquisition, which allows for superior temporal resolution. The computer then generates true axial slice data from the oblique spiral data. Since 2002, CT scanners are now multidetector (4, 8, 16, or 64), meaning that instead of using a single detector, they use a row of detectors called a detector array. The detector array enables simultaneous acquisition of 4 or 16 slices during one gantry rotation. Subsecond gantry rotation speeds have enabled chest abdomen and pelvis to be fully scanned in a single breath-hold.
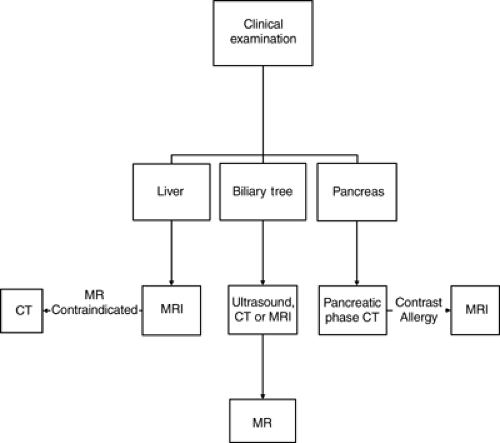 FIGURE 9.2. Workup of a suspected solid organ malignancy. CT, computed tomography; MRI, magnetic resonance imaging. |
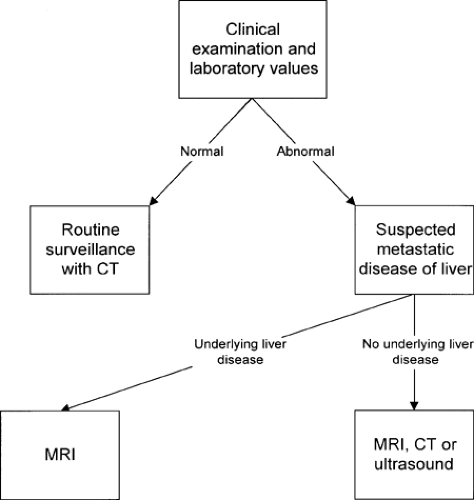 FIGURE 9.3. Workup of suspected metastatic disease to the liver. CT, computed tomography; MRI, magnetic resonance imaging. |
Because data are acquired as a volume, this volume can be reconstructed even retrospectively to obtain slices of different thickness from the raw data (as long as it has not been deleted). Thin reconstructed image slices of ≤1 mm can then be stacked together to generate a volume for three-dimensional reconstruction for angiography and “virtual” endoscopy. These newer generation multidetector (16- and 64-detector or “slice”) CT scanners can generate isotropic volume data sets that can generate clear images in any plane similar to MRI.
CT images are considered high-resolution images (compared to MRI and ultrasonography) at a matrix of 512 × 512 pixels. The FOV divided by the number of pixels determines the resolution or pixel size (or voxel size when discussing three-dimensional volume). For example, if a 51.2-cm FOV is chosen, then each pixel is 1 mm; if a 25.6-cm FOV is chosen, then each pixel is 0.5 mm. Slice thickness plays a role in the voxel size; for example, if the slice thickness is 5 mm, then the voxel is 1 mm × 1 mm × 5 mm. The thinner the slice, the smaller is the volume of the imaging voxel, and this decreases volume averaging.
Magnetic Resonance Imaging
MRI is a technique that uses strong magnetic fields and multiple radiofrequency pulses to generate an image with outstanding spatial resolution and tissue contrast. Certain nuclei have a magnetic moment because they are composed of an odd number of protons and neutrons. When placed in a strong magnetic field, these nuclei attempt to align with the field and rotate or spin (precess) about the axis of the magnetic field. The
frequency of precession (the Larmor frequency) depends on the specific nuclei and the field strength of the magnet.
frequency of precession (the Larmor frequency) depends on the specific nuclei and the field strength of the magnet.
The most commonly imaged nucleus is that of hydrogen 1 because of its abundance in the body and its high gyromagnetic ratio compared with other nuclei, such as those of other commonly found nuclei in the body (e.g., phosphorus 31, sodium 23, carbon 13). When hydrogen nuclei in a strong magnetic field are excited by the addition of a radiofrequency pulse, these nuclei gain energy. When the radiofrequency pulse is turned off, the nuclei return to their resting state and emit the previously absorbed energy at the same frequency. The magnitude of the emitted signal and the time it takes for the nuclei to return to the resting state depend on certain intrinsic properties of the nuclei, which include nuclear spin density (or proton density), longitudinal relaxation, transverse relaxation, and flow.
Spin density (proton density) refers to the density of nuclei potentially available to be imaged. The net signal measured in a given volume is the sum of the hydrogen protons. Therefore, tissues that have few or no hydrogen protons have no MRI signal, such as the air in the lungs or bowel and cortical bone (composed of calcium). The longitudinal (or T1) relaxation time is a measure of the time it takes the precessing nuclei to return to their baseline state (i.e., oriented parallel to the magnetic field) after the radiofrequency pulse has been turned off. The energy released during this process is absorbed by the surrounding molecular environment or lattice; hence, longitudinal or T1 relaxation is also known as spin-lattice relaxation. T1 is the time for the MRI signal to rise to 63% of its maximum equilibrium value. T1 varies between 200 and 800 milliseconds for most tissues. Tissues with a short T1 appear bright on T1-weighted images, and tissues with long T1 (those containing water) are dark.
The transverse (or T2) relaxation time is a measure of the loss of signal in the plane orthogonal to the long axis of the magnetic field due to the loss of phase coherence between the protons. The loss of phase coherence is due to the minute changes in the magnetic field caused by the spinning protons. For this reason, transverse or T2 relaxation is also known as spin-spin relaxation. T2 is the time it takes for the MRI signal to decrease to 63% of its original value. T2 varies between 50 and 200 milliseconds for most tissues. Tissues with a long T2 (those containing water) appear bright on a T2-weighted image.
A number of extrinsic parameters or variables may be manipulated to change the tissue contrast and thus the appearance of an image. The spin echo pulse sequence begins with a 90-degree radiofrequency pulse followed by a 180-degree refocusing radiofrequency pulse. A coherent signal is emitted from the nuclei at the echo time (TE). The complete image data set is produced by repeating this spin echo pulse sequence many times. The time between each successive 90-degree radiofrequency pulse is the repetition time (TR). By varying the TR and TE, one can change the image contrast to produce an image that is either T1 or T2 weighted. Images with a short TE and short TR tend to be T1 weighted, whereas images with a long TE and long TR tend to be T2 weighted. Image matrix size (number of pixels), FOV, and slice thickness may be varied according to the area being imaged, the required detail, and the time available to acquire the image.
Positron Emission Tomography
PET generates images by detecting energy given off by decaying radioactive isotopes. As they decay, radioactive isotopes emit positrons that collide with electrons and produce gamma rays that shoot off in opposite directions. PET systems use the information from the paths of these two gamma rays to determine the original collision point. The scanners have a circular array of gamma ray detectors similar to the arrangement in a CT scanner. The signals are then processed and converted into two- and three-dimensional images.
PET (superseded now by combination PET-CT) is a relatively new technique for use in the staging of GI malignancies (6). The most commonly used compound in clinical practice is FDG-PET scanning, whereby a glucose derivative is tagged with a radioactive label (fluorine 18). This tagged molecule is transported across the cell membrane, and because it is not suitable for complete glycolysis, it accumulates in the metabolically hyperactive cell. Because accumulation occurs at a greater rate than in most normal tissues, a measure of uptake, called the standard uptake value (SUV), may be calculated. Malignant processes tend to have a higher metabolic rate than benign processes, with the notable exception of inflammation or infection. Combination scanners now fuse the functional (PET) images onto anatomical images (CT), which has increased the accuracy of PET (7). Combination PET-CT is also up to 30% faster due to synergies using CT data for registration. Spatial resolution of PET images is currently limited to 5 mm.
Conventional Barium Studies (Fluoroscopy)
Barium studies remain an excellent way of diagnosing GI malignancies, particularly tumors involving lumens. They are obtained using conventional x-rays with the addition of a fluoroscopy unit. Fluoroscopy allows real time x-ray visualization of the patient with the help of variable amounts of barium and air (hence, “double” contrast). X-rays are continuously transmitted onto a fluorescent screen, and with the help of an image intensifier, are projected onto a television monitor for the radiologist. Other contrast agents such as nonionic intravenous contrast can be given in certain situations. Double-contrast examinations show mucosal detail to a greater extent than single-contrast (barium only) examinations and more readily reveal early lesions (8,9,10). Barium examinations are an efficient way to evaluate the GI tract from the esophagus to the rectum and give useful dynamic information that cannot be achieved with cross-sectional imaging. Discussion of the relative roles of barium examinations and endoscopy is beyond the scope of this chapter. Numerous studies have addressed this issue (11,12,13,14,15,16,17). Barium examination and endoscopy each have advantages and disadvantages. The principal advantage of endoscopy is biopsy capability. In patients who are known to have a malignant polyp in the rectosigmoid region, the remainder of the colon should be examined endoscopically (15).
Gastrointestinal Malignancies Involving the Lumen of the Gastrointestinal Tract
Contrast studies of the GI tract can be performed with either barium or water-soluble contrast agents. If there is any risk of aspiration, it is best to use a nonionic contrast agent such as iopromide.
The imaging of suspected neoplasms of the GI tract lumen generally begins with a barium study for the evaluation of nonspecific GI complaints. Evaluation of the esophagus, stomach, and duodenum is best accomplished with an upper GI study. Suspected small bowel pathology may be evaluated with a small bowel follow-through after an upper GI study or with enteroclysis. Small bowel follow-through has poor sensitivity and may become a historical investigation if advances in both CT enteroclysis (18) and wireless capsule endoscopy continue (19). Enteroclysis is usually reserved for specific evaluation of small
bowel pathology when a routine small bowel series is negative and disease is still clinically suspected. Enteroclysis requires small bowel intubation with the passage of a 10-French Maglite tube or similar under fluoroscopic guidance past the ligament of Treitz. Subsequently, a mixture of barium and methylcellulose is injected under pressure via a pump. The double-contrast enteroclysis gives exquisite detail of the small bowel mucosa. Coronal and curved CT reconstructions of the small bowel are likely to help in the diagnosis of small bowel lesions.
bowel pathology when a routine small bowel series is negative and disease is still clinically suspected. Enteroclysis requires small bowel intubation with the passage of a 10-French Maglite tube or similar under fluoroscopic guidance past the ligament of Treitz. Subsequently, a mixture of barium and methylcellulose is injected under pressure via a pump. The double-contrast enteroclysis gives exquisite detail of the small bowel mucosa. Coronal and curved CT reconstructions of the small bowel are likely to help in the diagnosis of small bowel lesions.
DCBE and CTC are used for detection (screening) of colonic polyps or masses in healthy individuals, as well as to exclude (synchronous) second primary lesions preoperatively. In certain circumstances, single-contrast studies, if performed carefully, can adequately evaluate for masses or constricting lesions (9). Double-contrast examinations have the added ability to evaluate the underlying mucosal detail.
Specific diagnosis is not always possible based on imaging findings. Criteria exist to allow for lesion stratification for likelihood of malignancy. Malignant and benign lesions have certain characteristics, depending on their location. Malignant lesions tend to have irregular margins and overhanging edges, which is termed shouldering. Esophageal lesions may also appear as strictures, and differentiating benign from malignant lesions may be difficult because there is overlap in the appearances (20). Benign strictures tend to be long with smooth, tapered edges. However, biopsy of any esophageal stricture seen on barium examination is prudent.
Esophagus
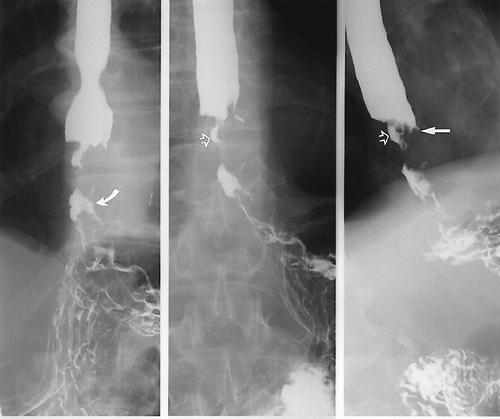
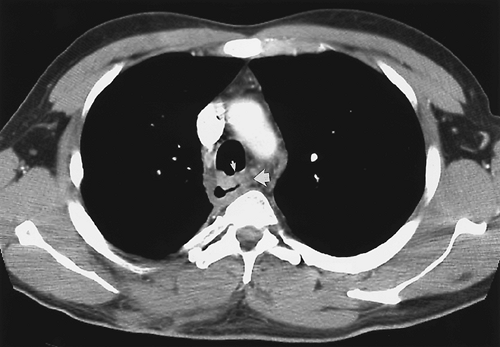
Primary radiographic evaluation of the esophagus usually entails a barium study (Fig. 9.4), although the esophagogram may be prompted by the appearance of abnormalities on images obtained using other modalities. Double-contrast esophagography has 95% sensitivity for detecting esophageal or gastroesophageal junction carcinoma (21). Several methods are available for staging esophageal carcinoma once diagnosed (22,23,24). However, no single imaging modality is ideal, and imaging assessment of esophageal cancer both preoperatively and post resection remains a difficult challenge. The current evidence shows that PET is more accurate than CT in the detection of occult metastatic disease, prediction of the response to therapy, and detection of recurrent disease (25,26). A combination of CT and EUS has been used until recently for locoregional staging (Fig. 9.5). PET has been shown to be more accurate than CT for detecting metastatic esophageal cancer, and so where available, it should be used to avoid unnecessary major surgery (27). PET-CT is now part of the routine workup of esophageal cancer (Fig. 9.6). Recent studies have shown hybrid PET-CT fused images have incremental value over PET and CT in staging (28). Work has also shown that changes in SUV uptake after treatment with combined chemoradiation correlates with progressionfree survival (29). EUS is the superior modality for
T staging (30). CT has limitations in detecting local invasion of the aorta and other adjacent structures, but virtual CT airway bronchoscopy may obviate fiber-optic bronchoscopy to detect invasion of the bronchial system (31). All modalities may either understage or overstage esophageal carcinoma, and the imaging strategy needs to be tailored for each individual patient.
T staging (30). CT has limitations in detecting local invasion of the aorta and other adjacent structures, but virtual CT airway bronchoscopy may obviate fiber-optic bronchoscopy to detect invasion of the bronchial system (31). All modalities may either understage or overstage esophageal carcinoma, and the imaging strategy needs to be tailored for each individual patient.
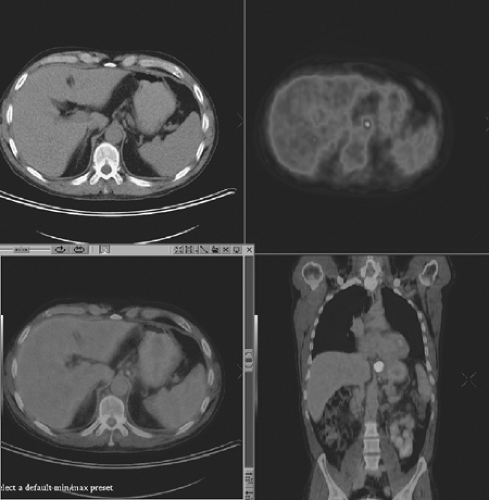 FIGURE 9.6. A 56-year-old man with lower esophageal fusion positron emission tomography computed tomography staging images showing a tumor at the gastroesophageal junction. |
Stomach and Small Bowel
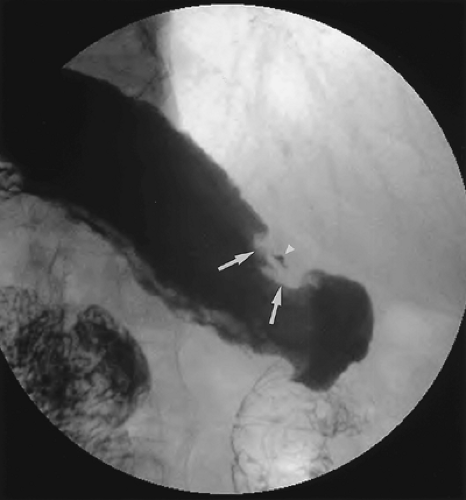
Gastric carcinoma may present in several ways. Malignancies may appear as ulcers or linitis plastica, or as metastatic disease (32). Linitis plastica has a typical appearance in which the stomach is rigid, narrow, and tubular. Malignant gastric masses may also manifest as ulcers. These ulcerated masses may have characteristic appearances on barium studies (Fig. 9.7). Differentiating between benign and malignant ulcers is not always possible. Certain classic findings, however, are associated with both benign and malignant ulcers and are summarized in Table 9.1. Location in the stomach does not differentiate between benign and malignant ulcers. Although benign ulcers are more common on the lesser curvature and in the gastric antrum, malignant ulcers may appear there as well. The appearance of the gastric rugae near the ulcer crater may aid in differentiation. The folds of a benign ulcer extend to the edge of the ulcer crater, whereas the folds of a malignant ulcer end at a distance from the margin of the ulcer. The latter occurs because a mass is usually associated with a malignant ulceration. On a high-quality double-contrast barium study, classic benign ulcers with the features discussed previously may be followed to resolution. A large percentage of ulcers are indeterminate and require biopsy.
Table 9.1 Imaging Findings That Aid in Distinguishing Between Benign and Malignant Gastric Lesions | ||||||||||||
|---|---|---|---|---|---|---|---|---|---|---|---|---|
|
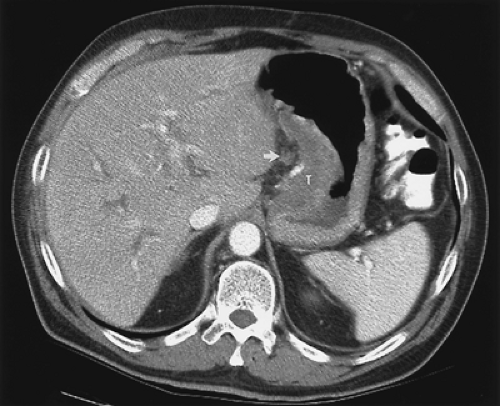 FIGURE 9.8. Gastric cancer. Computed tomography demonstrates a soft tissue tumor (T) in the gastric wall. Note the presence of a lymph node in the gastrohepatic ligament (arrow). |
Once the diagnosis of a malignant lesion is made, the patient generally undergoes a CT examination for appropriate staging (33). CT is useful both for assessing local extent of gastric cancer and for identifying metastatic disease (Fig. 9.8). Occasionally, patients with gastric carcinoma present with extragastric symptoms such as jaundice, the cause of which may be seen on CT. The wall thickness of a well-distended stomach is variable but should always be <1 cm; additional enhancement patterns may aid in the diagnosis of gastric cancer (34). Water is used as a low attenuation oral contrast agent for several reasons. First, adequate distension of the stomach is essential
for depiction of lesions, and enhancement of the stomach wall by intravenous contrast would be obscured by high-density oral contrast agents. Second, the use of traditional oral contrast agents would complicate two- and three-dimensional visualization of gastric vessels with CT angiography (35,36). The presence of a focal mass or focal thickening in a well-distended stomach should alert the physician to the possibility of a gastric malignancy. CT is a good modality for the identification of regional and distant spread; however, it is relatively insensitive for determining resectability. However, most prior studies used slice thicknesses of 5 to 10 mm, which have partial volume averaging with adjacent structures. The problem of partial volume averaging is greatly reduced by using section thicknesses of 1.25 mm with superior multiplanar reconstruction images due to the high speed of multidetector scanners, which also overcome breathing artefacts (37). Criteria used to assess resectability, such as irregularity of the tumor or loss of the fat plane between the mass and the adjacent organs, are not sensitive for invasion (38). When these findings are identified, they should alert one to the possibility of unresectability. It has been shown that PET can demonstrate response to treatment of GISTs by a reduction in SUU (39). This is particularly powerful in the setting of little or no change in tumor size.
for depiction of lesions, and enhancement of the stomach wall by intravenous contrast would be obscured by high-density oral contrast agents. Second, the use of traditional oral contrast agents would complicate two- and three-dimensional visualization of gastric vessels with CT angiography (35,36). The presence of a focal mass or focal thickening in a well-distended stomach should alert the physician to the possibility of a gastric malignancy. CT is a good modality for the identification of regional and distant spread; however, it is relatively insensitive for determining resectability. However, most prior studies used slice thicknesses of 5 to 10 mm, which have partial volume averaging with adjacent structures. The problem of partial volume averaging is greatly reduced by using section thicknesses of 1.25 mm with superior multiplanar reconstruction images due to the high speed of multidetector scanners, which also overcome breathing artefacts (37). Criteria used to assess resectability, such as irregularity of the tumor or loss of the fat plane between the mass and the adjacent organs, are not sensitive for invasion (38). When these findings are identified, they should alert one to the possibility of unresectability. It has been shown that PET can demonstrate response to treatment of GISTs by a reduction in SUU (39). This is particularly powerful in the setting of little or no change in tumor size.
Stay updated, free articles. Join our Telegram channel

Full access? Get Clinical Tree


