Fig. 2.1
Normal multiphasic appearance of the pancreas and adjacent structures. The arterial phase image (a) demonstrates dense arterial enhancement of the celiac artery (arrowhead) and mild enhancement of the pancreas (arrow). The pancreatic parenchymal phase (b) shows excellent arterial enhancement of the splenic artery (arrowhead) with enhancement of the pancreas (arrow). In the portal venous phase (c), there is dense enhancement of the portal vein (arrowhead) with persistent enhancement of the pancreas (arrow). There is parenchymal enhancement of the liver
Pancreatic adenocarcinoma is typically isodense to the normal pancreas on the noncontrast images, limiting their utility for the purposes of staging. Most pancreatic adenocarcinoma tumors enhance less than the normal pancreatic parenchyma and appear hypodense on contrast-enhanced images (Fig. 2.2). The sensitivity for the detection of tumor is greatest in the pancreatic parenchymal phase in comparison to the arterial and portal venous phases due to maximal differential enhancement and image contrast between tumor and normal parenchyma [13]. Isoattenuating and isoenhancing tumors (Fig. 2.3) comprise a small portion of tumors—5.4 % of pancreatic adenocarcinoma tumors evaluated in a recent study [17] and 11 % in an older study [18]. A higher percentage of smaller (2 cm or less) tumors have been shown to be isoattenuating [19]. These tumors are difficult to detect but may be inferred by secondary signs including mass effect of the tumor on the contour of the pancreas or on adjacent structures or by the level of biliary and/or pancreatic ductal obstruction [17, 18]. When tumors are isoattenuating, evaluation of local extent of disease can be difficult; particularly problematic is the assessment of abutment or encasement of the intrapancreatic portion of the portal vein and superior mesenteric vein in the absence of distortion.
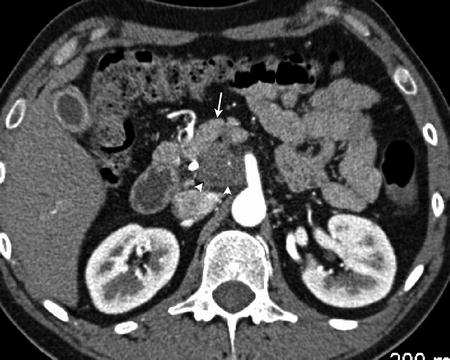
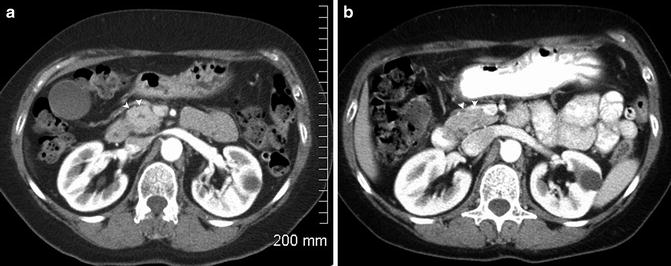
Fig. 2.2
Pancreatic adenocarcinoma in the uncinate process (arrowhead) appears hypodense in comparison to the normal parenchyma (arrow)
Fig. 2.3
Isodense pancreatic adenocarcinoma . A pancreatic head mass (arrowhead, a) is present causing a contour bulge anteriorly which was not present on a comparison CT (b). The central hypodensity seen in (a) is the pancreatic duct
Evaluation of the local extent of the tumor requires careful evaluation of the local vasculature, including the celiac artery and branches, superior mesenteric artery, superior mesenteric vein, and portal vein. Evaluation for aberrant vasculature such as a replaced or accessory right hepatic artery or a replaced common hepatic artery originating from the superior mesenteric artery is also important as the course of these vessels frequently lies between the inferior vena cava and portal vein at the pancreatic head (Fig. 2.4). In the absence of distant metastases, preservation of the fat and soft tissue planes surrounding the adjacent vasculature indicates resectable disease (Fig. 2.5).
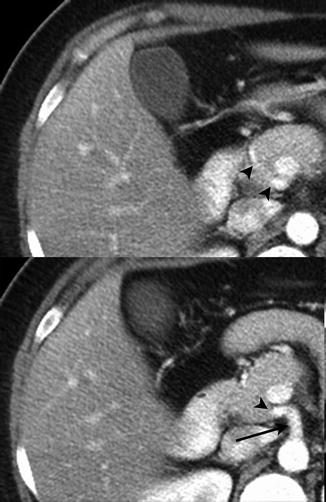
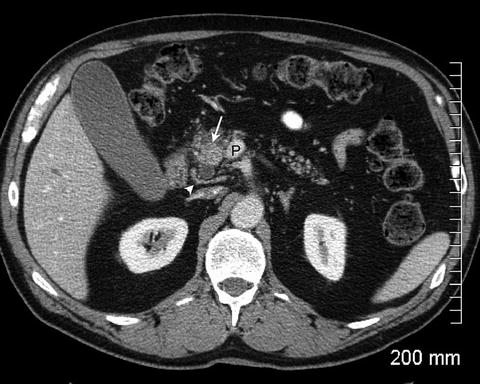
Fig. 2.4
Two adjacent slices demonstrate a replaced common hepatic artery (arrowhead) originating from the superior mesenteric artery (arrow)
Fig. 2.5
The pancreatic head mass (arrow) appears relatively hyperdense due to fatty infiltration of the pancreas. A normal tissue plane is maintained between the tumor and the portal vein (P). There is a replaced right hepatic artery (arrowhead) seen posterior to the pancreatic head
The delineation between resectable, borderline resectable, and unresectable locally advanced tumor is based upon the relationship between the tumor and adjacent vasculature [4–6]. Assessment of tumor involvement of the vasculature has been defined relative to the circumference of the vessel [20] without or with distortion of the vessel. An interface between the tumor and vessel of 180° or less has been termed abutment (Fig. 2.6) and greater than 180° has been termed encasement (Fig. 2.7) [11]. Greater than 180° of interface between tumor and vessel (encasement) was demonstrated to be specific for vessel invasion [20]. Irregularity of the vessel contour or narrowing (deformity) is also indicative of vascular invasion (Fig. 2.8) [11, 14]. Multiplanar reformatted images are beneficial for evaluation of the vessels with tumor involvement and assessment of degrees of the interface between the tumor and the vessel (Fig. 2.9) [15, 21, 22]. Vascular tumor obliteration or bland thrombus should also be noted. Since the definition of borderline resectable tumors includes those tumors where arterial or venous resection and reconstruction are being considered, assessment of longitudinal extent of tumor along the portal vein, superior mesenteric vein, and artery and hepatic artery should also be noted [3].
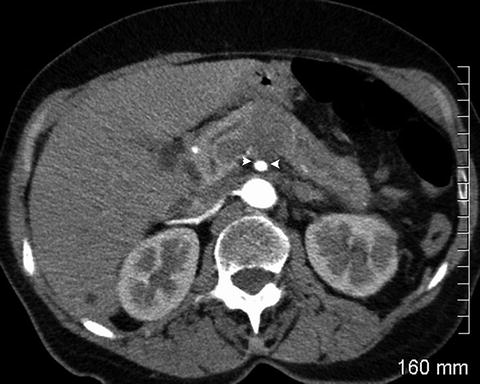
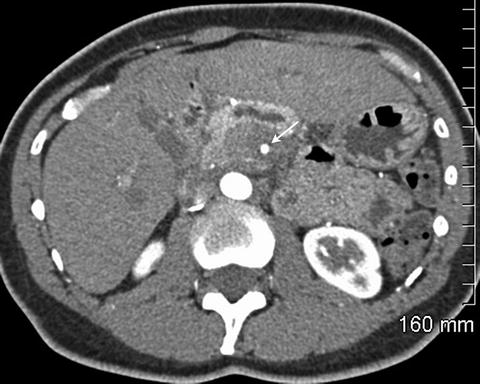
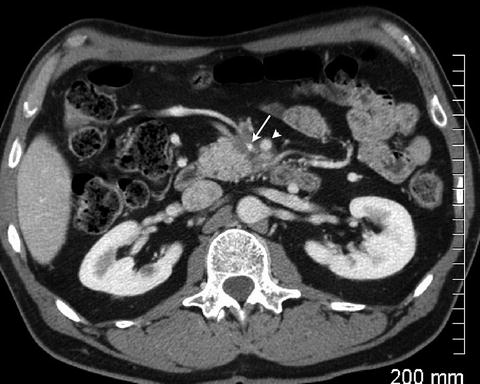
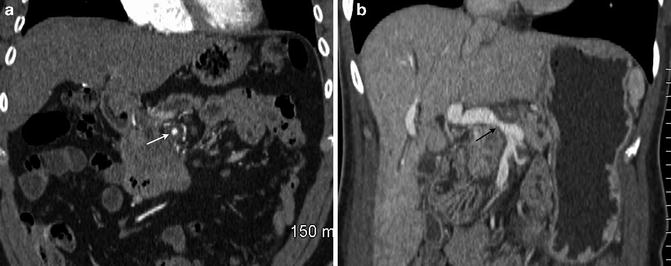
Fig. 2.6
The pancreatic mass abuts the superior mesenteric artery by about 120° (between arrowheads). The soft tissue seen posterior to the superior mesenteric artery is the left renal vein
Fig. 2.7
Pancreatic adenocarcinoma circumferentially encases the superior mesenteric artery (arrow)
Fig. 2.8
Tumor is seen encasing and distorting the superior mesenteric vein (arrow). There is greater than 180° of encasement of the superior mesenteric artery (arrowhead)
Fig. 2.9
Coronal multiplanar reformatted images demonstrate encasement of the superior mesenteric artery (a, arrow) and encasement with narrowing of the portal vein (b, arrow)
The definition of borderline resectable tumor is under some debate with at least three prevailing definitions, the AHPBA/SSO/SSAT consensus conference [6], the NCCN 2014 guidelines [4], and the Intergroup study [5]. The most recent 2014 NCCN guidelines acknowledge the need for more restrictive definitions of borderline resectable tumors in clinical trials [4].
Pancreatic adenocarcinoma may also directly extend to involve adjacent structures, including adjacent bowel, mesentery, spleen, kidneys, adrenal glands, aorta, and inferior vena cava (Fig. 2.10). Manifestations of metastatic disease include hepatic metastases, adenopathy beyond the local region, and peritoneal carcinomatosis. Hepatic metastases are typically hypovascular and are best visualized on portal venous phase imaging, appearing hypodense to the enhancing liver (Fig. 2.11). Small liver lesions can be particularly difficult to characterize [14]. Evaluation for adenopathy is based on size criteria (greater than 1 cm) and enlarged lymph nodes are particularly notable if outside the potential surgical resection bed. Peritoneal tumor may be seen as peritoneal nodularity, omental or serosal thickening or nodularity (Fig. 2.12). However, small volume metastatic deposits on or in the liver and small peritoneal implants are difficult to visualize by imaging [3, 23].
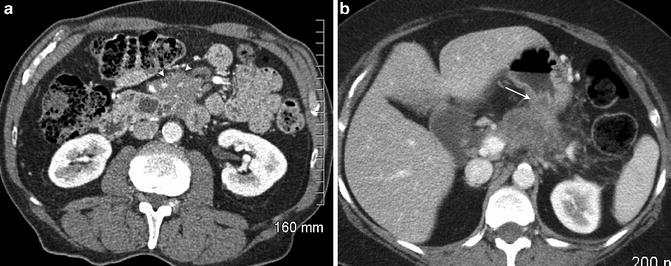
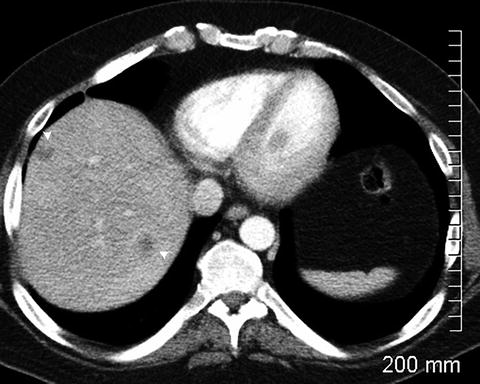
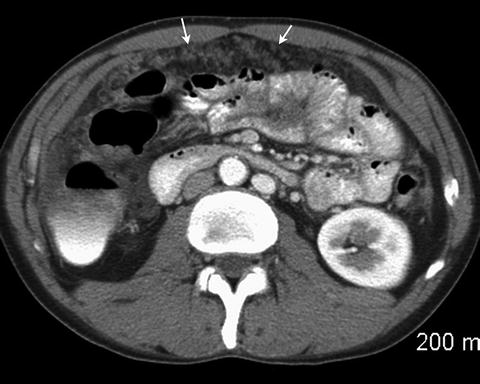
Fig. 2.10
Pancreatic adenocarcinoma with extension into the small bowel mesentery (a, arrowheads) and into the posterior gastric wall (b, arrow)
Fig. 2.11
Hypodense liver lesions (arrowheads) representing metastatic disease
Fig. 2.12
Omental nodules (arrows) are consistent with peritoneal carcinomatosis. A small amount of free fluid is also present
Magnetic Resonance Imaging
Although most centers use MDCT as the primary examination for staging pancreatic cancer, MRI is a useful alternate imaging modality for both detection and staging, particularly when contrast-enhanced MDCT is contraindicated [14]. MR is equivalent to MDCT for detection and assessment of local disease [24–26]. On T1 weighted images, the normal pancreas is relatively hyperintense due to the higher content of protein in the pancreatic acini [10]. This is more conspicuous on T1 weighted images with fat suppression (Fig. 2.13). Tumors are hypointense to isointense to the normal pancreas on T1 weighted images [27]. On T2 weighted images, tumors are usually hyperintense to isointense (Fig. 2.14) [27]. Heavily T2 weighted images acquired for MR cholangiopancreatography (MRCP) will demonstrate the level of biliary or pancreatic ductal obstruction if present (Fig. 2.15) [28]. The atrophic parenchyma in the region of upstream pancreatic ductal dilation may demonstrate decreased signal on the T1 weighted images [10]. With gadolinium-based intravenous contrast administration, images are acquired using fast T1 weighted fat-suppressed 3D gradient echo sequences, also allowing for multiphase acquisitions [29] similar to MDCT (Fig. 2.16). The enhancement characteristics of normal pancreatic parenchyma and tumor are similar to CT, with pancreatic adenocarcinoma enhancing less than normal parenchyma in the arterial and portal venous phases. Lesion conspicuity is greatest on the arterial phase images (Fig. 2.17) [29]. On diffusion weighted images, pancreatic carcinoma tends to have restricted diffusion [10], but these images are less sensitive than the contrast-enhanced images for tumor detection [29]. In addition, diffusion weighted images are unable to differentiate between pancreatic adenocarcinoma and mass forming chronic pancreatitis [30, 31]. Assessment of vascular involvement may also be performed by MR with equivalent performance to MDCT for determination of resectability [32]. Preservation of the fat plane between tumor and vessel is seen as a persistent high T1 signal fat surrounding the vessel on non-fat suppressed T1 weighted images.
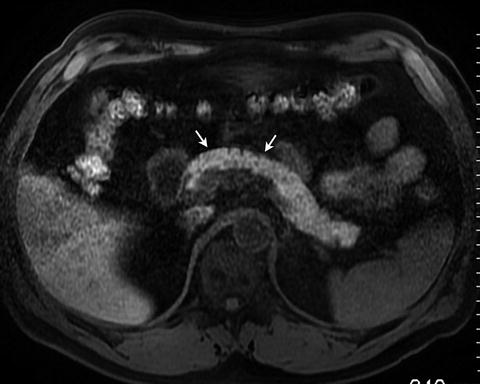
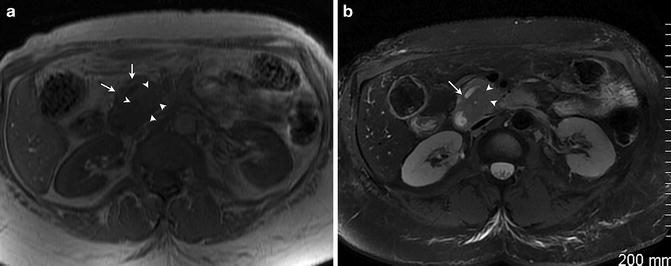
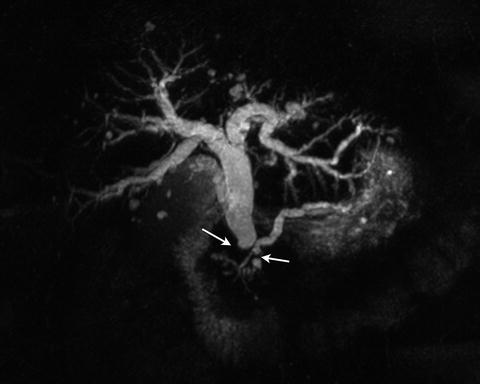
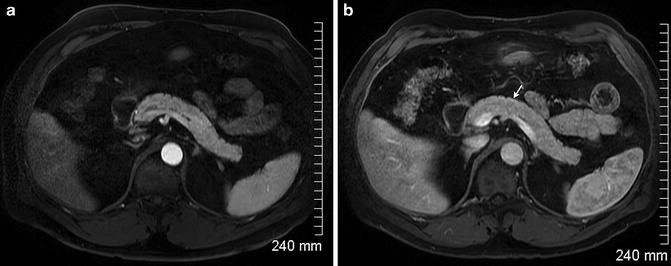
Fig. 2.13
Fat-suppressed T1 weighted spoiled gradient echo image demonstrates bright T1 signal intensity of the normal pancreas (arrows)
Fig. 2.14
Tumor (arrowheads) is hypointense to the pancreas (arrow) on the T1 weighted image. (a) On the fat-suppressed T2 weighted image (b), the mass (arrowhead) is isointense to slightly hypointense to the pancreas. A dilated pancreatic duct (arrow) is seen
Fig. 2.15
3D MRCP image demonstrates the level of biliary and pancreatic ductal dilation (arrows)
Fig. 2.16
 Overview of Multimodality Therapy
Emerging Systemic and Targeted Therapies
Overview of Multimodality Therapy
Emerging Systemic and Targeted Therapies
 Palliative Operations for Unresectable Pancreatic Cancer
 Role of Radiation Therapy
 Surgical Approach to Borderline Resectable Tumors of the Left Pancreas
 Endoscopic and Percutaneous Biliary Drainage Procedures: Role in Preoperative Management, Diagnosis, and Palliation


Arterial phase (a) and portal venous phase (b) images of a normal pancreas with homogeneous enhancement
Related posts:
Overview of Multimodality Therapy
Emerging Systemic and Targeted Therapies
Palliative Operations for Unresectable Pancreatic Cancer
Role of Radiation Therapy
Surgical Approach to Borderline Resectable Tumors of the Left Pancreas
Endoscopic and Percutaneous Biliary Drainage Procedures: Role in Preoperative Management, Diagnosis, and Palliation
Stay updated, free articles. Join our Telegram channel
Full access? Get Clinical Tree
