Gastrointestinal Cancer Management: Biological Aspects of Radiation Therapy
H. Rodney Withers
Kinetics of Response to Irradiation of Mucosal Tissues
Most of the killing of cells by irradiation results from unrepaired or misrepaired injury to their genome, causing a loss of reproductive integrity among clonogenic cells. The rate of cell death is therefore related to the turnover rate of clonogenic cells. Overt injury in rapidly proliferating tissues such as gastrointestinal mucosa, bone marrow, hair, and skin appears early after irradiation, whereas such tissue as fibrovasculature, bones, kidney, and nervous system may not manifest overt injury for months or years. However, the response of a tissue to irradiation is not only a function of rate of turnover of the clonogenic (stem) cell population but is also influenced by the lifetime of the terminally differentiated cells derived from the steadystate proliferation/differentiation activity of the clonogenic cells. For example, when irradiation or drugs sterilize clonogenic cells in the bone marrow, the supply of differentiating functional cells is suppressed, causing a fall in peripheral blood counts. Because the terminally differentiated and nondividing platelets and granulocytes have a short half-life (days), their counts drop quickly, whereas anemia develops slowly (months), reflecting the long half-life of erythrocytes.
Another factor in the development of the radiation response of a tissue is the number of mitotic divisions a lethally injured cell can negotiate before it dies. After the relatively low daily dose of about 2 Gy used in radiation therapy a lethally injured cell may undergo several antemortem divisions, slowing the rate of overt manifestation of injury.
Normal Gastrointestinal Mucosa
Clonogenic cells in the gastrointestinal mucosa are located in the crypts, the site of the most intensive cell turnover in the body. In contrast, the cells lining the villi of the small intestine are terminally differentiated and no longer divide. The mean turnover time of clonogenic cells in the crypts of the small intestine is <24 hours, while the mucosal cells spend about 4 to 7 days on the villus. Therefore, cells in the crypts die fairly rapidly after irradiation, whereas villi shrink at the slower rate determined by the rate at which differentiated cells are shed or otherwise lost (e.g., by apoptosis) from the villous surface (Fig. 6.1).
At the usual rate of dose delivery in radiation therapy to the abdomen (e.g., 1.2–2.0 Gy/session), the development of mucosal injury is slowed or completely counterbalanced by a rapid and effective regenerative response by residual (surviving) clonogenic cells (Fig. 6.1). If small bowel mucosal injury becomes evident (e.g., as diarrhea), it usually begins after about 2 weeks of treatment. Continuation of therapy is possible because of the vigorous repopulation response by surviving clonogens in the crypts. The side effect of mucosal injury to the rectum in the treatment of genitourinary and rectal cancer is proctitis, which develops during the first few weeks of treatment and subsides in a few weeks after the end of treatment, provided injury (especially ulceration) is not excessive.
The kinetics of regeneration of jejunal and colonic mucosae has been measured in experimental mice. After a brief lag period (hours or days), the surviving clonogenic crypt cells regenerate rapidly, although at the expense of a reduced output of functional cells to the luminal surface of the mucosa. Without this vigorous repopulation, the intestinal mucosa would tolerate doses less than half of those used in clinical practice. Conversely, if the effectiveness of this response is compromised, it is easily possible to exceed tolerance of the bowel (e.g., by intensifying treatment), either by increasing the rate of accumulation of radiation dose or by adding drug cytotoxicity to that of the radiation. The most common cause of increased mucosal injury in current practice is from combining radiation and chemotherapy.
Tumors
Contrary to a common perception that tumor cells are more actively dividing than their normal counterparts, the average mitotic turnover rate in gastrointestinal tumors is less than in normal mucosa. Hence, their response to radiation therapy is slower. Most tumors require many weeks for significant regression. Exophytic papillary tumors are an exception and show a much faster rate of regression than the less proliferative ulcerating tumors because they consist of a high proportion of differentiating cells with a relatively rapid rate of turnover, that is, a high rate of “natural” cell loss by differentiation.
Apoptosis occurs extensively in normal tissues and tumors, contributing to the steady-state condition of normal mucosa and slowing the growth rate of tumors. It also increases soon after irradiation and accelerates the rate of response relative to that which would characterize a tissue or tumor without evidence of apoptosis. Agents that promote apoptosis may enhance radiation responses. To be useful clinically, they should influence tumor responses more than those of normal tissues. This may not be possible in the case of the mucosa, but
differentials in response should be achieved between a tumor undergoing extensive apoptosis and a slowly responding normal tissue in which cell turnover is slow or nonexistent and in which apoptosis is not observed.
differentials in response should be achieved between a tumor undergoing extensive apoptosis and a slowly responding normal tissue in which cell turnover is slow or nonexistent and in which apoptosis is not observed.
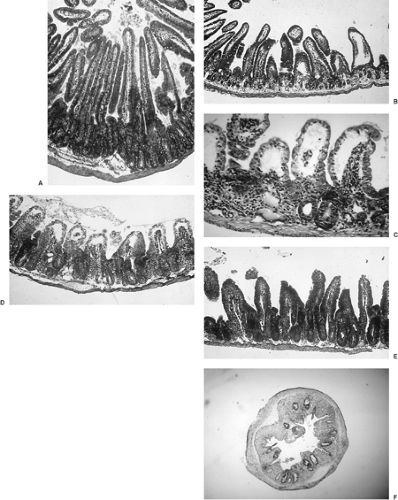 FIGURE 6.1. Histopathology of irradiated jejunum of the mouse. A: 0 dose, but after 4 hours of colcemid-induced mitotic blockade (in metaphase) of proliferating crypt cells Metaphases are identified by hyperchromatic nuclei raised off the basement membrane. B: 24 hours after a large single dose (10 Gy). Note the rapid depletion of crypt cells but little change in the number of nonproliferating cells of the villus. C: 72 hours after 12 Gy. The villi have shortened because of a cessation of supply of new cells from the crypt. Some crypts have been lost (no surviving clonogens), whereas others have regenerated rapidly from usually one but sometimes two or more cells that survived the irradiation. With increase in dose, there is a progressive decrease in the number of crypts in which a clonogenic cell survives. The rate of decline in the number of crypts regenerating from surviving clonogenic cells as a function of dose provides a measure of their radiosensitivity (2). D: 96 hours after 10 Gy. The crypts are completely regenerated and have even “overshot” their preradiation size. Migration of new cells to the villus has begun. E: 120 hours after 10 Gy. The villi are being reformed. F: Mouse descending colon 5.5 days after a high dose (13 Gy) showing regeneration of a proportion of the original 120 crypts visible within one cross-section. Each surviving crypt is derived from a single surviving clonogenic cell, providing an end point for quantifying the dose–survival relationship (radiosensitivity) and for quantifying the rate of regeneration of clonogenic cells (Fig. 6.8). |
Regeneration and Therapeutic Ratio
The doubling times of surviving clonogenic cells in normal mucosa after a dose of 600 cGy have been measured to be as short as 8 to 12 hours in the jejunum and colon of experimental mice (1,2,3), and they are probably not much longer in humans. Because tumor clonogens surviving during a course of radiation therapy regrow less quickly than those of normal mucosa (4,5), a therapeutic gain is achieved by protracting treatment over several weeks. However, the small numbers of tumor clonogens surviving during the latter part of a course of radiation therapy can grow quickly. From consideration of the relative kinetics of early- and late-responding normal tissues and the average tumor, the optimal extent of protraction of treatment is the shortest in which the dose tolerated by late-responding tissues can be delivered without causing unacceptable mucosal injury. This principle applies to radiation therapy for all cancers and is also relevant to chemotherapy.
Late Injury
Bowel Wall
High doses of radiation can injure muscle and fibrovasculature of bowel wall, leading to narrowing and rigidity. These changes may reflect direct injury to connective tissue and muscle elements of the bowel wall or may be caused by scarring and contraction as a consequence of severe and/or protracted mucosal ulceration (6). In mice, complete ulceration of a 4-cm length of jejunal mucosa leads to stricture and death within 3 weeks of irradiation. This type of stricture develops too quickly to be a direct effect on muscle or fibrovasculature, and is a consequence of contraction during the healing of acute mucosal injury. More slowly developing changes in the muscle and fibrovasculature of the wall (e.g., a stricture or fistula) could be the direct result of radiation injury to the wall or could also reflect the end result of an inflammatory response to mucosal ulceration, or both.
Peritoneal Adhesions
Irradiating healthy undisturbed peritoneal surfaces does not result in the development of adhesions. However, in the presence of inflammatory processes, such as persist for weeks or months after laparotomy, or as can be induced in experimental animals by physical or chemical irritants or cytokines, irradiation has the capacity to increase the probability of small bowel obstruction from adhesions between loops of bowel (7).
The probability of this complication occurring is low until total doses exceed about 40 Gy (in 1.6–2.0 Gy fractions) but increases steeply with further escalation of dose. It also is increased when the volume of peritonealized bowel exposed to irradiation is increased (8). This “volume effect” is not an indication of increased radiosensitivity but merely reflects the greater likelihood of an obstruction occurring with the greater the length of bowel surface put at risk for adhesions (9).
Irradiated small bowel that has become entangled and restricted in its movements by adhesions becomes edematous, and its associated fragility can be of major clinical importance in surgery to relieve obstruction. Such changes are not prominent in the absence of adhesions or in the absence of irradiation. Thus, it seems likely, although not established by investigations, that the edema in the wall of irradiated small bowel obstructed by adhesions can be caused both by radiation injury and hemo- and lymphodynamic disturbances.
Cell Killing by Radiation
Most of the cytotoxic effect of irradiation results from misrepair of double-strand breaks in DNA and a consequent loss of capacity for indefinite replication. Presumably as an evolutionary requirement, cells have a great capacity to repair DNA injury, whether from radiation or chemical insult. After a dose of about 2 Gy, as used daily in a course of standard radiation therapy, about 50% of the exposed cells successfully repair sufficient damage to survive (about 2,000 single-strand DNA breaks and about 40 double-strand breaks per cell).
Some of the radiation injury to the genome results from ionizations that injure the DNA directly, but mostly it is induced by free radicals produced in the water of the cell that then damage the DNA. These events occur randomly throughout the cell and do not specifically target DNA. Structures other than DNA are also subject to injury but have greater redundancy and are less critical to the replication and survival of the cell.
Cell survival from radiation decreases geometrically (logarithmically), reflecting the random nature of the distribution of lethal ionization injury throughout a population of cells. Thus, each daily dose of 1.8 to 2.0 Gy, as commonly given in clinical practice, reduces survival of clonogenic cells by the same proportion, not the same number. For example, if 2.0 Gy reduced cell survival to 50% on day 1 of a series of treatments, it would further reduce it by 50% (i.e., to 25% of the initial number on day 2, to 12.5% of the initial number on day 3, etc.). The same sort of dose–response relationship characterizes most cytotoxic biological processes (e.g., sterilization of bacteria by antibiotics or heat, killing of cells by chemotherapy agents).
The quantitative relationship between radiation dose and cell killing has been determined in vitro and in vivo for a wide variety of normal and malignant mammalian cells. In general, the dose–survival curve reflects the addition of two types of injury. Nonrepairable or α-type injury can be envisaged as an instantaneous nonrepairable double-strand break reflecting contemporaneous and complementary single-strand breaks.
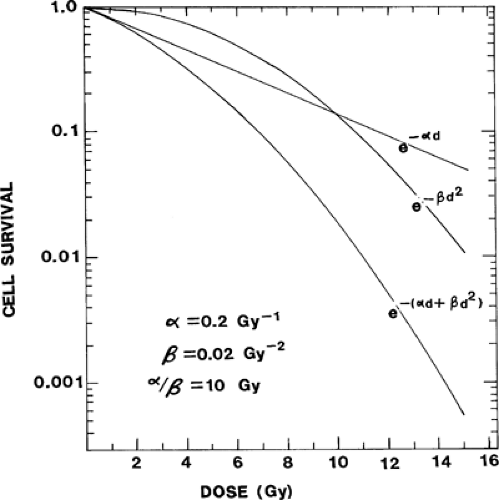
Repairable sublethal (β-type) injury reflects the accumulation and ultimately a lethal interaction between multiple individually nonlethal events (e.g., two complementary but sequential unrepaired single-strand breaks that result in a double-strand break). With nonrepairable injury, the probability of cell killing is a linear function of dose (i.e., if a dose, d, reduces survival to 50%, 2d would reduce it to 25%). If the coefficient for sensitivity to nonrepairable injury is α, cell survival plotted on a logarithmic ordinate as a function of dose on a linear abscissa would be described by a straight line defined by e-αd, as shown in Fig. 6.2. The curve for cell killing through the accumulation of individually sublethal injurious events (β-type injury) is continuously bending because the more sublethal radiation injury (dose) already accumulated in the cell, the greater the likelihood that an increment in sublethal injury will interact with existing injury to become lethal. As shown in Fig. 6.2, the logarithmic plot of cell survival for this type of injury bends downward with increasing dose. Over the dose range of clinical interest, this curve can be described in terms of the square of the dose–surviving fraction = e–βd2, where β is the coefficient for radiosensitivity to accumulative sublethal injury. Thus, the composite curve that results from inflicting both types of cell killing is the lowermost curve in Fig. 6.2 and is described by
Survival = e-(αd + βd2)
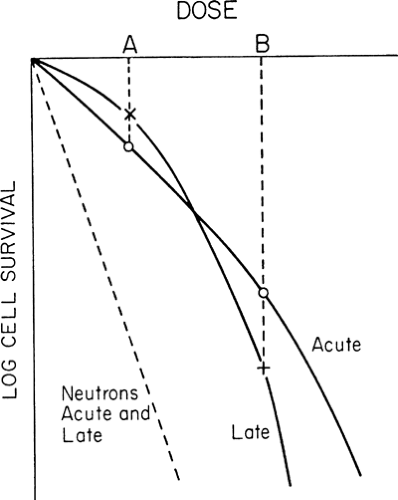
The higher the proportion of α- to β-type injury, the less the survival curve bends downward. For x-irradiation, acutely responding tissues exhibit a higher α/β ratio than slowly responding tissues (10,11). Exposure to densely ionizing beams such as neutrons results in a high proportion of nonrepairable injury, and the survival curve is essentially linear (i.e., the <α/β ratio is high) (Fig. 6.3).
Kinetics of Repair of Sublethal Injury
Injury which remains sublethal can be accumulated because multiple single-strand DNA breaks can be repaired rapidly by repair enzymes already existing within the cell or induced by radiation injury. The half-time for repair of sublethal injury varies among tissues. In some, it appears to be essentially complete in 3 to 4 hours, whereas in others the process may require more than 12 hours (10,12). In general, slowly dividing, late-responding tissues continue to repair sublethal injury longer than acutely responding tissues. This is important when a patient is being treated more than once per day in a “hyperfractionated” or accelerated regimen because to achieve the maximal differential in response between late-responding normal tissues and a tumor, it is necessary that repair in the normal tissue be complete before the next dose. Otherwise, incompletely repaired lesions in DNA are available for interaction with new injury from the subsequent dose (10). Because repair is generally slower in slowly or nonproliferating tissues, the effect of spacing dose fractions too closely (e.g., <6 hours) can be to selectively increase damage to the slowly repairing, late-responding normal tissues, which would then produce increased late toxicity (12).
Cell Killing by Multiple-Dose Fractions
Radiation therapy has evolved to using multiple-dose “fractions” rather than large single doses for most clinical applications. Initially, this approach was based on the observation that irradiation of the testes of experimental animals with multiple daily doses could render them infertile without evidence of desquamation of scrotal skin, whereas this was not possible with a single dose. Subsequent refinements in dose fractionation were based on empirical modifications and careful clinical evaluation of results until, more recently, an emerging body of knowledge of radiation biology has facilitated further refinements. The biological bases and the advantages of dose fractionation are discussed later in this chapter, but one of them relates to repair of sublethal injury, which is more effective, although slower, in slowly responding normal tissues than in proliferative tumors (10,11,12,13).
Provided the time interval between successive dose fractions is long enough for sublethal (β-type) injury to be completely repaired, there is no interaction of sublethal events from the two doses. Thus, the response to a subsequent dose is independent of the previous dose, and a series of equal doses each
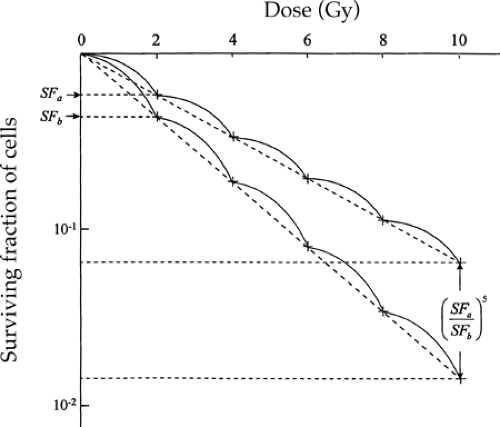
produces an equal proportionate reduction in cell survival. Consequently, the “effective” survival curve for a series of equally effective dose fractions is linear with dose (Fig. 6.4). The slope of the effective survival curve reflects the shape of the shoulder of the survival curve. If it is very curvy (a low α/β ratio), there is a much greater change in survival with change in size of dose per fraction. This is illustrated by the large effect on the relative responses of the two theoretical cell populations (acute and late) shown in Fig. 6.3. If the dose per fraction is halved, from B to A, the killing of cells in the late-responding cell population changes from being greater to being less relative to that in acutely responding tissues. As a result, the reduction in severity of response, or the “sparing” effect from fractionating a dose, is much greater in tissues with a low α/β ratio. This effect is important in achieving a favorable differential between late-responding tissues, which characteristically have low α/β ratios, and tumors, the more proliferative of which have high α/β ratios (10,11,13).
produces an equal proportionate reduction in cell survival. Consequently, the “effective” survival curve for a series of equally effective dose fractions is linear with dose (Fig. 6.4). The slope of the effective survival curve reflects the shape of the shoulder of the survival curve. If it is very curvy (a low α/β ratio), there is a much greater change in survival with change in size of dose per fraction. This is illustrated by the large effect on the relative responses of the two theoretical cell populations (acute and late) shown in Fig. 6.3. If the dose per fraction is halved, from B to A, the killing of cells in the late-responding cell population changes from being greater to being less relative to that in acutely responding tissues. As a result, the reduction in severity of response, or the “sparing” effect from fractionating a dose, is much greater in tissues with a low α/β ratio. This effect is important in achieving a favorable differential between late-responding tissues, which characteristically have low α/β ratios, and tumors, the more proliferative of which have high α/β ratios (10,11,13).
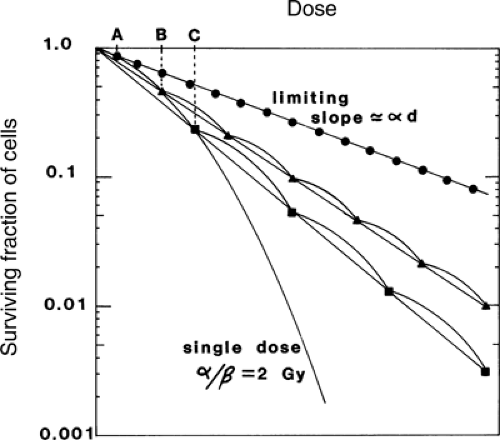 FIGURE 6.4. Multifraction dose–survival curves compared with a single-dose curve. Effective survival curves for multifraction regimens that produce an equal (proportionate) decrement in survival from each dose are linear, with shallower slopes than the single-dose curve. Slopes of the multifraction curves become less steep with decrease in fraction size until the dose per fraction is so low that multihit killing contributes negligibly and the slope is the limiting one determined by single-hit killing. The dose per fraction below which the effective survival curve becomes no shallower is a function of the efficiency of repair of sublethal injury and the curvedness of the single dose–survival curve, and, for convenience, it can be assumed to be approximately one-tenth of the α/β value. Source: Reprinted from ref. 27, with permission. |
The potential value from dividing a total dose into multiple smaller fractions (as shown by the curves in Fig. 6.4) is greater than it first appears from the single dose–survival curves. Although the difference in cell survival within the shoulder may be relatively small, it is amplified exponentially, as a power function of the number of dose fractions delivered (Fig. 6.5). In practice, the amplification of small differences continues beyond that from 5 fractions because curative treatments commonly involve 30 to 35 fractions, or even as many as 70 in a hyperfractionated regimen. For example, if survival from a daily dose of 2 Gy were 55% in one population of cells and 45% in another, then the ratio of survival after 35 fractions of 2 Gy (a common prescription in attempting curative treatment by x-irradiation alone) would be (55/45)35 = 1,122, that is, more than three decades on a logarithmic scale.
Dose Fractionation and Therapeutic Index
Radiation therapy given for cure is almost always delivered in multiple small-dose fractions, not single doses. The advantages of this in widening the therapeutic index are ascribed to the four Rs: repair of sublethal injury, redistribution of cells within the division cycle between dose fractions, repopulation by surviving cells over the course of treatment, and reoxygenation of tumor cells during fractionation intervals.
