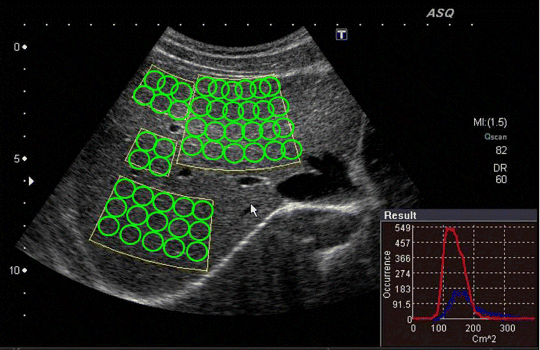
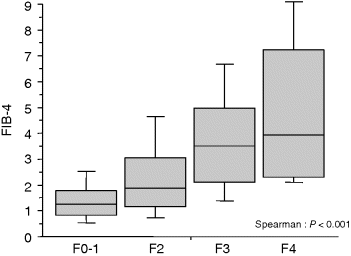
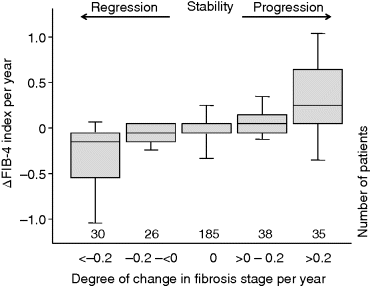
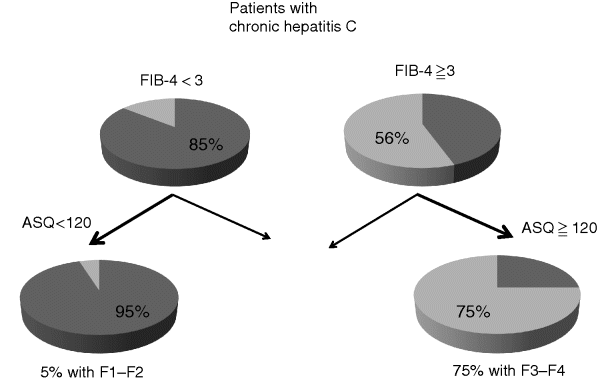
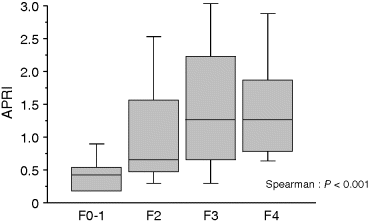
Chapter 5 Namiki Izumi,1 Nobuharu Tamaki,1 Yasuhiro Asahina,2 and Masayuki Kurosaki1 1Department of Gastroenterology and Hepatology Musashino Red Cross Hospital Tokyo Japan 2Department of Hepatitis Investigation Tokyo Medical and Dental University Tokyo Japan Cirrhosis is derived from advanced fibrosis of the liver caused by hepatitis B or C virus infection, autoimmune liver disease, alcoholic or metabolic disorders. To prevent the development of cirrhosis, it is important to be able to predict the degree of the fibrosis of the liver and prevent its progression. Recently, remarkable progress has been made in estimating the degree of hepatic fibrosis and in understanding the importance of a single-nucleotide polymorphism involved in the progression of fibrosis. Understanding the mechanism of fibrogenesis is fundamental to preventing the progression to cirrhosis. Liver fibrosis arises from a variety of factors including hepatitis B and C viruses (HBV and HCV), autoimmunity, alcohol, and metabolic abnormalities such as steatosis [1]. The degree of fibrosis is assessed by liver biopsy, and classified according to international standards [2]. The mechanism of development of fibrosis differs for HBV and HCV and a frequent problem that needs to be addressed is how to assess liver fibrosis without the need for a liver biopsy. Fundamentally, in both HBV and HCV infections, fibrosis develops in areas of necrosis. Differences between these mechanisms of fibrosis were analyzed and when phospho-Smad 2 staining was performed, a correlation between the amount of staining and the stage of fibrosis was observed in steatosis, steatohepatitis, and hepatitis B, but no such relationship was found for hepatitis C. On the other hand, interleukin 13 (IL-13) immunostaining was correlated with the stage of fibrosis in steatosis, steatohepatitis and in hepatitis C, while there was no such relationship with hepatitis B [3]. This is believed to illustrate one of the differences in the mechanisms of fibrosis. Transforming growth factor β (TGF-β) and IL-13 signaling differs depending on the cause of the liver fibrosis: TGF-β1 predominance is associated with HBV-related liver fibrogenesis, while IL-13 predominance is detected in HCV infection. In addition, an increase in natural killer T cells was seen in a study of HBV using transgenic mice and this is considered to be the mechanism that triggers the activation of fat-storing cells (FSCs) in the liver, leading to liver fibrosis [4]. On the other hand, there are numerous reports of liver fibrosis arising from HCV infection. It has been shown that HCV produces reactive oxygen species, inducing TGF-β1 and causes liver fibrosis to occur [5]. It also has been shown by a meta-analysis that steatosis is an independent risk factor for liver fibrosis in cases of HCV infection [6]. In nonalcoholic steatohepatitis and HCV infection, hepatic insulin signaling is impaired and downregulation of insulin-sensitive targets is observed; this has been shown to be associated with apoptosis and fibrogenesis [7]. In an Asian study, hepatic fibrosis was also found to be associated with insulin resistance based on a homeostatic model assessment of insulin resistance in infections with HCV genotypes 2 and 3 [8]. In HCV infection, 25-hydroxyvitamin D blood levels are low and cytochrome P27A1, a liver 25-hydroxylating enzyme, correlates with 25-hydroxyvitamin D serum levels, which are said to be associated with liver fibrosis [9]. FibroScan, a transient elastography tool developed and produced by Echosens (Paris, France), was introduced in 2005 as a method for assessing the progression of liver fibrosis [10]. This method uses a thin cylindrical probe placed close to the liver to send a 1-period 50-Hz shear wave through the surface of the body to the liver and measure the propagation velocity [11]. Later, advances were made with the development of devices that measure liver stiffness using abdominal ultrasound. Virtual Touch Tissue Quantification (VTTQ) developed by Siemens AG (Munich, Germany), is a method for measuring tissue stiffness from a shear wave generated by an acoustic radiation force impulse (ARFI) with a 300-μs push pulse and measurement of the propagation velocity [12,13]. Acoustic Structure Quantification (ASQ) (Toshiba, Tokyo, Japan) was established from echogenicity distribution within the region of interest of the liver, a mean value was calculated, and expressed as liver stiffness. An example of measurement of liver stiffness using ASQ is shown in Figure 5.1. Figure 5.1 Measurement of liver stiffness using acoustic radiation force impulse. The region of interest is established by abdominal ultrasound and the stiffness of this site can be measured. Although the gold standard for the diagnosis of liver fibrosis is liver biopsy, there are associated risks of complications and it cannot be repeatedly performed. Sampling errors and diagnostic mistakes by pathologists also are problematic [14,15]. Measuring liver stiffness is one way to resolve these problems. The relationship between liver fibrosis and HCV can be shown with the FibroScan tool, which can be used to diagnose F3 and F4 advanced cases of fibrosis [16]. However, liver stiffness measurements are uninterpretable in nearly one in five cases because of obesity, increased waist circumference, or operator inexperience [17]. Links to liver fibrosis have been reported for the results of blood tests that can be clinically measured. For example, links between the aspartate aminotransferase : alanine aminotransferase (AST : ALT) ratio [18] and AST : platelet ratio index [19,20] and liver fibrosis have been observed and are reported to be clinically useful. The FibroTest blood marker test (BioPredictive, Paris, France), a combination of basic serum markers such as α2-globulin, gammaglobulin, and apolipoprotein, has been reported to be useful for inferring liver fibrosis [21,22]. On the other hand, the FIB-4 index, which is calculated based only on age, AST, ALT, and platelet counts measured by general clinical laboratory tests, is reportedly useful for reflecting advanced F3–F4 liver fibrosis: when the FIB-4 score is less than 1.45, the negative predictive value for F3–F4 is 90% and when the FIB-4 score is greater than 3.25, the positive predictive value for F3–F4 is 80% [23,24]. It has been shown that these noninvasive markers of liver fibrosis are useful for predicting liver-related mortality [25] and the occurrence of hepatocellular carcinoma [26]. The FIB-4 index was evaluated in patients who underwent liver biopsy and a positive correlation was noted as shown in Figure 5.2. However, there is overlap among F2, F3, and F4. When we investigated the relationship between FIB-4 and the progression of liver fibrosis in patients with chronic HCV infection who had undergone two or more liver biopsies, we found a good correlation and therefore believe that this is a good index for estimating prognosis and evaluating the therapeutic effect of interferon (Figure 5.3) [27]. On the other hand, APRI score, which is calculated as (AST/ULN)/platelet (109/L) was shown to correlated with the fibrosis stage, but there are overlaps between F3 and F4 (Figure 5.4). Figure 5.2 The relationship between FIB-4 index score and liver fibrosis in patients with chronic hepatitis C virus infection who had undergone two liver biopsies. (Tamaki et al. 2012 [27]. Reproduced with permission of John Wiley & Sons.) Figure 5.3 The relationship between FIB-4 and the progression of liver fibrosis in patients with chronic hepatitis C virus infection who had undergone two or more liver biopsies. There was a good correlation and FIB-4 is likely to be a good index for estimating prognosis and evaluating the therapeutic effect of interferon (Tamaki et al. 2012 [27]. Reproduced with permission of John Wiley & Sons.) Figure 5.4 The relationship between aspartate aminotransferase : platelet ratio index (APRI) score and liver fibrosis in patients with chronic hepatitis C virus infection. There is overlap between F3 and F4. Figure 5.5 Diagnostic algorithm for advanced fibrosis with F3 and F4 by FIB-4 index and Acoustic Structure Quantification (ASQ). Seventy-five per cent of patients with a FIB-4 index of 3 or greater, and ASQ score of 120 or greater, were estimated to have the stage of F3–F4 fibrosis. Only 5% of patients with a FIB-4 index below 3 and ASQ score less than 120 were predicted to have the advanced fibrosis at stage of F3–F4. Thus, fibrosis stage was estimated with 89% accuracy in 53% of the patients with chronic hepatitis C without liver biopsy.
Fibrosis and Fibrogenesis
Introduction
Mechanism of Liver Fibrosis in Hepatitis B and C
Diagnosis of Liver Fibrosis by Imaging
Diagnosis of Liver Fibrosis by Laboratory Tests
Stay updated, free articles. Join our Telegram channel

Full access? Get Clinical Tree


