Clinical Importance of Nephron Mass


Clinical Importance of Nephron Mass


Valerie A. Luyckx

Thomas F. Mueller


INTRODUCTION

The relationship between renal salt handling, intravascular volume homeostasis, and hypertension is well established, which points to the kidney as the central organ in the development of hypertension.1 Based on the concept of developmental programming, where an environmental stimulus experienced during a critical period of early development can induce long-term structural and functional adaptive changes in the developing organism, Brenner et al. proposed that a low nephron number, acquired during fetal life, may predispose an individual to hypertension and renal disease.2,3 This hypothesis was attractive because low birth weight, a marker of an adverse intrauterine environment, if associated with a congenital reduction in nephron number, could potentially explain the variability in hypertension and renal disease prevalence observed among populations of different ethnicity where those with lower birth weights tend to have a higher burden of renal disease.4,5,6,7 The initial hypothesis suggested that a kidney with fewer nephrons would have a reduced filtration surface area with a limited capacity to excrete sodium, thereby contributing to the development of hypertension. Although this “nephron number” hypothesis was initially quite controversial, and with time has proved to be not entirely this straightforward, the association between nephron number and predisposition to hypertension and renal disease has been borne out in many animal experiments and human studies.8,9,10,11,12 In this chapter we put forward the existing evidence comprising animal and human studies, which link nephron mass, birth weight, and other clinical variables with clinical outcomes. Extrapolation from animals to humans has many limitations and, therefore, where possible we have included human studies to corroborate or refute animal findings. Although this field has grown significantly within the last decade and many questions remain unanswered, a clearer and consistent picture is emerging that shows nephron mass does have clinical importance.

An individual’s nephron mass is determined by a complex interplay between genetics and environment, evolving throughout their lifetime, bearing the imprint of their past, being reflected in their present, and affecting their future risk of hypertension and renal disease. Although traditionally it has been thought that all kidneys have about 1 million nephrons, recent studies have found that total glomerular number varies up to 13-fold in human kidneys, much more, for example, than height or weight (Table 2.1).13 The terms “nephron endowment,” implying number of nephrons present upon completion of nephrogenesis; “nephron number,” implying the number of intact nephrons at the time of measurement; and “glomerular number,” including the number of tubular and atubular glomeruli, have all been used interchangeably.13 In this chapter we use the term “nephron number” more generally to describe the total number of nephrons in a kidney at the time of discussion. The term nephron mass is used more broadly as a clinical term to incorporate nephron number, kidney weight, kidney size, and kidney volume. A discussion of the importance of acquired reduction in nephron mass in later life is beyond the scope of this chapter.


DEVELOPMENTAL DETERMINANTS OF NEPHRON NUMBER


Low Nephron Number

Kidney development in humans proceeds from the 9th to the 36th week of gestation.9,14 Accurate determination of nephron number is difficult because nephron number cannot be determined in humans in vivo. The unbiased fractionatorsampling/dissector method is thought to be the most objective nephron counting method, and is currently utilized in most human studies.15,16 This method, however, requires postmortem kidney samples and is very labor intensive. An in vivo glomerular counting method comparing the fractionator technique with a combined renal biopsy/magnetic resonance imaging (MRI) method in explanted canine kidneys has been attempted.17 This study found a good correlation of glomerular number on average between the two methods, but, within kidneys, there was a 36% variance, calling individual applicability into question. Large-scale human
studies of nephron number and association with phenotype are therefore not easily feasible.


TABLE 2.1 Nephron Numbers in Humans


Reference


Population


Sample Size


Mean


Range


Fold


Nyengaard and Bendtsen


Danish


37


617,000


331,000-1,424,000


4.3


Merlet-Benichou et al.a


French


28


1,107,000


655,000-1,554,000


2.4


Keller et al.


German


20


1,074,414


531,140-1,959,914


3.7


Hypertensive


10


702,379


531,104-954,893


1.8


Normotensive


10


1,429,200


884,458-1,959,914


2.2


Douglas-Denton et al.


African Americans


105


884,938


210,332-2,026,541


9.6


White Americans


84


843,106


227,327-1,660,232


7.3


Hoy et al.


Australian non-Aborigines


21


861,541


380,517-1,493,665


3.9


Australian Aborigines


19


713,209


346,161-1,129,223


3.1


McNamara et al.b


Senegalese


47


992,353


536,171-1,764,241


3.3


Hoy et al.


African and white Americans, Australian Aborigines, and non-Aborigines and Senegalese


420


901,902


210,332-2,702,079


12.8


a Used acid maceration technique. All other studies used unbiased stereology.

b Values for 47 participants were combined from two publications.


Reprinted with permission from Puelles VG, Hoy WE, Hughson MD, et al. Glomerular number and size variability and risk for kidney disease. Curr Opin Nephrol Hypertens. 2011;20:7-15. See original manuscript for detailed references.


Average nephron number has been reported to range from 617,000 (range 331,000-1,424,000) to 1,429,200 (range 884,485-1,959,914) per kidney among normal adult Caucasian Europeans.10,18 Other studies including subjects of multiple ethnic origins from the United States, Africa, and Australia showed somewhat similar results, with a mean number around the mid 800,000 glomeruli per kidney, with a very wide range, from 210,332 to 2,702,079 as shown in Table 2.1.13 The range appears widest in kidneys from subjects of African origin.13,19 In general, nephron numbers are lower in older subjects, attributed to age-related glomerulosclerosis and obsolescence.18,20 Whether the high variability in nephron number across populations reflects true differences or is confounded by small sample sizes or limitations of counting methods will become clearer with time as more studies accumulate or as better techniques evolve.

Various animal models have been used to study the impact of developmental programming on nephrogenesis. The details and pathophysiology of these models, and mechanisms whereby nephron numbers are reduced, are beyond the scope of this chapter and are outlined in detail elsewhere.8,21,22 Extrapolating from the animal studies, from a clinical point of view, the factors associated with development of low nephron number can be divided into two groups: modifiable and nonmodifiable, as outlined in Table 2.2.


Modifiable Factors

Modifiable factors associated with low nephron number include prenatal events—factors occurring during gestation and postnatal events occurring in the neonate.

Prenatal Factors. Maternal diets deficient in protein, total calories, or iron have all been shown to reduce nephron numbers in offspring of experimental animals, most often in association with low birth weight.12,23,24,25,
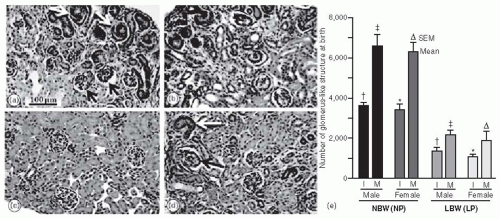
26 Figure 2.1 shows a reduction in nephron numbers in low birth weight rats that were subjected to maternal low protein diets during gestation. Maternal dietary deficiencies are common in pregnant mothers in developing countries and therefore likely clinically relevant in a large proportion of the world.27 Maternal vitamin A deficient diets are associated with a dose-dependent reduction in nephron number in animals.28
Vitamin A deficiency was examined in a cohort of Indian compared to Canadian mothers and found to be associated with significantly smaller newborn renal volume, which the authors suggest likely reflects lower nephron number.29 Retinoic acid, the active metabolite of vitamin A, functions as a transcription factor regulating expression of Ret, a tyrosine kinase receptor critical for kidney development.30 Interestingly, vitamin A levels are reduced by smoking and alcohol intake, both known to reduce birth weight.31 Uteroplacental insufficiency, induced by uterine artery ligation late in gestation, also results in low offspring birth weight and low nephron number.32,33 This model may share some similarities with preeclampsia in humans in terms of the reduction of uterine blood flow and the restriction of fetal nutrient supply.


TABLE 2.2 Factors Associated with Charges in Nephron Number and Kidney Size


REDUCED NEPHRON NUMBERS OR KIDNEY SIZE


Timing


Condition


Source of Data


Effect on Nephron Number (NNx)/Kidney Size


References


Prenatal, modifiable


Maternal low protein diet or total calorie restriction


Animal


↓ NNx, 16%-40%


12,246


Maternal vitamin A restriction


Animal


↓ NNx, in proportion to reduction in vitamin A


28,29


Human


Small infant kidney size


Maternal iron restriction


Animal


↓ NNx, 22%


25


Gestational glucocorticoid exposure


Animal


↓ NNx, 20%-38%


37,180


Uterine artery ligation/embolization


Animal


↓ NNx, 20%-30%


81


Maternal diabetes/hyperglycemia


Animal


↓ NNx, 10%-35%


50,51,247


Gestational drug exposure


Animal


▪ Gentamicin


↓ NNx, 10%-20%


40,41,42,43,44,45,248


▪ β lactams


↓ NNx, 5%-10%


▪ Cyclosporine


↓ NNx, 25%-33%


Ethanol


↓ NNx, 10%-20%


▪ COX2 inhibitors


↓ NNx


▪ Indomethacin


↓ NNx


Prenatal, nonmodifiable


Genetics


RET(1476A) polymorphism


Human


10% ↓ newborn kidney volume


63,64


PAX2 AAA haplotype


Human


10% ↓ newborn kidney volume


Prematurity


Human


NNx ↓ with gestational age, limited post natal nephrogenesis


Reduced kidney size in growth restricted children


54,69,132


Postnatal


Nutrition


Animal


NNx ↓ with postnatal nutrient restriction alone


32


Renal failure


Human


? cause or consequence of NNx ↓


54


NORMALIZATION OR INCREASE IN NEPHRON NUMBER


Timing


Condition


Source of Data


Effect on Nephron Number (NNx)/Kidney Size


References


Prenatal


Maternal vitamin A supplementation


Animal


Normalization of NNx in LPD model


82


Maternal amino acid supplementation


Animal


Normalization of NNx in LPD model


24


Ouabain administration


Animal


Normalization of NNx in LPD model


84


Maternal uninephrectomy


Animal


NNx ↑


88,89


Genetics


ALDH1A2rs7169289(G) allele


Human


22% ↑ newborn kidney size


83


Postnatal


Reinstitution of good nutrition


Animal


Catch-up of NNx in LPD model


81


Overfeeding


Animal


NNx ↑ in normal birth weight rats


152


↑, increase; ↓, decrease; ?, unknown.


Adapted from Luyckx VA, Brenner BM. The clinical importance of nephron mass. J Am Soc Nephrol. 2010;21:898-910.


FIGURE 2.1 Relationship between glomerulogenesis, nephron number,and birth weight in rats subjected to maternal normal (NP) or low (LP) protein diets. Renal cortex at days 0 (d0) and 10 (d10) in rat offspring of NP-fed dams (normal birth weight, NBW) and LP-fed dams (low birth weight, LBW). (a) Normal glomerulogenesis in NBW offspring at d0, with comma-shape structure (immature renal corpuscle, white arrow) and inner vascularized structure (mature renal corpuscle, black arrow); (b) LBW d0 with fewer corpuscular structures and moderately dilated tubules; (c) NBW d10 showing only mature renal corpuscles; (d) LBW d10 showing immature and mature renal corpuscles; and (e) number of glomerulus-like structures (immature [I] and mature [M]) measured in NBW and LBW offspring (n = 5 per group). Symbols indicate group comparisons, P <0.05. (Reprinted with permission from Villar-Martini VC, Carvalho JJ, Neves MF, et al. Hypertension and kidney alterations in rat offspring from low protein pregnancies. J Hypertens Suppl. 2009;27:S47-51.)


Increased fetal glucocorticoid exposure is a likely mechanism whereby maternal low protein diet reduces nephron number, via reduced activity of placental 11β-hydroxysteroid dehydrogenase activity, shown in both animals and humans.34,35 Similarly, administration of glucocorticoids during gestation in rats and sheep leads to reduced nephrogenesis, although this effect was not seen in the Marmoset monkey.36,37,38 Glucocorticoids are thought to reduce nephron number by impacting ureteric bud invasion of the metanephric mesenchyme, thereby limiting branching morphogenesis.8 The impact of maternal glucocorticoid utilization during pregnancy on human nephrogenesis is not known. Ingestion of other medications during pregnancy may also impact nephrogenesis in many ways.39 Gestational administration of aminoglycosides, beta lactams, cyclosporine, cyclooxygenase inhibitors, and nonsteroidal anti-inflammatory drugs have all been associated with reduced nephron number in experimental models.39,40,41,42,43 Similarly, chronic and acute gestational exposure to alcohol impairs embryonic ureteric bud branching, resulting in fewer nephrons in offspring.44,45 In humans one abstract suggested an impact of maternal alcohol consumption on kidney development in Australian Aboriginal children.9

Conceivably, therefore, all of these prenatal experimental conditions may impact human nephrogenesis and minimization of these exposures prior to and during pregnancy would optimize fetal nephrogenesis. The timing of an insult during gestation is also relevant to its impact on nephrogenesis, with the greatest effect in animals generally seen with interventions in the latter half of gestation.8

Maternal factors also impact fetal development during gestation. Low birth weight is associated with multiple maternal factors although nephron number has not specifically been examined in most cases.46,47 Manalich et al. found a strong correlation between low birth weight and low nephron number in a cohort of Cuban newborns.48 Maternal hypertension and maternal smoking were correlated with low birth weight, although direct correlation with nephron number was not reported. In experimental animals, maternal diabetes or hyperglycemia has been shown to result in approximately 30% lower offspring nephron number in some, but not all, studies, although differences in methods of nephron number counting may account for some of the variability.49,50,51 In other studies, maternal diabetes was associated with smaller kidneys, higher blood pressures, microalbuminuria, and reduced glomerular filtration rates in rat offspring.51,52 In young adults, renal functional reserve was found to be reduced in those who had been exposed to maternal diabetes during gestation, compared to those with paternal diabetes (i.e., excluding a genetic component), or those with nondiabetic parents.53 The reduced renal functional reserve was interpreted by the authors as a possible surrogate for a reduced nephron number acquired in utero in the offspring of diabetic mothers.

Postnatal Factors. Although nephrogenesis is thought to be complete at birth in humans, this may not be the case for babies born prematurely, and therefore a window in which nephrogenesis may still be vulnerable likely exists soon after birth in these infants.54 Consistent with this possibility, early postnatal growth restriction alone in normal birth weight rats was associated with a reduction in nephron number, demonstrating the importance of early postnatal nutrition on nephrogenesis.32 The relevance of these findings to the human, however, is questionable because nephrogenesis normally proceeds for 10 days after birth in rodents and therefore this period is analogous to late gestation in humans. These data may, however, have relevance to humans born prematurely. Indeed, in a cohort of children born either very low birth weight (<1,000 g) or premature (<30 weeks gestation), extrauterine growth restriction was associated with significantly lower glomerular filtration rates at a mean of 7.6 years of age, suggesting an impact of postnatal nutrition on renal development.55 Another study of postmortem kidneys from premature infants who died after 40 days of life found glomerular number to be significantly lower in those who developed renal failure compared to those who did not. These findings may suggest that renal failure itself inhibits glomerulogenesis; however, it is also possible that fewer glomeruli made these extremely ill infants more susceptible to renal failure. In another cohort of critically ill premature infants, renal failure was a significant complication and associated with a high mortality, although not associated with birth weight.56 In contrast, another study did find neonatal acute kidney injury to be an independent predictor of mortality in very low birth weight infants.57 Prematurity itself is a recognized risk for renal failure in infants, and has been shown to be associated with increased risk of subsequent hypertension and chronic kidney disease (CKD).58 Taking these human studies together, postnatal events do impact renal development in premature infants and may have potentially adverse short- and long-term consequences.


Nonmodifiable Factors

Nonmodifiable factors also impact nephrogenesis, and may occur in isolation or together with other potentially modifiable factors described previously (Table 2.2).

Genetics. Rare congenital and genetic abnormalities associated with abnormal kidney development manifest with renal dysfunction, often presenting very early in life.11,59 Approximately 40% to 60% of childhood end-stage renal disease (ESRD) results from some form of congenital renal hypoplasia.60 More subtle renal developmental abnormalities—which may not manifest as overt syndromes but, rather, with later life renal dysfunction—may well be the result of gene polymorphisms impacting nephron number. Renal hypoplasia and reduced nephron number have been described with full or partial deletion of over 25 genes in mice, which are reviewed in detail elsewhere.13,21,61 The important steps in kidney development
include specification of the metanephric blastema from the intermediate mesoderm, formation of the ureteric bud and its outgrowth from the wolffian duct, and ureteric bud branching. Genes participating in specification of the metanephric blastema from the intermediate mesoderm include Odd-1, Eya 1 Pax 2, Wt-1, Six 1, Gdnf, and Sall 1, of which Odd-1 and Eya-1 are critical.21,60 Genes regulating formation of the ureteric bud and its outgrowth from the wolffian duct include Pax2, Liml, Bmp4, and Gdnf.21,60 Gdnf (glial cell-derived neurotrophic factor) signals through the Gfrα1 receptor and the c-Ret receptor tyrosine kinase and, during branching, morphogenesis is only expressed on the tips of ureteric branches, selectively inducing branching at this location.21 Among the most important pathways impacting nephrogenesis, therefore, are Gdnf/Ret and Pax2. In mice, deletion of Gdnf and c-Ret leads to renal agenesis or severe hypoplasia.21,60 Deletion of Pax2, the “master organizer” of renal development, is incompatible with life.60 The impact of genetic polymorphisms in these pivotal genes has been studied in humans. Haploinsufficiency of the PAX2 gene causes the autosomal dominant renal coloboma syndrome, associated with significant reduction in nephron number and “oligomeganephronia.”60,62,63 Taking this finding further, looking for a more subtle impact in the wider population, Quinlan et al. found that the common AAA haplotype of PAX2, present in 18.5% of newborns in a Canadian cohort, was associated with reduced allele-specific mRNA expression in vitro, and a 10% reduction in newborn kidney volume, compared with the GGG haplotype.63 Similarly, a polymorphic variant of RET, RET(1476A), was also associated with reduced mRNA synthesis, an almost 10% reduction in kidney volume, and higher levels of the renal function marker cystatin C at birth compared with the RET(1476G) variant in Caucasian newborns.64 These authors found that newborn kidney volume is proportional to nephron number, therefore PAX2 and RET polymorphisms are likely associated with reduced nephron number in humans.64 Among 15% of Caucasians inheriting both alleles, newborn kidney sizes were 23% smaller.65 Surprisingly, however, none of 19 common GDNF gene variants or three single nucleotide polymorphisms related to a putative GDNF-PAX binding site were associated with small kidney size among 163 Caucasians newborns.65 One rare coding GDNF variant (R93W) was not found in any subject and therefore, the clinical impact of this potential mutation is not known.65 These early and small studies suggest that genetic polymorphisms in genes that are critical in nephrogenesis may contribute to the wide spectrum of nephron number found in the general population.

Prematurity. Unlike in rodents, postnatal nephrogenesis does not occur in humans, except in extremely premature infants; therefore, nephron number is predominantly determined in utero. Rodriguez et al. examined kidneys from 56 extremely premature infants compared with 10 full-term infants at autopsy.54 Radial glomerular counts were lower in premature compared with full-term infant kidneys and glomerular number correlated with gestational age, as has been reported previously.54,66 In addition, they found evidence of active glomerulogenesis (indicated by the presence of basophilic S-shaped bodies under the renal capsule in kidneys) in premature infants up to, but not beyond, 40 days of life.54 This was the first study to demonstrate ongoing nephrogenesis in humans postnatally. Similarly, in preterm baboons, nephrogenesis was found to continue after birth and nephron number was within the normal range; however, there was a greater proportion of abnormal glomeruli in the superficial cortex compared to full-term controls, suggesting compromised nephrogenesis after premature birth.67 In contrast, Hinchliffe et al. did not find an increase in nephron number in growth restricted infants who died as stillbirths at varying gestations, or at 1 year of age, suggesting a lack of nephrogenesis after birth.66,68 Gestational age was found to correlate with nephron number, which reached a maximum around 36 weeks.69

Gender. Gender likely plays a complicated role in developmental programming. In the largest series of kidneys analyzed to date, glomerular number in adult females was found to be reduced by up to 12% compared to males.13,70 In a cohort of Cuban newborns, however, nephron number was not affected by gender.48 In experimental models, reviewed in detail elsewhere, males generally tend to be more severely affected than females in terms of reduction in nephron number, as well as subsequent manifestation of hypertension and renal dysfunction.71,72 These differences may in part result from differences in postnatal growth rates between males and females, gender-specific differences in adaptation to adverse events, and gender-specific regulation of genes and pathways impacting renal development, function, and hypertension.33,72 Similarly, a large study in humans found an association of CKD with low birth weight in adult males, but not in females, suggesting a possible impact of gender on subsequent disease expression, although mechanisms are not yet clear.73

Ethnicity. Hoy and colleagues have shown a reduction in nephron number among Aboriginal compared with non-Aboriginal Australians (Table 2.1).70 Among African Americans and Caucasian Americans, nephron number was not significantly different in both groups and correlated with birth weight, although the distribution appeared to be more bimodal in the African American cohort.74 No low birth weight subjects were included in this study, but low birth weight is more prevalent among African Americans; therefore, in the general U.S. population, a greater proportion of African Americans may have lower nephron number. This remains to be studied. Nephron number among Senegalese Africans and African Americans was similar.75 Among Cuban neonates, nephron number was again not different between black compared with white subjects.48 To our knowledge kidneys of subjects from other ethnic groups have not been studied. Ethnicity, therefore, may have an impact on nephron number, although it is difficult to dissect out an impact independent of its association with birth
weight, socioeconomic factors, genetic polymorphisms, and many other potential confounders.

Intergenerational Factors. Among both white and African American women, mothers who had been of low birth weight had a significantly increased risk of having low birth weight offspring, independent of economic environment, suggesting a cross-generational effect of maternal low birth weight.76 Similarly maternal, but not paternal birth weights, were associated with offspring birth weight, arguing for an intergenerational programming effect of the maternal environment.77 Interestingly, in a large population-based study, mothers experiencing preeclampsia, especially when associated with premature birth and low birth weight in the offspring, are at increased risk of subsequent need for renal biopsy and/or ESRD.47,78 A reduced maternal glomerular filtration rate (GFR) <90 mL per minute and hypertension are significant risk factors for preeclampsia, small for gestational age infants, and premature delivery.79 The question arises why the mother herself may have been predisposed to these adverse pregnancy-related and renal outcomes. It is conceivable that a vicious cycle may occur where a low birth weight mother would be predisposed to programmed adverse pregnancy outcomes, in turn impacting fetal nephrogenesis and thereby future pregnancy outcomes and renal health of the subsequent generations. To our knowledge this specific association has not been studied in humans. In rats, the first generation offspring of mothers fed low protein diets during gestation had low birth weights, low nephron number, and developed spontaneous hypertension at 8 weeks of age. Offspring of these first generation females, although maintained on normal diets throughout gestation, also exhibited low nephron number and hypertension, demonstrating intergenerational programming.80 Interestingly the effect was lost by the third generation, suggesting that the intergenerational cycle can be interrupted by optimization of risk factors such as maternal nutrition.


Strategies for Augmentation of Nephron Number

Although total filtration surface area in individuals with fewer nephrons may not be reduced, as a result of compensatory hypertrophy of the existing nephrons (see later), low nephron number is still associated with an increased risk of hypertension and renal dysfunction in later life. Strategies to optimize nephron number may therefore have an important impact on clinical disease (Table 2.2). Interventions would likely need to be applied during gestation to have an optimal effect. Ideally, optimization of all modifiable risk factors prior to pregnancy would appear the simplest and most widely applicable intervention. Clinically feasible interventions are being studied to potentially “rescue” nephron number and reduce subsequent hypertension.


Postnatal Nutrition

Provision of adequate postnatal nutrition in low birth weight rat pups, achieved by cross-fostering onto normal lactating females at birth, led to restoration of nephron number and prevented the development of subsequent hypertension compared to pups with continued growth restriction.81


Vitamin A Supplementation

Because vitamin A deficiency is associated with a nephron deficit, administration of a single dose of retinoic acid during early nephrogenesis restored nephron number to control levels in rat pups exposed to low protein diet in utero.82 Postnatal administration of retinoic acid to preterm baboons, however, was not able to stimulate nephrogenesis compared to preterm controls, suggesting a more proximal window for the effect of vitamin A on nephrogenesis, although these results may have been confounded by routine antibiotics given to all animals, which may have negatively impacted nephrogenesis, confounding a potentially small vitamin A effect.30


Genetics

In a cohort of Caucasian newborns, a common variant of the ALHD1A2 gene involved in retinoic acid metabolism, ALHD1A2rs7169289(G), was associated with a 22% increase in newborn kidney size, and higher cord blood retinoic acid levels, compared to the wild-type ALDH1A2 rs7169289(A) allele.83 These authors suggest this gene polymorphism could be protective for nephrogenesis in the setting of vitamin A deficiency.


Prevention of Low Nephron Number

The ubiquitous plasma membrane protein Na+/K+-ATPase functions as an ion pump as well as a signal transducer. Ouabain is a highly specific Na+/K+-ATPase ligand that triggers the release of calcium waves, which are important regulators of early development.84 Interestingly, erythrocyte membrane Na+/K+-ATPase activity was found to be reduced in a cohort of low birth weight males at age 20, making this a potentially relevant pathway.85 The impact of ouabain administration was studied experimentally as a modulator of nephrogenesis under protein-deficient conditions in vitro and in vivo.86 Ouabain was found to abrogate the effect of serum starvation on ureteric bud branching in cultured metanephroi, and to prevent reduction in nephron number in offspring of low protein diet-fed dams.84 The ouabain was administered throughout pregnancy in this study and, therefore, the potential of ouabain to rescue or restore nephron number once an adverse event is already established has not been studied. Similarly, supplementation of maternal diet during gestation with glycine, urea, or alanine prevented the reduction in nephron number induced by maternal low protein diet in all offspring, but blood pressure was only normalized in those receiving glycine.24 Interestingly, nephron number in the offspring of mothers subjected to water restriction during gestation was increased, but also did not abrogate development of subsequent hypertension—again suggesting possible divergent programming mechanisms for nephron number and blood pressure in some models.87


Maternal Nephrectomy

Uninephrectomy in rat mothers prior to pregnancy has been associated with an increase in offspring nephron number at birth; however, at 6 weeks, nephron numbers were not different from offspring of nonnephrectomized dams.88,89 These authors suggest a possible circulating renotrophic factor in response to maternal uninephrectomy, possibly inducing hypertrophy of the contralateral kidney, which may accelerate nephrogenesis in the fetus but may not affect ultimate nephron number. These observations may be relevant in human cases such as maternal renal transplantation or maternal kidney donation, although timing of pregnancy in relation to nephrectomy may be an important variable. This area deserves more investigation.


CLINICAL SURROGATES FOR NEPHRON NUMBER

In vivo, nephron number can only be grossly estimated by MRI or kidney biopsy.18,70,90 Associations of nephron number with readily available clinical variables have been described and are outlined in Table 2.3.


TABLE 2.3 Clinical Surrogates for Low Nephron Number


Clinical Feature


Association with Nephron Number


Population


Reference


Low birth weight


↑ of 257,426 glomeruli per kg increase in birth weight


U.S. white and black, children and adults


19


Prematurity


↓ glomerular number in premature compared to term infants


U.S. premature and full term neonates


54,68


Gender


Nephron number is 12% lower in females


U.S. white and black Aboriginal Australian


70


Age


↓ 3,676 glomeruli per kidney per year of age >18 years


U.S. white and black Aboriginal Australian


70


Adult height


↑ 28,000 glomeruli per centimeter increase in height


Australian Aboriginal German, white


10,70


Kidney mass


↑ 23,459 glomeruli per gram of kidney tissue


Infants <3 months of age


64


Glomerular volume


Inverse correlation between glomerular volume and nephron number


U.S. white and black Aboriginal Australian German adults, Cuban infants


10,13,48


Ethnicity


↓ Aboriginal Australians compared to U.S. white and black


U.S. white and black Aboriginal Australian


70


↑, increase; ↓, decrease.


Anthropomorphic Features


Birth Weight

Low birth weight is defined by the World Health Organization as a birth weight under 2,500 g. Very low birth weight is usually defined a below 1,500 g. Low birth weight could result from prematurity itself (i.e., birth before the 37th week of gestation with an appropriate weight for gestational age), or from intrauterine growth restriction (IUGR) at any gestation.46 A small for gestational age infant is defined as having a birth weight below the 10th percentile of normal for that gestational age.46 Full-term IUGR is the most strongly associated with adult disease.91 Risk factors for low birth weight are diverse and, in poorer countries, maternal malnutrition, poor prenatal care, and infections are common, whereas in the developed world, factors such as high risk pregnancies, assisted reproduction, multiple gestations, and advanced maternal age are becoming more frequent.46,92 High birth weight is defined variably as a birth weight >4,000 g or >4,500 g, and is associated with maternal obesity, maternal diabetes, prolonged gestation, and reduced maternal smoking.93 High birth weight has also been associated with adverse renal outcomes in the offspring, especially as a consequence of maternal diabetes.94,95


Low birth weight is the strongest current clinical surrogate for nephron number. Nephron number has consistently been shown to correlate strongly with birth weight in humans, with an extrapolated increase of 257,426 glomeruli per kilogram increase in birth weight.19,48,54,70 The relationship of birth weight to nephron number is preserved among Australian Aboriginals, African Americans, and Whites and therefore may be generalizable to other populations.19,70 The specific relationship between nephron number and low birth weight has only been examined in infants. Low birth weight was associated with lower nephron number than normal birth weight, and was similar among black and white subjects.48,68 In experimental animals, however, not all low birth weight animals have been found to have reduced nephron number and, conversely, low nephron number has been reported in the absence of low birth weight.96,97 Birth weight alone, therefore, is not a universal surrogate for nephron number. To our knowledge, nephron number has not been specifically studied in high birth weight humans or animals. Other anthropomorphic correlates that have been associated with nephron number are highlighted in Table 2.3.18,20,70,98


TABLE 2.4 Differences in Nephron Number, Glomerular Volume, and Total Glomerular Surface Area in the Right Kidney, U.S./Australian Adults (18+ years), Means (SD)


Only gold members can continue reading. Log In or Register to continue

Stay updated, free articles. Join our Telegram channel

May 29, 2016 | Posted by in NEPHROLOGY | Comments Off on Clinical Importance of Nephron Mass

Full access? Get Clinical Tree

Get Clinical Tree app for offline access


All


No hypertension


Hypertension


No Hypertension versus Hypertension


US whites


Nglom


855 183 (295 247)


894 339 (275 956)


747 727 (271 155)


P = 0.026


Nglom adja


866 722 (289 896)


912 876 (283 744)


779 808 (288 510)


P = 0.046


US blacks


Nglom


921 708 (318 089)


931 463 (290 529)


912 480 (350 329)


P = 0.776


Nglom adja


946 379 (322 516)


949 934 (288 768)


952 441 (353 197)


P = 0.97


Aborigines


Nglom


733 484 (217 763)


843 423 (199 384)


631 321 (105 298)


P = 0.04


Nglom adja


776 422 (253 631)


912 539 (218 432)


653 241 (178 609)


P = 0.110


US whites


Mean Vglom, gmean


7.1 (6.6-7.6)


6.87 (6.3-7.5)


7.82 (6.9-8.9)


P = 0.096


US blacks


Mean Vglom, gmean


7.7 (7.2-8.3)


6.92 (6.3-7.6)


8.64 (7.8-9.5)


P = 0.0012


Aborigines


Mean Vglom, gmean


7.7 (6.5-9.0)


6.88 (5.4-8.7)


8.0 (5.3-11.9)


P = 0.426


US whites


Vglomtot, cm3


5.68 (5.3-6.1)


5.79 (5.2-6.5)


5.34 (4.7-6.3)


P = 0.484


US blacks


Vglomtot, cm3


6.74 (6.3-7.3)


6.16 (5.6-6.8)


7.34 (6.6-8.2)


P = 0.020


Aborigines


Vglomtot, cm3


5.40 (4.6-6.3)


5.89 (4.4-7.4)


4.96 (3.9-6.3)


P = 0.365