This review discusses the application of 2 novel imaging techniques in Barrett’s esophagus: autofluorescence imaging and narrow band imaging (NBI). Autofluorescence as well as NBI may help to direct endoscopic therapy for early neoplasia in Barrett’s esophagus; their value in daily practice, however, seems to be limited and needs further evaluation.
Barrett’s esophagus is a premalignant condition with an estimated annual cancer risk of 0.5%. Esophageal adenocarcinoma is known to develop through a multistep transition sequence starting with nonneoplastic Barrett’s epithelium, continuing through low-grade intraepithelial neoplasia (LGIN) and high-grade intraepithelial neoplasia (HGIN), and finally progressing into invasive early neoplasia (EN). Patients with Barrett’s esophagus are offered regular surveillance endoscopies to detect neoplasia at an early and curable stage. Present guidelines advise biopsy of the Barrett’s epithelium according to the Seattle protocol, whereby biopsies are obtained from any visible abnormality in addition to 4-quadrant random biopsies taken every 2 cm. This approach is, however, associated with sampling error because neoplastic lesions are often poorly visible and random biopsies only sample a small part of the Barrett’s esophagus. Furthermore, biopsying in 4 quadrants every 2 cm is time consuming, leading to low protocol adherence by endoscopists in daily practice.
In recent years, new imaging techniques have been developed to improve the detection of (intraepithelial) neoplasia at an early stage, thereby possibly improving Barrett’s surveillance practice. These imaging techniques can mainly be divided into 2 types: detection techniques and characterization techniques. Detection imaging techniques are developed to serve as red flag techniques to improve the detection of (intraepithelial) neoplasia by drawing attention to lesions that may harbor early stages of (intraepithelial) neoplasia. A detection imaging technique is typically used during broad field overview examination in addition to white light endoscopy. Characterization imaging techniques, on the other hand, are meant for detailed inspection of detected lesions to characterize the lesion and to differentiate between neoplastic and nonneoplastic lesions. In general, characterization techniques are used on a small area by zooming in on the mucosa to provide more details.
This review discusses the application of 2 novel imaging techniques in Barrett’s esophagus: autofluorescence and narrow band imaging (NBI).
Autofluorescence
Principle and Technique
Autofluorescence is the phenomenon in which tissue, after exposure to light of a certain wavelength, emits light of a longer wavelength. In tissue, endogenous fluorophores (eg, collagen, amino acids, flavins, nicotinamide adenine dinucleotide, and porphyrins) emit fluorescent light with a longer wavelength (ie, green and red light) after exposure to the short wavelength light (ie, ultraviolet or blue light). Besides initiating autofluorescence, short wavelength light can also be reflected, scattered, and absorbed by the tissues. Absorption of (fluorescent) light is possible by chromophores. The main chromophore in the gastrointestinal tissue that absorbs light in the visible wavelength (400–700 nm) is hemoglobin.
Compositional changes of the endogenous fluorophores and chromophores and stromal changes such as the thickening of the mucosa can influence the wavelength and intensity of the emitted autofluorescent light. Because of these changes, neoplastic lesions can exhibit an autofluorescent pattern that is different from that of normal tissue. Studies using point spectroscopy techniques, with small probes inserted through the accessory channel of the endoscope, have shown that the autofluorescence pattern of Barrett’s neoplasia is different from that of normal Barrett’s mucosa. This difference in autofluorescence in Barrett’s neoplasia is, however, believed to be mainly caused by changes in the stroma and hemoglobin concentration rather than changes in fluorophores composition.
The Light Induced Fluorescence Endoscopy (LIFE) system (Xillix Technologies, Richmond, British Columbia, Canada) was the first endoscopy system that enabled autofluorescent imaging as a broad field technique. This system consisted of a camera mounted on the ocular portion of a fiberoptic endoscope. Switching between the white light mode and the autofluorescence mode was possible by using the switch on the camera. After excitation with blue light, the emitted red and green autofluorescent light passed from 2 charge coupled devices in the camera to the image processor. Based on the ratio of red to green autofluorescence, the image processor produced a real-time endoscopic image on a monitor using pseudocolors. Concurrently with LIFE, another comparable system from another manufacturer was also available (Storz, Tuttlingen, Germany).
The major problem with these systems was the use of fiberoptic endoscopy, which had a much lower resolution than the current video endoscopy systems. A new AFI system (Olympus, Tokyo, Japan) was therefore developed, consisting of a sequential red, green, and blue light source and a high-resolution video endoscope. Changing between the high-resolution white light mode and the AFI mode was made easy by pushing a control button on the endoscope. After excitation with blue light, a real-time AFI image was produced based on 3 light features: total emitted autofluorescence, green reflectance (540–560 nm), and red reflectance (600–620 nm). This was a more extended algorithm than LIFE, which only used the ratio of red to green autofluorescence.
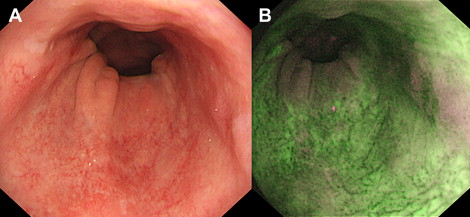
Finally, the endoscopic trimodal imaging (ETMI) system (Olympus, Tokyo, Japan) was developed, which is currently commercially available in Asia and the United Kingdom. ETMI is comparable with the AFI system but has additional features when using the high-resolution white light mode, during which NBI and optical zoom (magnification up to ×100) are possible. Most importantly, the algorithm of the autofluorescence mode was changed. The autofluorescence image is composed of 2 instead of 3 light features: total emitted autofluorescence and green reflectance (540–560 nm). Similar to the other systems, these light features are displayed as pseudocolors on the real-time endoscopic image on the monitor. In the case of ETMI, normal Barrett’s mucosa appears green, and (an area suspicious for) neoplasia is displayed as purple ( Fig. 1 ).
Clinical Application
Detection of neoplasia in Barrett’s mucosa
The first studies with the autofluorescence systems using fiberoptic endoscopy (the LIFE system) reported a higher detection rate of HGIN/EN with autofluorescence. Further evaluation with randomized crossover studies comparing white light video endoscopy with autofluorescence using the LIFE system showed, however, that autofluorescence did not increase the number of patients detected with HGIN/EN. Possible explanations for the lack of increased detection were the poor image quality of the fiberoptic endoscopy and the algorithm that did not take distorting effects into account.
Both problems were overcome when autofluorescence was translated to video endoscopy (AFI and ETMI), which had high-resolution endoscopy and a new algorithm. Feasibility studies with AFI and ETMI showed that after inspection with high-resolution white light, inspection with autofluorescence resulted in additional detection of lesions and patients with HGIN/EN. The targeted detection of patients with HGIN/EN increased from 43% to 65% after inspection with high-resolution white light and up to 90% to 100% after additional inspection with autofluorescence. The major drawback of autofluorescence was the high false-positive rate, as 40% to 81% of the lesions detected with autofluorescence did not contain HGIN/EN.
A recent randomized crossover study comparing ETMI with standard video endoscopy showed that targeted detection was significantly better with ETMI: 65% versus 44% with standard video endoscopy. Overall detection of the patients with HGIN/EN using ETMI (ie, targeted and random biopsies), however, was not statistically different from standard video endoscopy (84% vs 73%, respectively). Furthermore, random biopsies resulted in the detection of additional patients with HGIN/EN (64% with targeted biopsies vs 84% with targeted and random biopsies), which suggests that improved targeted imaging with ETMI is not enough to abandon random biopsy sampling. Finally, a high number of lesions detected with ETMI were false-positive results (71%), although standard video endoscopy showed a high false-positive rate as well (53%). This study was performed by endoscopists with extensive expertise in imaging and endoscopic treatment of Barrett’s esophagus, and only patients referred for HGIN/EN were included, that is, the study was performed in a high-risk population (with a high pretest likelihood of having HGIN/EN) by endoscopists who were used to see subtle lesions with HGIN/EN.
Hence, although autofluorescence did not lead to the identification of more patients with HGIN/EN in a tertiary referral setting, its use in a community hospital setting might be of additional value. Therefore, a randomized crossover study comparing ETMI with standard video endoscopy was performed in patients with an intermediate risk (ie, LGIN) by endoscopists without specific expertise in Barrett’s esophagus. Similar to the tertiary referral setting, the targeted detection of LGIN/HGIN/EN was again significantly increased with ETMI compared with standard video endoscopy (54% and 34%, respectively), but overall detection rates of patients with neoplastic changes in their Barrett’s esophagus were not significantly different. False-positive rates remained high with ETMI (68%) as well as with standard video endoscopy (64%).
Therefore, autofluorescence seems to increase the targeted detection of HGIN/EN lesions, although it does not result in a better overall detection of patients with HGIN/EN. The increased targeted detection rate might be useful to direct endoscopic therapy, although studies on this subject are lacking. Interobserver agreement on autofluorescence also seems to be reasonable with a kappa (κ) value of 0.48 to 0.76. Still, the false-positive rate of autofluorescence remains a drawback.
Attempts to reduce the false-positive rate have been made by inspecting autofluorescent positive areas in detail with NBI. The false-positive rate was substantially reduced after NBI inspection from 40%–81% to 10%–48%. This reduction in false-positive rates, however, was achieved at the expense of misclassifying a significant proportion (8%–17%) of the autofluorescent true positive areas as nonneoplastic.
The endoscopic features associated with true positive autofluorescent areas (ie, autofluorescent positive areas containing HGIN/EN) were therefore studied to reduce the false-positive rate of autofluorescence. Opaque autofluorescent intensity, a different appearance of the area after reinspection with white light, and no close proximity to gastric folds (>1 cm) were found to be associated with true positive autofluorescent lesions. Although further evaluation is needed, these endoscopic features may be helpful in improving the accuracy of autofluorescence.
In summary, autofluorescence increases the targeted detection of lesions with HGIN/EN and may therefore be useful in a tertiary center setting to direct endoscopic therapy. Autofluorescence, however, does not result in a better overall detection of patients with HGIN/EN. Furthermore, the false-positive rate of autofluorescence remains a major drawback.
NBI
Principle and Technique
NBI is a technique that uses optical filters to visualize the mucosal morphology by enhancing the mucosal as well as vascular patterns. NBI is based on the fact that the depth of light penetration into tissues depends on the wavelength of the light. Long wavelength light (red) penetrates deeper into tissue than short wavelength light (blue). Consequently, red light provides more information on the deeper layers of the mucosa, whereas blue light, which has a more superficial penetration, provides more information on the morphology of the mucosal surface. In addition, blue light reveals the superficial vasculature because it is absorbed by hemoglobin. With NBI, the relative intensity of the blue light is increased, whereas other wavelengths are reduced or eliminated by using a filter with narrow bandpass ranges.
Other techniques that enhance the mucosal morphology during real-time endoscopy, such as Fuji Intelligent Color Enhancement (FICE) (Fujinon Inc, Saitama, Japan) and i-Scan (Pentax, Tokyo, Japan), are also available. These techniques differ from NBI in that they are postprocessing techniques. These techniques do not use actual filters but change the white light endoscopic image from the video processor by arithmetically processing it into a virtual image for different wavelength settings. Studies using these techniques for Barrett’s esophagus are rare (FICE) or lacking (I-scan). Consequently, most data are known from studies that have been performed with NBI.
NBI is easy to use during endoscopy. Changing between the white light mode and the NBI mode on the endoscope is achieved by using a switch on the endoscope that deploys the NBI filter. NBI can be used during overview examination as a detection technique or for detailed inspection of mucosal and vascular patterns as a characterization modality.
Clinical Applications
Detection of neoplasia in Barrett’s mucosa
The value of NBI for the detection of HGIN/EN is unclear. Two studies have reported on the use of NBI for the detection of (intraepithelial) neoplasia in Barrett’s esophagus. Kara and colleagues evaluated the additional value of NBI and indigo carmine chromoendoscopy (ICC) and compared it with high-resolution white light endoscopy performed by endoscopists with specific expertise in Barrett’s esophagus in patients referred with endoscopically inconspicuous HGIN/EN. A total of 28 patients underwent 2 endoscopies at an interval of 6 to 8 weeks, one with high-resolution white light endoscopy followed by NBI and the other with high-resolution white light endoscopy followed by ICC. NBI, as well as ICC, did not result in the additional detection of patients with HGIN/EN. Nevertheless, NBI, as well as ICC, resulted in the detection of a limited number of additional lesions with HGIN/EN in patients in whom high-resolution white light endoscopy already detected neoplasia. Wolfsen and colleagues evaluated the detection rate of (intraepithelial) neoplasia with NBI and compared it with that of standard resolution white light in 65 patients referred for evaluation of (intraepithelial) neoplasia or enrolled in Barrett’s surveillance. Patients underwent 1 endoscopy, first inspected with standard resolution white light endoscopy by one endoscopist, followed by high-resolution white light endoscopy and NBI performed by a second endoscopist. NBI detected significantly more patients with higher grades of (intraepithelial) neoplasia than standard resolution white light endoscopy. However, some limitations may have biased the results. First, the standard resolution white light endoscopy was performed by a group of endoscopists, whereas the NBI endoscopy was restricted to 2 endoscopists with experience in advanced endoscopy. The NBI endoscopy included inspection with high-resolution white light endoscopy, which may be at least as important as NBI alone for the detection of neoplasia. In addition, NBI endoscopy inspection time was twice as long as that of standard endoscopy because the Barrett’s esophagus was inspected twice: once with high-resolution white light endoscopy and once with NBI.
Clearly, further studies are needed to determine if NBI is useful during overview examination for the detection of (intraepithelial) neoplasia in Barrett’s esophagus.
Characterization of Barrett’s neoplasia
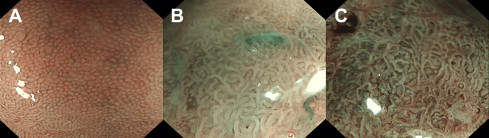
When using NBI with zoom, mucosal and vascular patterns can be inspected in detail. Mucosal morphology has been described and classified by several study groups to differentiate (intraepithelial) neoplasia from nonneoplastic tissue. Generally, regular or normal patterns are considered to be associated with nonneoplastic Barrett’s mucosa, whereas irregular or abnormal patterns are considered to be associated with neoplasia ( Fig. 2 , Table 1 ). Most of the studies have been performed by blinded image evaluation: endoscopists scoring the NBI zoom images were blinded for the endoscopic overview information. Other studies have been performed real time by freezing an NBI zoom image of a suspected area found during (autofluorescence) endoscopy. The sensitivity to differentiate HGIN/EN from LGIN/nonneoplastic tissue has been reported to be 71% to 100%, with a specificity of 33% to 99%. The sensitivity to differentiate LGIN/HGIN/EN from nonneoplastic tissue has been reported to be 59% to 89%, with a specificity of 36% to 72%. Although initial studies were promising, subsequent studies showed a rather moderate sensitivity. Possibly, NBI zoom provides too much detail without apparent clinically relevant information, which might confuse endoscopists more than providing them with valuable information.
| Sharma et al | Kara et al | Herrero et al | Anagnostopoulos et al | Singh et al |
|---|---|---|---|---|
| Mucosal pattern | Mucosal pattern | Mucosal pattern | Microstructural pattern | Microstructural or microvascular pattern |
| Circular Ridge/villous – | Regular Flat | Regular | Round Linear/tubular/villous Flat Nonstructural | Round pits & regular mv (pattern A) Villous/ridge pits & regular mv (pattern B) Absent pits & regular mv (pattern C) |
| Irregular/distorted | Irregular | Irregular | Irregular | Distorted pits & irregular mv (pattern D) |
| Vascular pattern | Vascular pattern | Vascular pattern | Microvascular pattern | |
| Normal | Regular | Regular | Regular | – |
| Abnormal | Irregular | Irregular | Irregular | – |
| Abnormal blood vessels | ||||
| – | Absent | – | – | – |
| – | Present | – | – | – |
Related posts:
 How to Approach the Small Bowel with Flexible Enteroscopy
 Wide View and Retroview During Colonoscopy
 High-Definition Endoscopy and Magnifying Endoscopy Combined with Narrow Band Imaging in Gastric Cancer
 New Options of Cholangioscopy
 High-Definition and Filter-Aided Colonoscopy
 Molecular Imaging of Gastroenteropancreatic Neuroendocrine Tumors
Stay updated, free articles. Join our Telegram channel

Full access? Get Clinical Tree


