Fig. 17.1
Flow diagram of patients with borderline resectable pancreatic ductal adenocarcinoma (BR-PDAC) obtained from questionnaires administered to attendees of the 37th annual meeting of the Japanese Society of Pancreatic Surgery (JSPS) in 2010. Patients had radiographic findings suggestive of vascular involvement limited to the PV (portal vein) alone (BR-PV), or to the HA (hepatic artery), SMA (superior mesenteric artery) and/or CA (celiac artery) with or without PV (BR-A)
Table 17.1
Background of the 673 cases with borderline resectable pancreatic ductal adenocarcinoma (BR-PDAC)
BR-PDAC (n = 673) | |
|---|---|
Age (years old) | 63.8 ± 7.9 |
Gender (male/female) | 388/285 |
Performance status (0-1/2/3/4) | 655/16/2/0 |
Elevation of CA19-9 (yes/no) | 502/171 |
Elevation of CEA (yes/no) | 237/436 |
Tumor location (Ph-Pb/Pt) | 624/49 |
Tumor diameter (mm) | 36.1 ± 10.1 |
T factor (T3/T4) | 508/165 |
N factor (N0/N1) | 341/332 |
Preoperative stage (2a/2b/3/4) | 268/222/156/27 |
Preoperative histological/cytological evidence (yes/no) | 100/573 |
Surgical procedure (PD/DP/TP/bypass/lap/others) | 450/105/26/62/28/2 |
PV/SMV resection (yes/no) | 441/232 |
SMA resection (yes/no) | 24/649 |
CA resection (yes/no) | 58/615 |
HA resection (yes/no) | 60/613 |
IVC resection (yes/no) | 14/659 |
Radicality (R0/R1/R2) | 377/148/148 |
POPF (yes/no) | 60/613 |
Hospital death (yes/no) | 29/644 |
The 3- and 5-year survival rates of all 673 patients were 15.9 % and 9.7 %, respectively (Fig. 17.2a). Survival curves plotted for patient groups according to the radiographic extent of vascular involvement (Fig. 17.2b) demonstrated that the 3- and 5-year survival rates were significantly higher in BR-PV patients than in BR-A patients: 21.1 % and 14.3 % vs. 10.0 % and 4.7 %, respectively (p = 0.001). Furthermore, patients who received preoperative treatment (n = 71) had 3- and 5-year survival rates significantly higher than those of patients who underwent surgery first (n = 602): 45.8 % and 12.6 % vs. 14.6 % and 9.6 %, respectively (p = 0.005) (Fig. 17.3). Survival curves according to the type of vascular invasion were also compared between surgery first and preoperative treatment groups (Fig. 17.4). Among patients who underwent surgery first, the 3- and 5-year survival rates were significantly higher in patients with BR-PV tumors (n = 322) than in those with BR-A tumors (n = 280): 19.0 % and 12.2 % vs. 9.4 % and 4.1 %, respectively (p = 0.001). In the preoperative treatment group, the 3- and 5-year survival rates of patients with BR-PV tumors (n = 34) were higher (though not significantly so) than those of patients with BR-A (n = 37) tumors: 40.4 % and 19.2 % vs. 13.9 % and 8.4 %, respectively (p = 0.061).
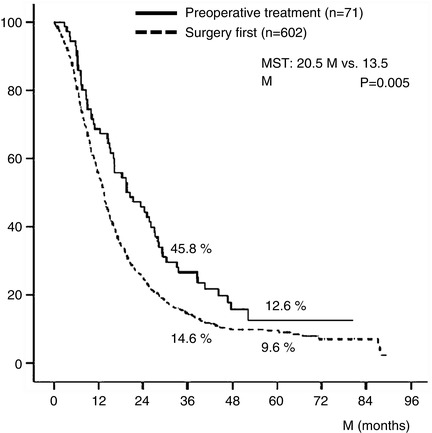
Fig. 17.2
(a) Kaplan–Meier survival curve of 673 patients with borderline resectable pancreatic ductal adenocarcinoma (BR-PDAC). The 3- and 5-year survival rates in total 673 patients were 15.9 % and 9.7 %, respectively. (b) Kaplan–Meier survival curves plotted for patient groups according to radiographic findings. Patients had radiographic findings suggestive of vascular involvement limited to the PV (portal vein) alone (BR-PV), or to the HA (hepatic artery), SMA (superior mesenteric artery) and/or CA (celiac artery) with or without PV (BR-A). The 3- and 5-year survival rates of BR-PV cases (n = 356) were significantly better than those of BR-A cases (n = 317): 21.1 % and 14.3 % vs. 10.0 % and 4.7 %, respectively (p = 0.001). MST median survival time
Fig. 17.3
Kaplan–Meier survival curves of BR-PDAC patients stratified by receipt of preoperative treatment. The 3- and 5-year survival rates of patients who received preoperative chemotherapy and/or radiotherapy (n = 71) were significantly better than those who did not (n = 602): 45.8 % and 12.6 % vs. 14.6 % and 9.6 %, respectively (p = 0.005). Details of the 71 patients who received preoperative treatment were as follows: radiotherapy + gemcitabine (Gem) (n = 31), Gem alone (n = 20), Gem + 5-fluorouracil (5-FU) (n = 11), radiotherapy alone (n = 4), Gem + S1 (n = 2), radiotherapy + Gem + 5-FU (n = 1), radiotherapy + oral fluorinated pyrimidine derivative (S-1) (n = 1), and 5-FU alone (n = 1). BR-PDAC borderline resectable pancreatic adenocarcinoma, MST median survival time
Fig. 17.4
(a) Kaplan–Meier survival curves according to borderline resectable subtype (BR-PV or BR-A) in BR-PDAC patients who underwent surgery first (n = 602). The 3- and 5-year survival rates of BR-PV cases (n = 322) were significantly better than those of BR-A patients (n = 280): 19.0 % and 12.2 % vs. 9.4 % and 4.1 %, respectively (p = 0.001). (b) Kaplan–Meier actuarial overall survival curves according to the extent of radiographic vascular involvement in the patients treated preoperatively. The 3- and 5-year survival rates of BR-PV patients (n = 34) were better than those of BR-A cases (n = 37): 40.4 % and 19.2 % vs. 13.9 % and 8.4 %, respectively (p = 0.061). BR-PDAC borderline resectable pancreatic adenocarcinoma, MST median survival time, BR-PV BR-PDAC with portal vein invasion alone, BR-A BR-PDAC with major artery involvement
We also compared survival curves and the status of residual tumor (R) between these radiographic subtypes among the patients who received operations with curative intent. In the surgery first group (Fig. 17.5a), the 3- and 5-year survival rates of patients with BR-PV tumors (n = 295) were significantly higher than those of patients with BR-A tumors (n = 223): 19.9 % and 15.2 % vs. 11.5 % and 5.0 %, respectively (p = 0.004). Moreover, patients with BR-PV tumors had a significantly higher R0 resection rate as compared to patients with BR-A tumors: 73.2 % vs. 52.0 % (p < 0.001). Among patients who received preoperative therapy (Fig. 17.5b), the 3- and 5-year survival rates were higher (though not significantly so) in BR-PV (n = 32) patients than in BR-A (n = 31) patients: 42.9 % and 20.4 % vs. 16.7 % and 10.0 %, respectively (p = 0.092). R0 resection rates did not significantly differ between BR-PV and BR-A subgroups: 75.0 % vs. 64.5 %.
Fig. 17.5
(a) Kaplan–Meier survival curves and the status of residual tumor (R) according to the borderline resectable subtype (BR-PV or BR-A) in the patients who underwent surgery first whose tumor was resected (n = 518). The 3- and 5-year survival rates of BR-PV cases (n = 295) were significantly better than those of BR-A patients (n = 223): 19.9 % and 15.2 % vs. 11.5 % and 5.0 %, respectively (p = 0.004). Moreover, BR-A patients showed significantly lower rates of R0 resection as compared to BR-PV patients. (b) Kaplan–Meier survival curves and the status of residual tumor according to the borderline subtype in the patients who underwent resection following preoperative treatments. The 3- and 5-year survival rates of BR-PV cases (n = 32) were better than those of BR-A cases (n = 31): 42.9 % and 20.4 % vs. 16.7 % and 10.0 %, respectively (p = 0.092). R0 resection rates did not differ between BR-PV and BR-A. BR-PDAC borderline resectable pancreatic adenocarcinoma, MST median survival time, BR-PV BR-PDAC with portal vein invasion alone, BR-A BR-PDAC with major artery involvement
In our previous study evaluating 624 patients with BR-PDAC tumors of the pancreatic head and body [4], multivariate analysis revealed four independent prognostic factors: surgical resection, major artery involvement as determined using triphasic contrast-enhanced multi-detector computed tomography, the administration of preoperative treatment, and the administration of postoperative chemotherapy. In the 539 patients who underwent resection, we also identified two independent prognostic factors: major artery involvement and the status of residual tumor. Furthermore, we revealed that the R0 resection rate of patients with tumors that appeared to involve the major arteries was significantly lower than that of patients with tumors that did not appear to involve the major arteries on preoperative imaging. The results of our subsequent reevaluation of the entire database of 673 patients with BR-PDAC tumors of the head, body, or tail of the pancreas showed that the R0 resection rate of patients who underwent surgery first was significantly lower among patients with BR-A tumors than patients with BR-PV tumors. However, the R0 resection rate of patients who received preoperative therapy did not significantly differ between patients who had BR-PV and BR-A tumors. Although the number of patients with BR-PDAC who received preoperative treatment in these analyses was small, these data suggests that preoperative treatment with CRT may enhance the rate of R0 resection, which in turn may improve therapeutic outcomes.
Preoperative Chemoradiotherapy at Our Institution
In an attempt to increase the R0 resection rate of patients with locally advanced PDAC, our institution has used preoperative gemcitabine-based chemoradiation therapy (GEM-CRT ) since February 2005 [5–7]. Although the benefits of preoperative CRT in this clinical scenario have been suggested by others [8–10], the extent to which histopathologic response to CRT is associated with survival in this setting has historically been unclear. We therefore explored the relationship between histopathologic response (as determined by evaluation of UICC-T3 and T4 PDAC tumors resected following GEM-CRT) and prognosis and found that in T3 tumors, histological response was a significant prognostic indicator, whereas in T4 tumors, GEM-CRT did not lead to a beneficial histological response [5]. Furthermore, we examined the relationship between the intratumoral expression of human equilibrative nucleoside transporter (hENT1, the main GEM transporter into cells) in the resected specimens and the outcome of GEM-CRT in patients with T3 and T4 PDAC [6]. We showed that the hENT1 expression in PDAC cells was strongly associated with the outcome of preoperative GEM-CRT treatment, suggesting that this biomarker might represent a useful predictor of the effect of gemcitabine-based therapies. From these studies, we concluded that GEM-CRT, even when used for patients with advanced PDAC, allowed for the identification of candidates for aggressive resection at the time of reassessment, facilitated an increase in the R0 resection rate, and improved the prognosis of patients with positive hENT1 expression [7].
Our treatment protocol for preoperative GEM-CRT was used to treat 124 PDAC patients from February 2005 to October 2011, and thereafter we switched our protocol to S-1/GEM-based CRT (S-1/GEM-CRT) which was used to treat 96 patients from November 2011 to September 2014 (Fig. 17.6). Although we initially referred to our protocol as neoadjuvant or preoperative CRT [5, 6], we subsequently adopted the term “CRT followed by surgery (CRT-S)” because approximately half of the patients registered in the protocol were staged as having unresectable PDAC—for these patients, the term “preoperative treatment” was not appropriate [7]. S-1 is an oral agent that contains tegafur, gimeracil, and oteracil [11], and the agent appears at least equivalent to or even more active than 5-FU when combined with radiotherapy for locally advanced PDAC [12, 13]. Recently, a randomized phase III study of GEM plus S-1, S-1 alone, or GEM alone in patients with locally advanced and metastatic PDAC (GEST Study) showed that monotherapy with S-1 demonstrated noninferiority to GEM in overall survival with good tolerability and that GEM plus S-1 significantly improved progression-free survival as compared with GEM [14].
Fig. 17.6
Treatment protocol of chemoradiotherapy (CRT) followed by surgery (CRT-S) at Mie University Hospital. Gemcitabine-based CRT (GEM-CRT) had been performed in 124 patients from February 2005 to October 2011, and S-1/GEM-based CRT (S-1/GEM-CRT) had been performed in 96 patients from November 2011 to September 2014. Gy gray, fr fraction, W week
The surgical outcomes of all 220 patients enrolled in our CRT-S protocol are shown in Table 17.2. Staged using NCCN criteria [3], there were 18 patients (8.2 %) with resectable tumors, 106 (48.2 %) with borderline resectable tumors and 96 (43.6 %) with unresectable tumors. The resection rate was significantly lower in patients with unresectable tumors (44.8 %) as compared to those with BR tumors (76.4 %). Combined resection of PV was aggressively performed in BR and in LUR: 90.1 % and 88.4 %, respectively. The R0 resection rate was also significantly lower in LUR (58.1 %) as compared to R (100 %) and BR (86.4 %). Survival curves according to the three resectability groups (R, BR, and LUR) in the total 220 patients and in the 135 patients who underwent curative-intent resection after CRT are shown in Figs. 17.7 and 17.8, respectively. Survival was significantly different among the three resectability groups: 5-year survival rates of 41.0 % (R), 24.2 % (BR), and 4.4 % (LUR) were observed in all treated patients, and 5-year survival rates of 68.6 % (R), 29.3 % (BR), and 9.5 % (LUR) were observed among patients who underwent resection.
Table 17.2
Surgical outcomes of patients enrolled for the chemoradiotherapy followed by surgery (CRT-S) protocol at Mie University Hospital, 2005.2- 2014.9 (n = 220)
R (n = 18) | BR (n = 106) | LUR (n = 96) | |
|---|---|---|---|
Resection rate | 61.1 % (11/18a) | 76.4 % (81/106b) | 44.8 % (43/96c) |
Surgical procedure (PD/DP/TP) | 5/6/0 | 74/6/1 | 28/15/0 |
Major vessels resection | PV: 3 (27.3 %) | PV: 73 (90.1 %) | PV: 38 (88.4 %) |
CHA: 3 | CA: 9, CHA: 3 | ||
I VC: 1 | |||
R0 | 100 % (11/11) | 86.4 % (70/81) | 58.1 % (25/43) |
R1 | 0 % (0/11) | 11.1 % (9/81) | 34.9 % (15/43) |
R2 | 0 % (0/11) | 2.5 % (2/81) | 7.0 % (3/43) |
Fig. 17.7
Kaplan–Meier survival curves according to the three resectability groups (R, BR, and LUR) in the enrolled 220 patients who underwent chemoradiotherapy followed by surgery (CRT-S) at Mie University Hospital. R resectable, BR borderline resectable, LUR locally unresectable, MST median survival time
Fig. 17.8
Kaplan–Meier survival curves according to the three resectability groups (R, BR, and LUR) in the 135 patients who underwent curative-intent resection after CRT at Mie University Hospital. R resectable, BR borderline resectable, LUR locally unresectable. MST median survival time
CA19-9 has been accepted as a measure of PDAC burden; however, the role of CA19-9 in the evaluation of patients with preoperative CRT prior to planned surgical resection has not been well evaluated. Previously, we explored whether serum CA19-9 levels could be used as an index of response to GEM-CRT, especially in BR-PDAC patients [7]. By comparing the level of pre-CA19-9 with that measured at the time of reassessment (post-CA19-9), the reduction rate was calculated as follows: (pre-CA19-9–post-CA19-9)/(pre-CA19-9) (%). When the reduction rate was greater than 50 % regardless of the pre-CA19-9 level, GEM-CRT was defined as being effective. Survival curves for the 43 BR-PDAC patients were analyzed according to the CA19-9 reduction rate. The 3-year survival rate was significantly higher in 23 patients who had a CA19-9 reduction rate of 50 % or more than in 20 patients who had a CA19-9 reduction rate less than 50 % (36.6 % vs. 7.9 %, P = 0.0003). In the present cohort study using 102 BR-PDAC patients in whom serum levels of CA19-9 could be reassessed after GEM-CRT or S1/GEM-CRT, the 3-year survival rate was significantly higher in 60 patients who had a CA19-9 reduction rate of 50 % or more than in 42 patients who had a CA19-9 reduction rate less than 50 % (37.0 % vs. 21.0 %, P = 0.011) (Fig. 17.9). As compared to the previous study, the 3-year survival rate in patients who had a CA19-9 reduction rate less than 50 % improved from 7.9 % to 21.0 %, while in patients with a CA19-9 reduction rate of 50 % or more, it did not change (36.6 % vs. 37.0 %).
 Overview of Multimodality Therapy
Emerging Systemic and Targeted Therapies
Overview of Multimodality Therapy
Emerging Systemic and Targeted Therapies
 Palliative Operations for Unresectable Pancreatic Cancer
 Role of Radiation Therapy
 Surgical Approach to Borderline Resectable Tumors of the Left Pancreas
 Endoscopic and Percutaneous Biliary Drainage Procedures: Role in Preoperative Management, Diagnosis, and Palliation


Related posts:
Overview of Multimodality Therapy
Emerging Systemic and Targeted Therapies
Palliative Operations for Unresectable Pancreatic Cancer
Role of Radiation Therapy
Surgical Approach to Borderline Resectable Tumors of the Left Pancreas
Endoscopic and Percutaneous Biliary Drainage Procedures: Role in Preoperative Management, Diagnosis, and Palliation
Stay updated, free articles. Join our Telegram channel
Full access? Get Clinical Tree
