9. THE ABSORPTIVE AND POST-ABSORPTIVE STATES
After studying this chapter you should be able to:
1. Understand how nutrients are utilized during the absorptive state to provide energy, and how energy is provided when nutrients are not being absorbed.
2. Consider how the absorptive and post-absorptive patterns of metabolism are controlled by hormones, and how this control is impaired in diabetes mellitus.
Introduction
The nutrient state of the blood depends on whether or not a meal is being processed in the gastrointestinal tract. When nutrients such as glucose and lipid are being absorbed, and their concentrations in the blood are high, the pattern of energy metabolism is known as the absorptive state. In this state, a fraction of the blood glucose is used by various tissues to meet their immediate energy needs. The excess glucose and the absorbed lipid are stored as glycogen and lipid that can be used to provide energy between meals or during fasting: a pattern of energy metabolism known as the post-absorptive state. The change from the absorptive state pattern to the post-absorptive state pattern is brought about by changes in the blood concentrations of insulin and other hormones. The importance of maintaining the appropriate patterns of metabolism can be illustrated by considering the metabolic defects present in insulin-dependent diabetes mellitus (IDDM, or type I diabetes), in which the secretion of insulin is severely impaired. In this chapter we shall consider the metabolic abnormalities present in this condition, and the consequences of these defects (Case 9.1 and Case 9.1).
Case 9.1
A 12-year-old girl was taken to see her doctor. Her parents were worried because she seemed listless and was losing weight. They said she also seemed to be drinking a lot and was frequently having to pass urine. The doctor noticed that her breathing was rapid and shallow (Kussmaul breathing), and that it smelled of acetone. The patient provided a sample of urine. Clinistix tests on the urine sample indicated the presence of glucose and ketones. An appointment was made for her to attend a diabetes clinic. She was told to fast from the evening before the appointment. A blood sample was taken and the blood glucose concentration was found to be (11.1mmol/L). This is above the normal range (3.5–7.0mmol/L), indicating the presence of hyperglycaemia (high blood glucose). Hypoinsulinaemia (low plasma insulin) and ketoacidosis (high levels of ketone bodies in the blood) were also noted. The results confirmed that the patient was diabetic. She was later taught how to inject herself with insulin, which had to be done three times a day, before meals.
After considering the details of this case we can address the following questions:
• Why is this patient likely to be suffering from insulin-dependent diabetes mellitus (IDDM) rather than non-insulin-dependent diabetes mellitus (NIDDM)? What are the basic defects in each condition? Would the concentration of plasma insulin be low in both conditions? What is the explanation for the listlessness in this patient?
• How is the control of blood glucose changed in diabetes mellitus?
• Why did the patient’s breath smell of acetone? Why was her acid–base status changed? Why was her breathing abnormal (rapid and shallow)? How would the body normally compensate for the acidosis?
• What are the mechanisms responsible for the high urine output (polyuria), glucosuria and ketonuria, in this patient?
• Are hormones other than insulin also affected in diabetes mellitus?
Case 9.1
Defect and cause
The patient was likely to be suffering from IDDM. This condition affects mostly young people, the commonest age of onset being between 10 and 14 years, whereas NIDDM usually affects people in middle or later life. Hyperglycaemia is a characteristic of both conditions. In IDDM, it is due to reduced secretion of insulin as a result of necrosis of the pancreatic β-cells. In NIDDM, destruction of many β-cells eventually occurs, but plasma insulin concentrations are not usually low until later in the disease (see Box 9.2). It is sometimes referred to as ‘insulin-resistant diabetes’ for this reason. In the patient described above, the insulin concentration was low. The extent of the metabolic disturbance is usually less severe in NIDDM than in IDDM, and ketoacidosis (see below) is not usually a feature of NIDDM. The presence of ketones on the breath would therefore also support a diagnosis of IDDM.
IDDM affects both sexes equally, but there is a slightly earlier peak in age of onset in girls than boys. It is more prevalent in Caucasians than non-Caucasians, and more prevalent in people living in the Northern hemisphere than the Southern hemisphere. There is a higher incidence of first diagnoses in winter than summer. The frequency of the disease has been increasing during the last 60 years. This is probably in part due to dietary factors and increased obesity. Only approximately 15% of diabetic patients suffer from IDDM (<0.3 % of the population). The majority of diabetics suffer from NIDDM, although other rare forms of diabetes exist.
There is evidence for a genetic predisposition, particularly to IDDM. In identical twins, there is a 30–50% concordance for IDDM. The HLA genes on chromosome 6 are associated with the condition, and a number of rare predisposing genetic mutations have recently been identified. However, other factors are important (see below).
IDDM is an immune-mediated disease. Circulating antibodies to cytoplasmic proteins of the β-cell are present in most patients, although these particular antibodies may be a secondary phenomenon as they disappear early in the disease. Evidence for a more direct involvement of antigens that react with intracellular enzyme proteins, such as glutamic acid decarboxylase and tyrosine phosphatase is emerging. There is also strong evidence for defects in cell-mediated immunity in IDDM. Studies in first-degree relatives of children with IDDM, who have a higher than normal risk of developing the disease, have demonstrated islet antibodies in the circulation in the first few years of life, i.e. years before diagnosis, and this could also prove to be a useful tool in predicting the disease.
The aetiology of IDDM is largely unknown, although in some cases it may be due to a viral infection. Viruses that have been implicated are Coxsackie B virus, mumps and rubella. Evidence has also been reported, which implicates environmental toxins. (It has been known for many years that alloxan and streptozotocin can cause β-cell necrosis and diabetes in rodents.) One candidate is nitrosamines, found in some smoked foods, which have been shown to be toxic to pancreatic β-cells in animals. Bovine serum albumin present in cow’s milk has also been implicated; antibodies to this protein are more common in the blood of diabetic than non-diabetic patients, and they cross-react with a peptide known as p69, which is often present on the surface of β-cells during infectious episodes.
Apart from the symptoms mentioned in the patient above (listlessness, weight loss, polyuria, polydipsia, Kussmaul breathing), vomiting and abdominal discomfort, mental confusion and coma, and tachycardia and hypertension can also be present. Secondary complications in IDDM are neuropathy (sensory and motor), retinopathy, nephropathy, and cardiovascular defects such as ischaemic heart disease, cerebrovascular disease, peripheral vascular disease and renal failure.
The absorptive state
In the absorptive state, the nutrients entering the blood from the gastrointestinal tract are hexose sugars and amino acids. The liver is the first port of call for these absorbed nutrients. It takes up a large fraction of the nutrients, thereby altering the composition of the blood before it circulates to the rest of the body. The nutrients remaining in the blood are taken up by adipose tissue, muscle and other tissues. Lipids are absorbed from the small intestines into the lymph as components of chylomicrons (ch. 8). They enter the venous blood at the thoracic duct, and are then metabolized and stored in adipose tissue.
Fate of absorbed carbohydrate
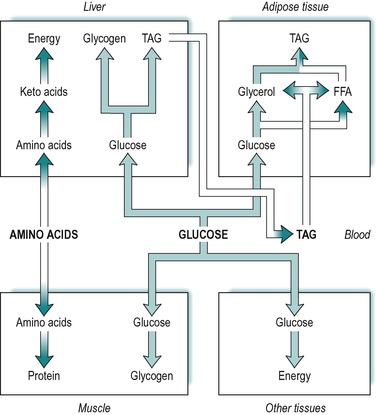
Absorbed carbohydrate consists of glucose, galactose and fructose. However, the liver converts fructose and galactose to glucose and then releases glucose into the blood. It is expedient therefore, to consider absorbed carbohydrate as glucose. Figure 9.1 illustrates the various fates of glucose during the absorptive state.
A large fraction of the absorbed glucose enters the various cells of the body, where it is used for the production of energy. During the absorptive state, glucose is the main fuel for most tissues of the body, which utilize it by glycolysis, the citric acid cycle and other pathways. The rest of the absorbed glucose is used to provide stores of energy for later use during the post-absorptive (fasting) state (see below). The tissues that store most of the body’s energy are liver, adipose tissue and muscle. Glucose is taken up by all of these tissues in the absorptive state.
Some of the glucose taken up by the liver is converted to glycogen that is then stored in the liver, and some is converted to triacylglycerol. The glucose provides both the glycerol and the fatty acid moieties of triacylglycerol. Some of the triacylglycerol synthesized in the liver is stored there, but most is released into the blood as a component of very low density lipoproteins. Very little glucose and fat is utilized for energy in the liver itself. (The liver’s main source of energy in the absorptive state is amino acids, see below.)
Another fraction of the blood glucose enters skeletal muscle where it is converted to glycogen for storage in the muscle. A further fraction enters adipose tissue, where it is converted to fatty acids and α-glycerol-phosphate, which are used in the synthesis of triacylglycerol. The α-glycerol-phosphate pathway for triacylglycerol synthesis is outlined in Chapter 8.
In summary, during the absorptive phase, glucose is used for energy production by most tissues of the body, and the excess is stored in muscle and liver as glycogen, and in adipose tissue as fat. These relationships are outlined in Figure 9.1.
Various inherited disorders of carbohydrate metabolism have been characterized, where either glycogen storage is excessive, or abnormal glycogen is produced (see Box 9.1). These conditions are due to defects in enzymes involved in glycogen metabolism.
Box 9.1
Most glycogen storage diseases are autosomal recessive disorders. They are caused by enzyme defects that lead either to accumulation of glycogen, or to an abnormality in the structure of glycogen. Glycogen is synthesized in liver or muscle. Some defects are restricted to liver and some to muscle.
Defects in liver enzymes
• Phosphorylase or phosphorylase kinase (see fig. 9.9). A defect in either of these enzymes leads to hepatomegaly and hypoglycaemia; the prognosis is good
• Phosphorylase 6 kinase. The defect leads to hepatomegaly, hypoglycaemia and fatiguability
• Debranching enzyme. The defect leads to an abnormal structure of liver and muscle glycogen. The clinical features are similar to those for glucose-6-phosphatase deficiency (see below)
• Branching enzyme. A defect in this enzyme results in abnormal structure in liver glycogen. The clinical features are hepatomegaly and cirrhosis, and death in the first 5 years of life
• Glucose 6-phosphatase (Von Gierke’s disease, see fig. 9.8). In this disease, the defect leads to hepatomegaly (enlarged liver), ketototic hypoglycaemia, stunted growth, obesity and hypotonia. Liver, intestine and kidney are affected. There is a high mortality rate.
Defects in muscle enzymes
• Phosphorylase (McArdle’s disease). The symptoms are muscle cramps and myoglobinuria after exercise. The life-span is normal
• Phosphofructokinase (see fig. 9.8). The clinical features are similar to those seen in phosphorylase deficiency (see above)
• Lysosomal acid α-glucosidase. A defect in this enzyme leads to cardiomyopathy and heart failure, and death in infancy. Liver, muscle and heart tissues are affected.
Fate of blood triacylglycerol
Absorbed triacylglycerol is carried in the lymph as droplets partially coated with protein, known as chylomicrons (see Ch. 8). The triacylglycerol synthesized from glucose in the liver is released to circulate in the blood, but as components of very low density lipoproteins. The blood enters the adipose tissue where the lipids present in both very low density lipoproteins and chylomicrons, are hydrolysed to fatty acids and glycerol by a lipoprotein lipase present in the endothelial surfaces of the capillaries. Most of the fatty acids produced are taken up into the adipose cells (adipocytes) by passive diffusion, although a small fraction circulates to other tissues. The glycerol produced is either taken up by the adipose tissue cells or transported to other tissues. In adipocytes, the fatty acids and glycerol are reconstituted to triacylglycerol via the α-glycerol phosphate pathway (see Ch. 8), and stored in the cells. Thus, during the absorptive state, triacylglycerol in adipose tissue arises from three sources; absorbed glucose, very low density lipoproteins released from the liver, and dietary triacylglycerol present in chylomicrons. These relationships are summarized in Figure 9.1.
Adipose tissue is abundant in the body, and widely distributed in subcutaneous, perirenal, mesenteric and other regions. An adipocyte contains a small amount of cytoplasm, which surrounds a large lipid droplet. There is very little water present in adipose cells. Lipid has a very low density. It provides a very efficient storage form of energy; 1g of triacylglycerol contains more than twice as many calories as 1g of glycogen or protein. Moreover, a 70kg man has approximately 15kg triacylglycerol that provides 135 000kcal of energy, but only approximately 0.2kg of glycogen, providing only 800kcal of energy.
Fate of absorbed amino acids
In the absorptive state, a fraction of the absorbed amino acids is taken up by the liver (Fig. 9.1) and converted to ketoacids that are oxidized via the citric acid cycle and other pathways. Ketoacids are the liver’s main source of energy in the absorptive state. Excess ketoacids can be converted to triacylglycerol in the liver. The conversion of amino acids to ketoacids involves deamination, with the formation of ammonia that is converted to urea in the liver. The urea is released from the liver into the blood, and subsequently secreted by the kidneys.
Amino acids that are not taken up by the liver enter other tissues, such as muscle, where they are utilized for protein synthesis. Muscle is quantitatively the most important tissue in this respect. Protein is not a particularly labile source of energy, but it is broken down and used for energy during prolonged fasting.
Insulin
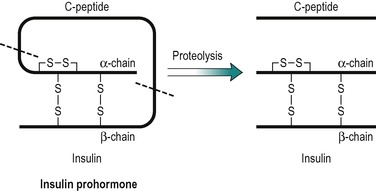
Insulin has a central role in the control of metabolism. If it is injected, the absorptive state is duplicated, and if its plasma concentration is very low, as in untreated IDDM, the pattern of metabolism that predominates is an exaggerated version of that seen in the post-absorptive state. Insulin is a polypeptide (MW 6000), consisting of two peptide chains that are connected together by two disulphide bridges (Fig. 9.2). The prohormone precursor of insulin is a single peptide chain (MW 9000) known as proinsulin, which is converted to insulin by proteolytic cleavage. This results in the removal of a peptide, known as C peptide. In the prohormone, C-peptide connects the two peptide chains of insulin (Fig. 9.2). Both insulin and the C peptide are stored in granules in the β-cells of the pancreas. C peptide is secreted with insulin in a ratio of 1:1, but C peptide, unlike insulin that is removed from the blood by the liver, is excreted in the urine. Its concentration in the urine can be used to assess an individual’s ability to secrete insulin. It has no established biological function.
The release of insulin into the blood is stimulated by eating and inhibited by fasting, and insulin is largely responsible for promoting the pattern of metabolism seen in the absorptive state. High levels of glucose and amino acids in the blood (as when a meal is being processed) are the primary stimuli for insulin secretion. The hormone acts on most tissues of the body, but muscle, adipose tissue and liver are quantitatively the most important. However, some tissues, such as brain and erythrocytes, which are obligatory utilizers of glucose for fuel, are not sensitive to insulin.
Control of insulin secretion
Insulin is a protein hormone secreted by the islets of Langerhans in the pancreas. It is released by exocytosis in response to raised intracellular Ca2+ concentrations. The second messengers involved include cAMP, but intracellular inositol trisphosphate, and diacylglycerol, which activates protein kinase C, are also increased. The release of insulin from the pancreas is controlled to a large extent by the concentration of glucose and amino acids in the blood perfusing the pancreas. Other factors, such as hormones and neurotransmitters, potentiate or inhibit the effects of the blood nutrients on insulin secretion.
Control by glucose
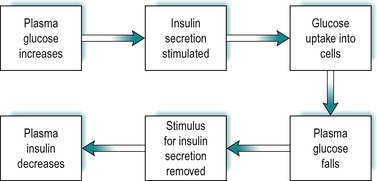
The secretion of insulin in response to an increase in blood glucose is under feedback control (Fig. 9.3). After a meal the blood glucose increases as it is absorbed from the gastrointestinal tract. This results in stimulation of insulin secretion from the β-cells of the islets of Langerhans. These cells respond to both the actual glucose concentration, and the rate of change of glucose concentration in the blood. The effect is due to the uptake and intracellular metabolism of glucose in the β-cells. Glucose is transported into these cells via the GLUT2 transporter. The enzyme glucokinase which catalyses glucose 6 phosphate formation from glucose, the rate-limiting step in glycolysis (see Fig. 9.8), is a key mediator in the β-cells. However 3-carbon compounds such as glyceraldehyde, which are intermediates formed downstream from glucose-6-phosphate in the glycolytic pathway, are potent stimulators of insulin release. The secretory mechanism depends on the generation of ATP via glucose metabolism. ATP closes an ATP-sensitive K+ channel, and this results in depolarization of the cell, causing a voltage-dependent Ca2+ influx. Elevated intracellular Ca2+ then causes insulin exocytosis.
 |
| Fig. 9.3 |
Insulin lowers blood glucose by promoting its uptake into cells (see below). Thus as the concentration of insulin in the blood rises, the concentration of glucose falls and the stimulus for insulin secretion is removed. As a consequence, the concentration of insulin falls. The feedback control of insulin secretion by plasma glucose is summarized in Figure 9.3.
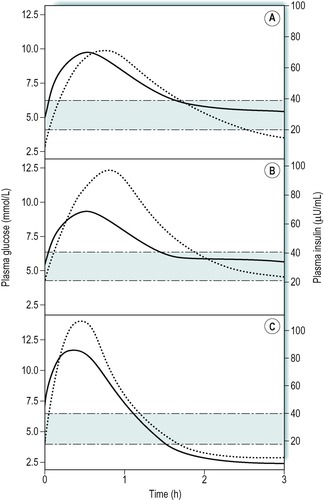
The concentration of plasma insulin normally parallels the rise and fall in the levels of plasma glucose. This is illustrated in Figure 9.4A that shows the results of a glucose drink in a fasting individual. Concentrations of glucose above 5mmol/L are effective in increasing insulin release. The response to an oral glucose load (glucose tolerance test) is used to diagnose diabetic states, where the fasting glucose concentration is not sufficiently raised to give a clear diagnosis on its own (Case 9.1: 3). In obese individuals there is a slower uptake of glucose into cells after a meal, and an exaggerated insulin response to the increase in plasma glucose (Fig. 9.4B). The plasma insulin concentration rises to a higher level than in people of normal weight.
Case 9.1


Get Clinical Tree app for offline access
Diagnosis and treatment
Tests that may be performed to assess the diabetic status of an individual include plasma and urine glucose, plasma insulin, and plasma and urine ketone bodies. Glucose and ketone bodies in blood and urine can be measured by automated colorimetric procedures and insulin by radioimmunoassay. In untreated IDDM blood and urine glucose concentrations are high and plasma insulin concentration is very low, or undetectable. In severe cases, plasma and urine ketone concentrations are high.
Glucose tolerance test in IDDM and NIDDM
The diabetic status of an individual can be assessed by an oral glucose tolerance test, although this is rarely necessary in IDDM because of the presence of a markedly raised blood glucose concentration and glucosuria. For the glucose tolerance test the patient fasts overnight and then drinks a solution containing 75g of glucose in 250–300mL of water. A ‘fasting’ sample of blood is obtained immediately prior to the glucose load and then further blood samples are obtained at 30-min intervals thereafter, for 3h. Figure 9.5 shows the results of such a test in a normal individual, a patient with IDDM, and a patient with NIDDM. In a normal individual the fasting plasma glucose concentration is usually within the range 3.5–7.0mmol/L. After an oral glucose load it increases to reach a peak between 30 and 60min and returns to normal by 2h. In both of the diabetic patients, the fasting concentration of glucose was abnormally high, but it was highest in the patient with IDDM. After the glucose load, the plasma glucose concentration increased to a very high level in both patients but it was highest in the patient with IDDM, and remained higher for longer than in the patient with NIDDM.
Stay updated, free articles. Join our Telegram channel

Full access? Get Clinical Tree


