Historical Highlights and Definitions
Carbohydrates are the most widely distributed naturally occurring organic compounds on earth. Sites of primitive sugarcane cultivation plants were found in New Guinea and in northeast India dating as early as 10,000 and 6,000 years BC, respectively. Papyrus, composed mainly of cellulose and wheat starch, was used for writing around the years 4,000 BC especially by the Egyptians. In August 1492, Christopher Columbus stopped at the Canary Islands where he stayed for a month after he became romantically involved with the governor of the island. When leaving, she gave him cuttings of sugarcane which became the first to reach the New World.
The name carbohydrate, or hydrate of carbon, actually makes the chemical definition. An alternative term used for carbohydrate is saccharide, from the Greek language meaning sugar. The general stoichiometric formula of an unmodified simple carbohydrate molecule or monosaccharide is (C·H
2O)
n or (CHOH)
n. The number of carbon atoms per molecule can be as few as three or triose(s) (C
3H
6O
3: i.e., glyceraldehyde and dihydroxyacetone, which are important in mitochondrial respiration), to as many as nine or nonose(s) (C
9H
18O
9: like neuraminic acid also called sialic acid, widely found in glycoproteins and gangliosides). Although all these monosaccharides are found in nature, by far the most abundant and the most commonly used in cellular metabolism
are the hexoses (C
6H
12O
6), mainly glucose, galactose, fructose, and mannose. Another important class of monosaccharides is the pentoses (C
5H
10O
5) like the ribose sugar, a main constituent of the cellular deoxyribonucleic acid (DNA) and ribonucleic acid (RNA).
Carbohydrates are classified according to the number of saccharide molecules forming the sugar. They are subdivided into mono-, di-, oligo-, and polysaccharides. Monosaccharides have one molecule like glyceraldehyde, ribose, glucose, galactose, fructose, etc., as described in the previous paragraph. Disaccharides have two molecules; examples include maltose (glucose-glucose), lactose (glucose-galactose), and sucrose (glucose-fructose) or table sugar which is also called saccharose, from the Greek language meaning sweet sugar. Oligosaccharides contain between 3 and 10 monosaccharides, they are often found as components of glycolipids and glycoproteins. An important oligosaccharide is the glycoprotein of the ABO blood type specificity. Finally, polysaccharides have more than 10 molecules although usually the number is much higher between 200 and 2500. The sugar moieties are linked together in a multi-branched structure. Starch is the main plant’s polysaccharide whereas glycogen makes its counterpart as the animal’s prototype. Both of them are polymers of glucose but glycogen has more extensive branching than starch.
The description of fibers was originally coined in 1953, when Hipsley et al. reported a possible association between dietary fibers and the lower occurrence of pregnancy toxemia. Dietary fibers were analytically defined for the first time in 1972 by Trowell et al. as “the skeletal remains of plant cells resistant to digestion by human enzymes.” This definition was subsequently modified by the same group in 1976 into “all plant polysaccharides and lignins which are resistant to hydrolysis by digestive enzymes of the man.” Dietary fibers contain mainly complex polysaccharides within their structures, thus their inclusion in the carbohydrate section. It is well known that dietary fibers have many beneficial, though sometimes debatable, effects on human health. In view of the variety of physiological effects and the methodology used to identify and quantify them, various definitions for “dietary fiber” have been proposed and adopted. Substances of animal origins were also described as having similar characteristics as the plants’ dietary fibers (e.g., chitosan). In 2005, the Institute of Medicine of the National Academics defined the “fiber concept” as the following:
Dietary fiber: nondigestible carbohydrates and lignins, those are intrinsic and intact in plants.
Functional fiber: isolated, nondigestible carbohydrates that have physiological effects in humans.
Total fiber: the sum of dietary and functional fiber.
Structures
The structure and/or the chemical configuration of the sugar confer its availability for utilization by the metabolic processes in humans. Glucose (C
6H
12O
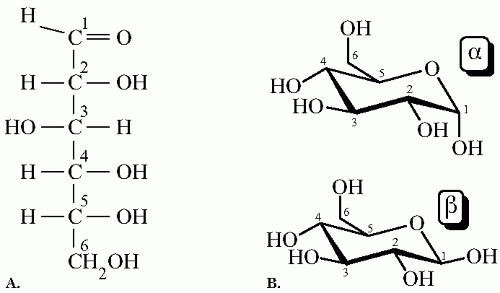
6), the most common monosaccharide, exists in ring (cyclic) and open chain (noncyclic) forms. The cyclic form is predominant in nature. Depending on the atomic arrange
ment of the spatial structure, or isomeric configuration, glucose (or any hexose) has two stereoisomers named dextro- (D) and levo- (L) isomers (
Fig. 1-1A). D and L sugars are nonsuperimposable mirror images of each other; D sugars are the most naturally occurring. While both forms can diffuse into the cell, D-glucose absorption being much higher than L-glucose, only D-glucose contributes to energy production.
In the cyclic form, two spatial structures exist: designated alpha- (α) and beta- (β) anomers. The difference between α-glucose and β-glucose depends on the relative placements of the hydroxyl group (—OH) attached to the first carbon (C-1) and the —CH
2OH group attached to the fifth carbon (C-5). In the α anomer the —OH group and the CH
2OH group are on different sides of the ring, while in the β anomer both groups are on the same side (
Fig. 1-1B). Under physiologic conditions and at equilibrium, the ratio of α-D-glucose to β-D-glucose in a solution is approximately 2:1. The differential uptake and metabolism by the cells of either α or β-D-glucose, also called anomeric specificity, is dependent on the type and function of different cells. Human studies show that β-D-glucose is more readily used for cellular transport and glycolysis in the erythrocyte at physiologic conditions. On the other hand, insulin release by the islets of Langerhans is more specific for the α-D-glucose; this occurs whether the sugar is injected intravenously or given by mouth. A change in the anomeric preference from the α-D-glucose toward the β-D-glucose in the pancreas has been proven in humans with noninsulin-dependent mellitus. Also, human subjects cannot differentiate by taste α- from β-D-glucose.
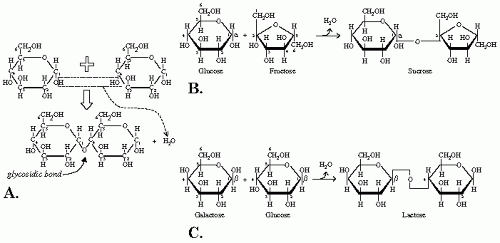
The structure of a di-, oligo-, or polysaccharide sugar is based on the bonding of two monosaccharides, called glycosidic bond. It is defined as a dehydration reaction between a sugar and another organic molecule. In the case of a disaccharide, two monosaccharides are joined with the loss of one molecule of water. This joining occurs between two —OH groups, one on each monosaccharide (
Fig. 1-2A). The chemical formula will be the following:
(CHOH)n + (CHOH)n′ → (CHO)nHn – 1 — (CH)n′(OH)n′ – 1 + H2O
Two important features of the glycosidic bond give the sugar its characteristic and also its name. First, the location of the carbon atom, meaning its number on the carbohydrate; second, the configuration α or β assumed by the glycosidic bond. In the cyclic form, carbon atoms are numbered according to their distance from the oxygen atom, which holds the center position, thus the name ring oxygen. One distinguishes between α and β forms depending on the spatial relation between the glycosidic bond and the substituent group, other than hydrogen, connected to the carbon flanking the ring oxygen. In a D sugar, α configuration is when the bond and the substituent group are on opposite sides of the ring (
Fig. 1-2B), the β configuration is when both groups are on the same side of the ring (
Fig. 1-2C), just like α- and β-D-glucose, respectively. These specifications are important for the sugar’s availability for absorption and thus its utilization for energy production and/or storage.
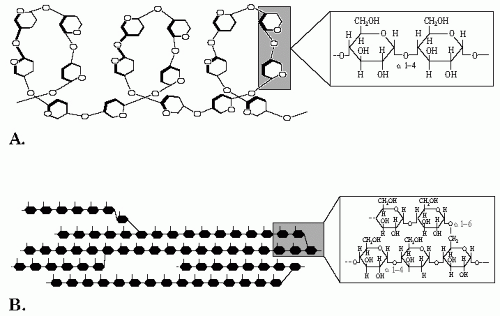
A typical polysaccharide that is by far the most consumed by the human diet is starch. The main source of dietary starch is traditional staple foods such as cereals, roots, and tubers like potatoes. Starch is a polymer of glucose or homopolymer that has
two components. The first is amylose, composed of linear chains of α (1→4) D-glucose. Amylose is a long chain of glucose subunits, the number usually ranging between 300 and 3000. The α (1-4) bonds promote the formation of a helix structure that is important for storage (
Fig. 1-3A). The second macromolecule is amylopectin, a branched homopolymer composed of linear chains of α (1-4) D-glucose interconnected with α (1-6) bonding at the branching points which take place every 20 to 30 molecules of glucose (
Fig. 1-3B).
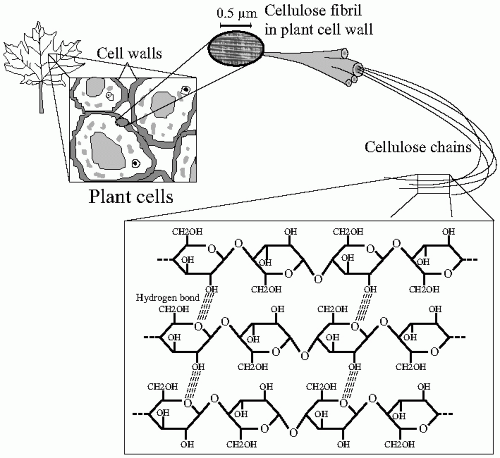
Cellulose, a typical fiber, is the most abundant natural organic compound on earth. About 33% of all plant matter is cellulose. It is the structural component of the primary cell wall of green plants. Cellulose is a condensation of D-glucose moieties connected through β (1-4) glycosidic bonds. In contrast to α (1-4) present in starch, the β bondings make the linear chain of cellulose less flexible than the amylose chain; accordingly, no coiling occurs and the molecule adopts an extended and stiff, rod-like conformation. The open chain configuration exposes multiple —OH groups and promotes the formation of hydrogen bonds between the glucose residues. These connections stabilize further the cellulose structure, which becomes organized in the form of microfibrils with high tensile strength. This alignment provides resistance to physical disruption of the cellulose molecule (
Fig. 1-4). The digestion, thus the absorption, of nutrients containing cellulose is harder to achieve if this architectural structure is maintained.
Digestion
Intracellular metabolic pathways for carbohydrates use monosaccharides as their substrates. A sugar is absorbed by the enterocyte when it is in the monosaccharide form. The digestion of various sugars occurs at different levels in the gastrointestinal system and by a multitude of enzymes. The end product is the release of simple sugars or monosaccharides that will be used for many metabolic functions, mainly energy storage or production.
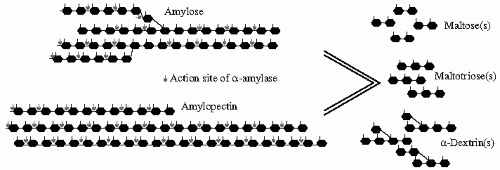
The digestive process begins in the mouth with the salivary amylase that is similar in function with the pancreatic amylase secreted in the duodenum. They are both specific for α (1-4) glycosidic bonds present inside the polysaccharide chain but spare other α linkages; that is, α (1-6), terminal α (1-4), and α (1-4) adjacent to a branching point. The amylase digestion of a polysaccharide will yield shorter chain polysaccharides, oligosaccharides, and disaccharides. For example, the digestion of starch by amylase will result in a group of different lengths’ sugars containing maltose (a disaccharide: α-1,4 glucose-glucose), maltotriose (an oligosaccharide: α-1,4 glucose-glucose-glucose), and α-dextrins (α-dextrin = shorter chain polysaccharide: α-1,6 glucose-glucose-(α-1,4(glucose-glucose)
n))
(
Fig. 1-5). When the mixture of carbohydrates and amylase reach the stomach, the acidic pH inhibits the hydrolytic activity of the enzyme. This activity is restored in the duodenum by the pancreatic secretions rich in bicarbonate and amylase. Further digestion into monosaccharides occurs just outside the enterocyte in the intestinal lumen by another group of enzymes called oligosaccharidases. These enzymes, secreted locally, break the glycosidic bonds present in the di- and oligosaccharides. The different human oligosaccharidases, the site of their action, their substrates, and the products of their digestive processes are summarized in
Table 1-1. As an overall result, this brush border digestion will transform a mixture of different sugars ingested into glucose, galactose, and fructose. These three monosaccharides will constitute the carbohydrate reservoir that will be absorbed, and accordingly utilized, in majority before the remains of a meal reaches the terminal part of the ileum.
Bioavailability
As one can concur from the preceding paragraph, the range of action for the digestive enzymes is restricted to few types of sugar connections. Likewise, the structural complexity of the carbohydrate is a limiting factor for the enzyme’s access to its site of action. Consequently, not all sugars are digestible and absorbable. Also, incomplete absorption might occur for others even after digestion. The bioavailability of a sugar is the production of this digestive and absorptive process.
By definition, fibers are mainly polysaccharides resistant to digestion and absorption. Cellulose (polysaccharide of β (1-4) linear glucose) is undigestible by humans. The main reason being that amylase, the only polysaccharidase in the intestinal tract, is specific for α (1-4) sugars. On the other hand, the table sugar sucrose (disaccharide: α (1-2) glucose-fructose) is completely hydrolyzed by sucrase (
Table 1-1) and totally absorbed. Starches from different sources have different contents and complexities of their macromolecules. Hence, each undergoes a different rate of digestion. A higher ratio of amylose:amylpectin, that is, longer
chain length of the amylose, slows the in vitro digestive rate of starch. Likewise, a higher content of α (1-6) bonding in the amylopectin molecule, meaning more branching points, has a similar effect. These characteristics will actually influence the physiologic changes that follow meal consumption. Rice varieties with similar fiber content were tested in healthy human volunteers; brands with higher amylose fractions induced lower postprandial glucose and insulin responses. Amylose content of starch was more beneficial than amylopectin in generating lower post-meal glucose peak and total quantity of insulin secretion while maintaining a comparable summed glucose measured postprandially. Although the impact of amylose/amylopectin ratio on the human metabolic responses was sometimes reported as marginal, diets high in amylose stimulated a lower glucose peak and more satiety than low amylose:amylopectin ratio diets. According to the rate and extent of in vitro digestion, starch is classified into three major fractions: (1) rapidly digestible starch, the portion of starch digested within the first 20 min of incubation; (2) slowly digestible starch, the portion of starch digested from 20 to 120 min; and (3) resistant starch, the remaining portion that cannot be further digested. Resistant starch is further subdivided into three categories according to the reason for resistance to digestion. Resistant starch corresponds to the sum of starch and degradation products not absorbed in the small intestine of healthy individuals.
In addition to lowering blood glucose levels, the undigested carbohydrates from dietary fibers and resistant starch reaching the colon undergo fermentation into short chain fatty acids by the resident bacteria of the colonic mucosa. Colonic carbohydrate fermentation enhances the suppression of postprandial hepatic glucose production and free fatty acids rise induced by oral glucose in humans. Food containing complete fibers induces a higher level of satiety and a lower spike of postprandial insulin than disrupted fibers diet, which may decrease overnutrition. Higher fiber meals consumed the night before have even a delayed favorable effect on reducing postprandial glycemia and free fatty acids the next morning, called second meal effect.
Glycemic Index and Glycemic Load
It becomes evident, from a nutritional concept, that the chemical classification of sugars (as simple vs. complex, digestible vs. nondigestible) does not permit sufficient insight into the sugar content and the physiologic outcome. In this regard, the same amounts of carbohydrates in various foods produce quite different blood glucose curves after ingestion. The “glycemic index” represents the quantification of the glycemic response to carbohydrates in different foods. The concept was defined in 1981 by Jenkins et al. The glycemic index for a specific food is calculated as the area under the 2-h blood glucose response curve expressed as a percentage of the area after taking the same amount of carbohydrate content as pure glucose. White bread can be used as the reference food instead of pure glucose and the postprandial blood sampling can be extended to 3 hours. The “glycemic load,” defined as the mathematical product of the glycemic index of a food by its
carbohydrate content, gives a global indication about the glucose response and insulin demand induced by a food serving. High glycemic index values are above 70, medium readings are from 55 to 70, and low values fall below 55, the reference food value is set to be 100. A glycemic load of 20 or more is high, between 11 and 19 is medium, and 10 or less is low. The classification of food according to the glycemic index places many variables in interaction. The type and quantity of the sugar measured in a serving, as reported on food labeling, are not enough to project the caloric outcome in vivo. Digestion, absorption, and usage differ between individuals and among the same individual at various metabolic states. Tailoring food intake according to the glycemic index could mean a better feedback, adaptable to physiologic response, than just looking at caloric content. In fact, healthy adolescents fed either a low glycemic index meal replacement (consisting of a shake and a nutrition bar) or a low glycemic index whole food and tested prospectively showed significantly decreased glucose and insulin response when compared to high glycemic index meal replacement. Also, beside a similar caloric intake between all groups, satiety was prolonged in the low glycemic index group. In a similar study, rapid absorption of glucose in the case of high glycemic index food promoted excessive food intake in obese adolescents. In another prospective study, obese subjects were given two types of energy restricted diets. The diets differed in the glycemic index content but matched in the level of energy limitation (-30% in relation to energy expenditure). At the end of the 8 weeks’ dietary intervention, the lower glycemic index group significantly lost more weight. Besides, at 1 year follow-up, weight regain was statistically significant only in the high glycemic index group.
Glycemic Response and Health Outcome
Since its introduction in 1981, the practice of the novel food sorting according to the glycemic index/load gained huge momentum. Reports and studies examined the various associations between glycemic responses and diseases’ risks. Most of these projects were designed to look at the direct and indirect results of food stratification according to the glycemic index or load in terms of weight change, diabetes, lipid profile, cardiovascular risk, and cancer. Possible mechanistic pathways are linked to hyperinsulinemia with other hormonal changes, lipid metabolism, and local inflammatory changes taking place in the intestines.
Many studies have reported that overweight and obese adults lose more weight if they consume a low glycemic index/load diet. In that group of the population, weight loss may be favored in overweight persons with higher insulin secretion or females with sedentary lifestyle. As for the prevention of obesity in healthy adults, positive association between low glycemic index/load diets and decreased risk of obesity did not result in strong evidence. The risk of type 2 diabetes was found to be associated with high glycemic index diets in various prospectively performed studies. At the same time, other reports denoted a higher protective role for the fiber content against the development of diabetes and not the glycemic response per se. Beneficial changes in the cardiovascular
risk factors, high density lipoprotein, and triglyceride levels were observed to be positively correlated to low glycemic index or load diets in numerous epidemiological studies. Even though, few have reported a weak or no association between glycemic index/load and cardiovascular risks.
The controversy between different reports is even more important when it comes to linking the glycemic index and glycemic load on one side, to the risk of various cancers on the other side. Some studies reported significant association of high glycemic index or load diets with colorectal cancer, many others did not. While all of the aforementioned reports that found a lack of association with colorectal cancer studied female subjects, few reported a possible beneficial outcome for low glycemic index or load diets in males. Breast carcinogenesis was not tied to glycemic index/load according to many authors. For others the association was significant among subpopulations of studied women in relation to their menopausal state or body weight. In a similar manner, for some studies, endometrial cancer was positively linked to glycemic index or load in women depending on their body mass index and/or hormonal replacement therapy. Many studies did not find a substantial increase in the risk of pancreatic cancer with higher glycemic diets. A possible beneficial effect was described among obese females.
It becomes obvious that outlining a straight forward conclusion regarding the health outcomes of the glycemic response food classification is still early at this stage. As much as the classification of food according to the inherent glycemic response appears more physiologically adaptable, scrutiny regarding the methodology and the variability of the testing used are also to be accounted for. Metabolic changes that occur in each individual will induce various blood sugar responses after a similar meal on different occasions. As a matter of fact, the coefficient of variation for the glycemic index is actually higher intra-individually than interindividually at 42.8% and 17.8%, respectively. These measures were done in healthy subjects who consumed white bread as the test meal and glucose as the reference meal on three occasions. Hätönen et al. tested the accuracy of capillary versus venous blood sampling and pure glucose versus white bread usage as the reference food. White bread as a reference produced glycemic index values 1.3 times higher than glucose as a reference food. The reference test, whether it is glucose or white bread, should be performed at least twice. The coefficients of variations based on capillary samples were significantly lower than those based on venous samples. The better accuracy of capillary testing was also described by other reports. Adding to this, the glycemic response would change for a single food type depending on various interaction(s); for example, the presence of fibers, the cooking methods, and the origins of the crops. A practical example is out-lined in
Table 1-2 that summarizes the glycemic indexes and the glycemic loads of certain common foods measured in normal subjects. Clinical measurements of the glycemic index are very difficult in large samples. Thus, all of the prospectively performed analyses for large cohorts categorize diets according to food questionnaires answered by the enrolled subjects. This is done at baseline and at different time points during the follow-up evaluations
for some studies. Taking into account the high variability of the glycemic response, the analysis of the results can be largely biased by methodological inaccuracies of the dietary assessment tool.