Fig. 13.1
Schematic describing the physics underlying magnetic resonance imaging
To receive signal, prostate MRI requires a pelvic phased-array coil laid directly across the patient’s pelvis. This can be supplemented with an optional endorectal coil (ERC) (Fig. 13.2). The ERC is particularly useful for 1.5-T MRI but is less necessary for 3.0 T. The ERC is placed transrectally. Due to its close proximity to the prostate, it can augment the amount of signal available to generate the image. While it is clear that the highest quality MRI results from the combination of a pelvic phased-array coil and an ERC at 3.0 T (Fig. 13.3), a measurable clinical benefit of adding the ERC to the pelvic coil has yet to be proven [10]. Literature comparing cancer staging with T2-weighted imaging at 3.0 T with and without an ERC is conflicting [11, 12]. In addition to the unproven clinical benefit, use of an ERC is more time consuming, expensive, uncomfortable for the patient; requires trained staff to place it; and can introduce magnetic susceptibility and motion-related artifacts. As a result, use of an ERC varies across institutions and study protocols. For 3.0-T prostate MRI at UCLA, an ERC is used for staging purposes prior to prostatectomy but omitted when using MRI for cancer detection prior to targeted biopsy.
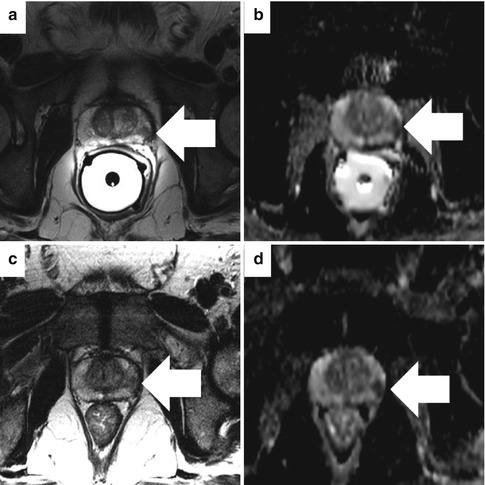
Fig. 13.2
Photographs of sample MRI scanner (a) and external phased-array coil (b) used for all prostate MRI examinations. An optional endorectal coil (c) can be inserted into the rectum and inflated with perfluorocarbon to achieve improved signal to noise (© Siemens Healthcare 2014. Used with permission)
Fig. 13.3
Comparison of imaging with (a, b) and without (c, d) an endorectal coil at 3 T. An axial T2-weighted image (a) and ADC map (b) show a discrete focus of low signal in the left peripheral prostate with a broad base of contact with the capsule (arrow) but preservation of the dark line representing the capsule itself. This is characteristic of cancer confined within the prostate. The same axial T2-weighted image (c) and ADC map (d) without the endorectal coil show the low-signal area, but the capsule is less well resolved. Focally restricted diffusion is evident on both acquisitions
MR images are typically described as being T1 or T2 weighted. Weighting depends on how energy is imparted through the physics of the pulse sequence. T1-weighted images are generated by the time to return to equilibrium in the z-axis, while T2-weighted images are produced by the time to return to equilibrium in the xy-axis. Practically speaking, on T1-weighted images fluid is low signal and appears dark. On T2-weighted MR images, fluid is high signal and appears bright.
Multiparametric MR Imaging Techniques
T2-Weighted Imaging
T2-weighted imaging provides information on prostate morphology, internal structure (zonal anatomy), and cancer margins. It is typically acquired in multiple planes at high resolution using a narrow image thickness (3–4 mm) [7]. The peripheral zone (PZ) can be clearly differentiated from the central gland (CG), which includes the transition zone (TZ) and the central zone. The PZ classically has homogenous high signal intensity. In contrast, the CG has lower signal intensity and is often markedly heterogeneous in appearance. The urethra, seminal vesicles, and verumontanum can also be visualized on T2-weighted MRI (Fig. 13.4).
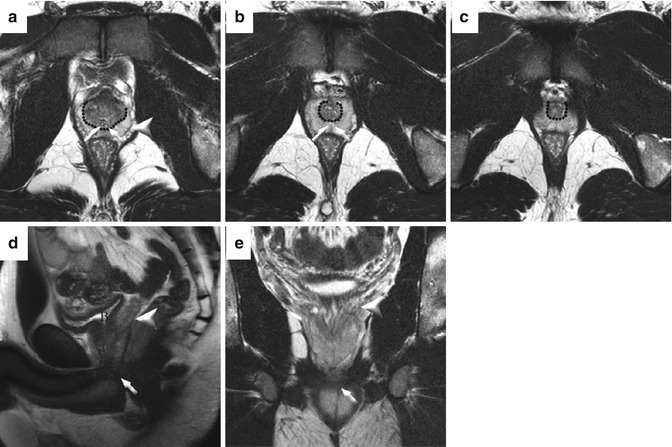
Fig. 13.4
Normal prostate anatomy on T2-weighted sequences in a healthy 31-year-old. Transaxial images at the base (a), midgland (b), and apex (c). The dotted line outlines the “pseudocapsule” which is the T2 hypointense boundary between the heterogeneous central gland (composed of both central and transitional zones) and T2 hyperintense peripheral zone. The capsule (arrowhead) is a low T2 signal-intensity rim at the junction of the prostate and periprostatic fat. The ejaculatory ducts are denoted by oblique arrows. Sagittal (d) and coronal (e) T2W images show the hyperintense seminal vesicles (arrowheads) and low-signal urogenital diaphragm (oblique arrows). The bladder (B) is empty
Seventy percent of all prostate cancers originate in the peripheral zone. These cancers classically appear on T2-weighted MRI as round or ill-defined, low-signal-intensity (dark) foci [13]. This appearance is not always present as some cancers are isointense. In addition, specificity is limited. Prostatic atrophy, prior prostatitis, hemorrhage after biopsy, or posttreatment changes can have variable signal intensity in the PZ and mimic cancer (Figs. 13.5 and 13.6) [10]. Non-contrast T1-weighted images are useful to rule out biopsy-related hemorrhage as the cause of low signal intensity in the PZ [10]. As the appearance of post-biopsy changes could mask the presence prostate cancer on T2-weighted imaging, it is customary to delay MRI for at least 4–6 weeks after biopsy [14]. Others recommend a longer interval of >8 weeks [15].
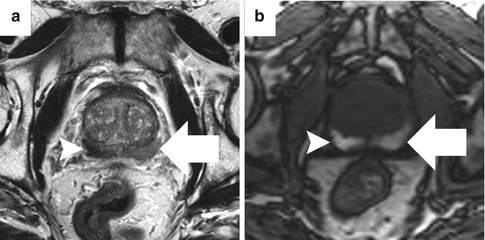
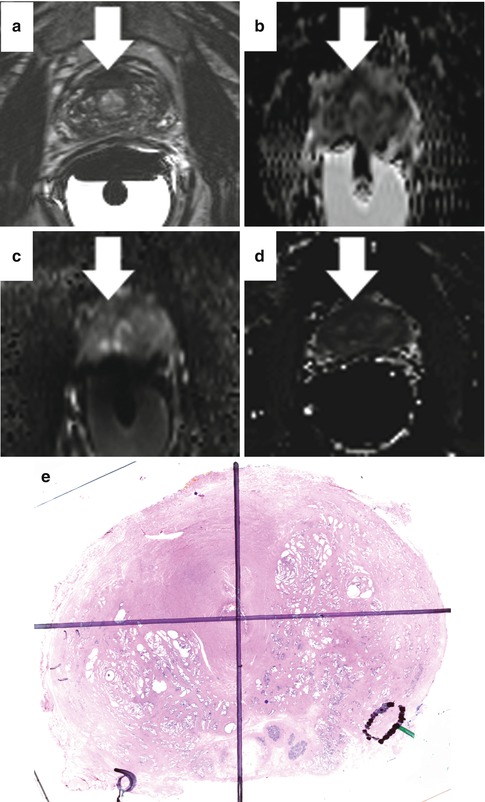
Fig. 13.5
Abnormal T2 signal from hemorrhage artifact. Low T2 signal intensity within bilateral peripheral zones (a), right (arrowhead) greater than left (arrow), corresponds to regions of T1 shortening, consistent with post-biopsy hemorrhage (b)
Fig. 13.6
T2-weighted images (a) show an asymmetric hypointense “mass” in the anterior fibromuscular stroma with bulges into the transitional zone (arrow). Low signal on the ADC map (b) suggests abnormal cellularity. However, the DWI (c) shows low signal, signifying that the low signal on the ADC map is from lack of water protons rather than truly restricted diffusion. The perfusion map (d) confirms relative hypoperfusion, consistent with hypertrophic anterior fibromuscular stroma, confirmed on whole-mount histology (e)
The high resolution achieved with T2-weighted imaging proves useful for cancer staging (Fig. 13.7). Extracapsular extension (ECE) can manifest itself as direct tumor extension into the periprostatic fat, an interruption of the thin black line representing the prostate capsule, asymmetric capsular bulge with irregular margins, obliteration of the rectoprostatic angle, or asymmetry of the neurovascular bundle (NVB). Seminal vesicle invasion (SVI) appears as low-signal foci that directly extend from the tumor at the prostatic base into the seminal vesicles. This differs markedly from the uniform high signal of normal seminal vesicles.
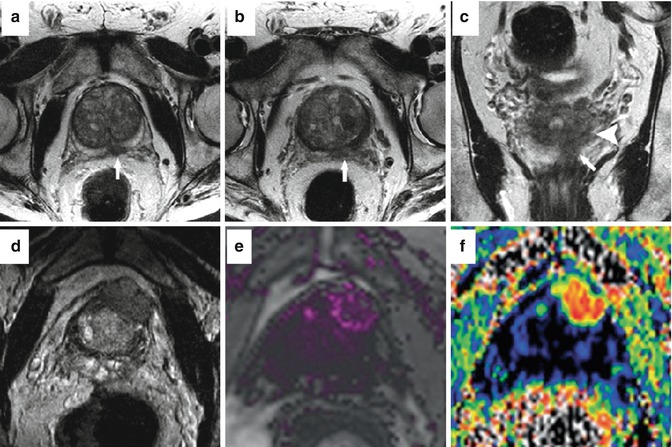
Fig. 13.7
Sample cases of staging with multiparametric MRI at 3 T. In patient #1, an ill-defined low-signal mass on the left shows irregularity of the prostate capsule on axial images and extends from the midgland (a) to the base (b) where it abuts the seminal vesicles. The mass (arrow) also extends to the seminal vesicles (arrowhead) on coronal images (b). This was confirmed as a pT3b Gleason 4 + 5 adenocarcinoma with ECE at prostatectomy. In patient #2, (d) axial T2-weighted image shows a large mass with marked extraprostatic extension arising from the left, anterior prostate. Corresponding abnormalities were seen on dynamic contrast-enhanced imaging (e) and the ADC map (f)
Cancers in the central gland are more difficult to detect because of the heterogenous appearance of the normal central gland on MRI. Benign prostatic hyperplasia (BPH), a ubiquitous finding in aging men, often mimics cancer on MRI. When cancers are visible in the central gland, they typically appear as a homogenous low-signal-intensity lesion with indistinct, irregular margins that often invades the pseudocapsule [16].
A recent meta-analysis of 19 articles found T2-weighted imaging alone to have a sensitivity of 60 %, specificity of 76 %, and area under the ROC curve of 0.75 for cancer detection [17]. This compilation of the data obscures the great variability in performance of T2-weighted imaging across different studies. In a 2009 review article, Turkbey et al. concluded that wide ranges in sensitivity (22–85 %) and specificity (50–99 %) stem from differences in equipment, patient selection, experience, and methodology for pathologic correlation [10]. The authors concisely summarized the difficulty of performing correlation studies of MRI and histopathology due to differences in alignment of MRI and histologic sections. As a result, excessively strict interpretation of MRI and pathology correlation without considering the effect of misregistration can lead to sensitivity/specificity outcomes that are too low, while overly lenient interpretation can overestimate the ability of MRI to detect prostate cancers [10]. This issue is pertinent to all studies evaluating the performance of mpMRI.
Given the limitations of T2-weighted imaging, it became clear that additional sequences were needed to more accurately identify and characterize localized prostate cancer. This realization led to the development of functional parameters (diffusion-weighted imaging, dynamic contrast-enhanced imaging, and MR spectroscopy) that have enabled substantial improvement in the utility of mpMRI.
Diffusion-Weighted Imaging
In diffusion-weighted imaging (DWI), image contrast is generated by differences in the Brownian motion of water molecules within different tissues. While water molecules in a container outside the body are in constant, uninhibited motion, the movement of water molecules in biologic tissues is restricted because of interactions with cell membranes and macromolecules [18]. The motion of water molecules is more restricted in tissues with high cellular density and intact cell membranes. The high cellular density and more complex intracellular microstructure of tumors restrict water diffusion in the tissue, a phenomenon that is detectible as a bright signal on DWI.
Diffusion-weighted gradients are applied to water protons, and the resultant signal is related to the ability of water protons to move freely in space. The “b-value” (in s/mm2) of DWI is a function of the strength of the diffusion gradient. Low b-values measure water movement over a large length (i.e., capillary perfusion). High b-values measure water movement over a small length (i.e., within cells). The use of higher b-values (1,000–2,000 s/mm2) has been shown to improve prostate cancer detection [19, 20]. When at least two b-values are acquired, an apparent diffusion coefficient (ADC) map can be generated which displays the ADC value of each voxel. According to Barentsz, minimal requirements for generating ADC maps are b-values of 0, 100, and 800–1,000 and optimally a b-value of 500 would also be included [13]. The ADC map is especially useful for prostate cancer identification. Prostate cancer typically has a high signal intensity (bright) on DWI at high b-value and low signal intensity (dark) on ADC maps (Fig. 13.8).
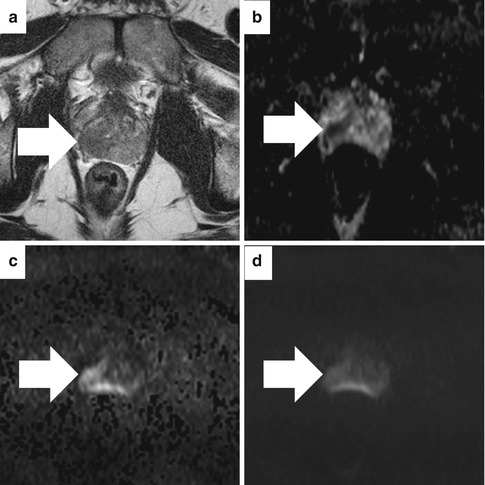
Fig. 13.8
Diffusion-weighted imaging (DWI) and apparent diffusion coefficient map on 3T magnet without endorectal coil in a patient with Gleason 5 + 4 pT3b adenocarcinoma at subsequent prostatectomy. On the axial T2-weighted image (a), a low-signal region (arrow) bulges the capsule. The corresponding apparent diffusion coefficient (ADC) map (b) shows low signal (0.938 × 10⁻³ mm2/s). The axial high b-value DWI (b = 1,400 s/mm2) image (c) shows asymmetric high signal (arrow) concordant with the ADC map. However, this lesion is less obvious on the lower b-value DWI (b = 800 s/mm2 image) (d)
DWI is exquisitely sensitive to motion artifact and is intrinsically a low SNR sequence that is affected by magnetic susceptibility effects which result in spatial distortion and signal loss [13]. This results in relatively low-resolution, “noisy” images. In spite of this, DWI is an essential part of mpMRI because of improved specificity, information about tumor aggressiveness, and correlation with the volume of the index lesion [13]. DWI is relatively easy to implement as acquisition time is short, and no exogenous contrast is required. It yields qualitative and quantitative information reflecting changes at a cellular level. As a result of its simplicity and added value, DWI should be included in all prostate MRI protocols.
Numerous publications have documented the value of DWI for prostate cancer imaging [17, 21–25]. A recent meta-analysis including data from 627 patients showed a sensitivity of 76 % and specificity of 82 % for the combination of DWI and T2-weighted imaging [25]. A separate meta-analysis further corroborated the value of adding DWI to T2-weighted imaging. The addition of DWI increased sensitivity from 60 to 70 % and specificity from 76 to 83 %. Notably, the area under the ROC curve was better for DWI alone than DWI + T2 (0.85 vs. 0.73), while sensitivity and specificity were comparable [17].
In addition to improving cancer detection, DWI also provides information about cancer aggressiveness. ADC values have been shown in multiple studies to be inversely correlated with Gleason score, the pathologic criteria that serves as the gold standard for predicting biologic behavior of prostate cancer [26–30]. Unfortunately, defining numerical ADC values to differentiate benign from malignant tissue that apply across institutions is difficult due to considerable inter-patient variability, overlap between ADC values for cancer and normal prostate, differences in scanner software and hardware, and a strong dependence between ADC and specific b-values used [7, 13, 31]. Standardization of protocols for image acquisition and data analysis is important to facilitate widespread adoption of DWI and enable accurate comparison of results from different institutions. Adoption of the imaging protocols proposed in the recently issued ESUR prostate MRI guidelines should help this effort [13].
Dynamic Contrast-Enhanced MRI
Dynamic contrast-enhanced (DCE) MRI is another functional sequence that contributes to diagnostic accuracy through improved sensitivity. DCE detects angiogenesis by measuring differences in blood flow between cancer and normal tissue. Classically, prostate cancer demonstrates rapid and intense contrast enhancement and rapid washout [32, 33].
DCE MRI most often consists of a series of fast T1-weighted sequences performed before and after rapid infusion of gadolinium contrast material [7, 13]. Interpretation can be qualitative, semiquantitative, or quantitative. Qualitative analysis includes either visual inspection of the images for areas that rapidly and intensely enhance or plotting kinetic curves of signal intensity vs. time. This method is simple, quick, and unlike other analytic methods does not require dedicated hardware or software [34]. Kinetic curve analysis is recommended in the recent ESUR guidelines [13]. However, simple comparison of pre- and post-contrast images is usually insufficient to detect prostate cancer because of the highly vascularized nature of the normal prostate [35]. Semiquantitative analysis involves calculation of kinetic parameters (time to peak enhancement, wash-in rate, wash-out rate) for each voxel. These parameters are then constructed into colorized maps overlaid on T2-weighted images (Fig. 13.9). Quantitative analysis uses pharmacokinetic models to determine the rate of exchange of contrast between blood and the extracellular space [36]. The quantitative vascular parameters K trans (transfer constant for contrast moving between blood plasma and extravascular space) and K ep (rate constant between extravascular space and blood plasma) have been shown to be elevated in tumors. Quantitative analysis is considered to be more resistant to variation in injection-related factors [36] and potentially more reproducible for indications such as monitoring response to therapy [37]. A preliminary study correlating DCE MRI and prostatectomy specimens in 45 men showed that quantitative and semiquantitative DCE parameters have the potential to discriminate low-grade from intermediate-grade and high-grade prostate cancer [38].
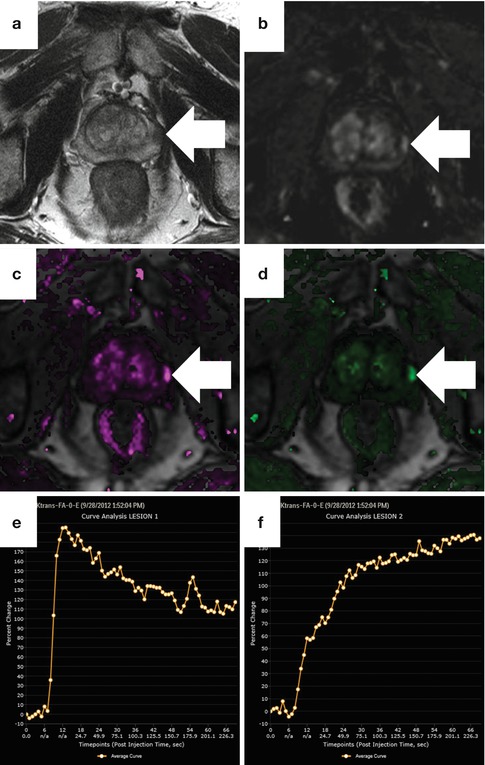
Fig. 13.9
Dynamic contrast-enhanced perfusion imaging obtained at 3 T with pharmacokinetic map and time-intensity curves in a patient with Gleason 3 + 4 cancer on MRI-US fusion targeted biopsy. On the axial T2-weighted image (a), a round focus of low signal (arrow) is suspicious. The corresponding dynamic subtraction image at 15 s after the arrival of contrast (b) shows early arrival of contrast, but this is more conspicuous on both the K trans (c) and K ep (d). Maps were generated using the iCAD VersaVue engine. A representative time-intensity curve of the tumor (e) shows a type III washout curve (rapid uptake and washout), whereas the normal peripheral gland (f) shows a type I progressive curve
MR Spectroscopic Imaging
Protons in different metabolites have unique resonant frequencies. MR-spectroscopic imaging (MRSI) makes use of these intrinsic differences to provide information about the relative concentration of various metabolites in tissues. In the case of prostate cancer, the metabolites of interest are citrate, choline, and creatine. Citrate, whose levels are higher in normal prostate tissue, serves as a marker of benign tissue. Choline, a key player in cell membrane synthesis, is elevated in malignant tissue [42]. The spectral profile of creatine overlaps that of choline so the two are measured together. This issue is insignificant given the relatively constant levels of tissue creatine [13]. After post-processing with commercially available software, the spectral tracings measuring the metabolite concentrations are overlaid on the T2-weighted images (Fig. 13.10). Analysis is either qualitative (compare peak heights visually) or quantitative. For quantitative analysis, a choline + creatine to citrate ((Cho + Cr)/Cit) ratio is calculated. The ratio is higher in cancer and the elevation of the ratio is used to determine the likelihood of cancer. Furthermore, higher (Cho + Cr)/Cit ratios are associated with more aggressive tumors.
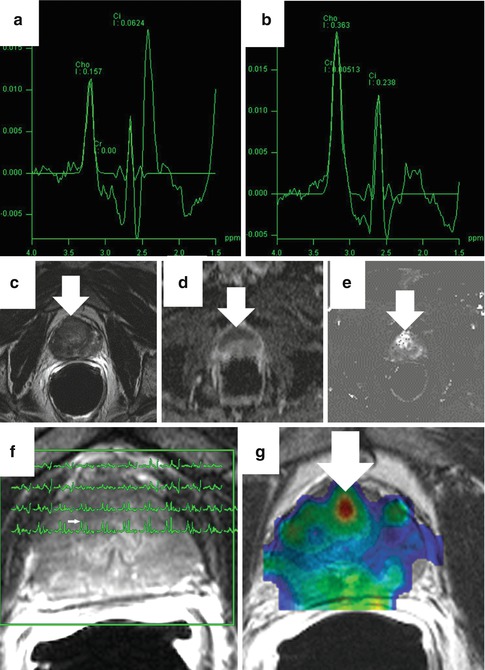
Fig. 13.10
Magnetic resonance spectroscopic imaging (MRSI). Panel (a) shows a sample normal spectra (citrate peak higher than choline) while (b) shows a spectra characteristic of cancer (choline peak higher than citrate). In a representative case, an axial T2-weighted image (c) is equivocal with abnormal signal throughout. The corresponding ADC (d) and K trans (e) maps are abnormal in the anterior prostate. The spectral overlay (f) shows elevation of the choline peak to the left of the citrate peak for voxels corresponding to the low-signal area (arrow). The creatine + choline/citrate ratio color map (g) is also focally abnormal
In prostate MRSI exams, imaging is performed in a volume that covers the whole prostate. The prostate is divided into a three-dimensional grid of multiple voxels. To perform MRSI an ERC is mandatory at 1.5 T and strongly recommended at 3 T [7]. The ERC makes it possible to perform MRSI spectra of voxels <1 cm3. The (Cho + Cr)/Cit ratio is calculated for each voxel.
MRSI can add information about both the presence of cancer and its aggressiveness [43–48]. It is limited by poor spatial resolution which precludes its usefulness for staging. A prospective, multicenter study done by the American College of Radiology (ACR) imaging network enrolled 100 men undergoing prostate mpMRI with MRSI at 1.5 T. This study showed equivalent accuracy for T2WI with and without MRSI [49]. MRSI is also time consuming (imaging time and placement of ERC) and technically challenging so many centers do not include it in mpMRI protocols. In the recent ESUR guidelines, MRSI is listed as optional [13].
Interpretation and Reporting of Prostate MRI
Convincing evidence exists that adding functional sequences to T2-weighted imaging improves the performance of MRI in detecting localized prostate cancer. Specifically, DWI and MRSI add to specificity, while DCE can improve sensitivity [13]. The best way to summarize and concisely report the results of mpMRI is not always clear. Large, aggressive cancers often cause all parameters to appear abnormal (Fig. 13.11). In these cases, reporting the result is not difficult. However, in the era of PSA screening, the majority of patients in the United States present with smaller, lower-grade lesions. In these cases, mpMRI parameters often conflict (Fig. 13.12). In this situation, interpretation is more difficult. As a result, efforts have been made to standardize interpretation and reporting of prostate MRI.
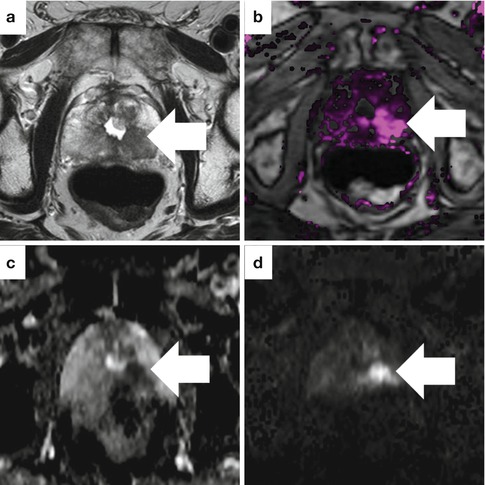
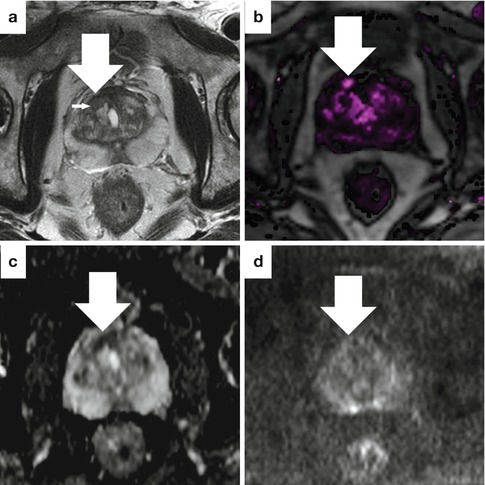
Fig. 13.11
Sample case where all MRI parameters are abnormal in an 81-year-old man with high-grade prostate cancer and a prior TURP. The axial T2-weighted image (a), dynamic contrast-enhanced image (b), ADC map (c), and high b-value DWI (d) all show a suspicious area in the left, posterior prostate
Fig. 13.12
Sample case with conflicting findings on mpMRI in a 58-year-old man with a PSA of 2.8 ng/ml and a strong family history. The axial T2-weighted image (a) shows a focus of low signal (large arrow) with a sharp, low-signal border (small arrow), typical of a benign prostatic hyperplasia (BPH) nodule. Perfusion at this site is focally increased (b), but the ADC map (c) and DWI (d) are only moderately abnormal and also consistent with BPH. This was graded as moderately suspicious overall. Targeted biopsies subsequently revealed low-volume Gleason 3 + 4 prostate cancer
The European Society of Urogenital Radiologists (ESUR) recently met and released a report “to promulgate high-quality MRI in acquisition and evaluation” [13]. They initially addressed MRI acquisition and recommended three different protocols: detection, staging, and bones/nodes. The detection protocol includes T2WI, DWI, and DCE of the prostate only +/− MRSI. This protocol takes <30 min and uses no ERC unless MRSI is included. The staging protocol is optimized to evaluate for minimal extracapsular extension. It includes the same sequences as the detection protocol. In this case an ERC is considered preferable, and the exam takes approximately 45 min. The bones/nodes protocol is designed to detect regional metastasis in men with high-risk disease. It is done separately from the other two protocols because it is unnecessary in most men. It includes T1WI, T2WI, and DWI and takes approximately 30 min. Traditionally, staging of the bones and nodes is performed with a pelvic CT and bone scan rather than MRI. The clinical indication for the detection and staging protocols has not been clearly defined, and the two different protocols have yet to be widely adopted. Most centers in the United States choose to perform MRI similar to the ESUR detection protocol (no ERC) or similar to the staging protocol (with ERC) in all patients.
In interpreting the MRI, the authors of the ESUR report proposed a system termed “prostate imaging reporting and data systems” or “PI-RADS”; this is analogous to the BI-RADS system used in breast imaging interpretation. Following PI-RADS, each parameter is assigned a score from 1 to 5 that reflects the degree of abnormality. The prostate is divided into anatomic regions (minimum of 16, but 27 is considered optimal), and lesions are assigned to these regions. The report includes a score relaying the probability of cancer and its aggression, the cancer location, and the probability of extracapsular extension for all identified lesions. The overall score for each lesion is a simple compilation of the component scores from each mpMRI parameter. A targeted biopsy study validating the ESUR scoring system was recently published [50]. However, compilation of component scores may be overly simplistic as it is widely recognized that some parameters of mpMRI impart more valuable information than others. In the view of many experts, diffusion-weighted imaging is the most powerful single parameter in determining the confidence that a lesion is cancer and the degree to which it is clinically significant. The best method to weigh the individual scores to make an overall score that accurately reflects the cancer’s actual histopathology has yet to be defined.
Capabilities of Multiparametric Prostate MRI
Lesion Localization and Size
In a frequently quoted study correlating MRI with prostatectomy histopathology in 45 men with known prostate cancer who underwent mpMRI (T2WI, DWI, DCE, and MRSI) at 3 T with an ERC prior to prostatectomy, Turkbey et al. found a 98 % positive predictive value for prostate cancer detection [40]. In the study, the sensitivity was higher for tumors larger than 5 mm in diameter and for those with a Gleason score >7. In order to overcome the problem described previously with studies correlating MRI and whole-mount prostatectomy specimens, the prostates were cut in customized molds designed to align the slices from MRI with those from the surgical specimen.
Most publications that include a comparison of MRI performance in the peripheral zone to that in the central gland conclude that outcomes are superior in the peripheral zone. However, results from specialized centers with expertise in prostate MRI have also been excellent in the central gland [22, 40]. It is unknown if centers with less expertise can replicate these results in the central gland. MRI has also been demonstrated to perform better for imaging large, high-grade lesions when compared to smaller lesions or those with intermixed normal and malignant tissue [40, 51].
Despite the ongoing improvements in MRI, some cancers are missed. One recent study evaluated the histopathologic differences between cancers seen on MRI and those that were missed [52]. On DWI, Gleason score and a solid tumor growth pattern were independent predictors of tumor identification on multivariate analysis. For T2WI, tumor size and Gleason score impacted identification, but this finding was no longer significant on multivariable analysis. For DCE, identification of cancer was associated with intermixed benign epithelium, loose stroma, and high malignant epithelium-to-stroma ratio. Whether the ability to visualize tumors on MRI is an independent predictor of clinical outcome has yet to be determined.
In the authors’ experience, the ability of MRI to accurately predict tumor size at the time of prostatectomy is limited. This is likely due to the infiltrative nature of many prostate cancers in which fingerlike projections are sent out from the main tumor that are difficult to identify on MRI. Still, one recent report comparing MRI with prostatectomy specimens showed a positive correlation between MRI tumor volume and histopathology tumor volume [53]. Continued improvement in the ability to accurately determine cancer size on MRI is necessary to improve the clinical usefulness of MRI for applications such as focal therapy and patient selection for active surveillance.
Assessment of Cancer Aggressiveness
More important than the identification of all prostate cancers is the ability to assess cancer aggressiveness and to selectively diagnose the most clinically significant cancers. Accurate assessment of Gleason score on biopsy is the most important factor in determining cancer aggressiveness. Using current methods incorporating transrectal ultrasound (TRUS) to guide systematic biopsy, accurate risk stratification is lacking. Rates of Gleason score upgrading from biopsy to prostatectomy range from 25 to 40 % [54]. This uncertainty plays a major role in underutilization of active surveillance. A noninvasive imaging modality that can more accurately assess cancer risk is highly desirable.
Among all parameters of mpMRI, DWI performs the best in assessing disease aggressiveness. Higher-grade cancers tend to have higher cellular density and therefore display more restricted diffusion. Numerous recent publications have reported the inverse correlation between Gleason score and ADC value [26, 27, 29, 55–57]. However, developing ADC value cutoffs to differentiate low- and high-grade cancer that can be applied across institutions has not been possible due to variability in ADC values between patients and differences in the way scans are performed.
In some cases, the ability of MRI alone to determine cancer aggressiveness exceeds that of biopsy results (Fig. 13.13). At the same time, MRI can miss some clinically significant cancers, overestimate disease severity for others, and classify lesions as high-risk cancer that are actually benign on prostatectomy pathology. Because of these limitations, a well-performed biopsy remains necessary to confirm the MRI.
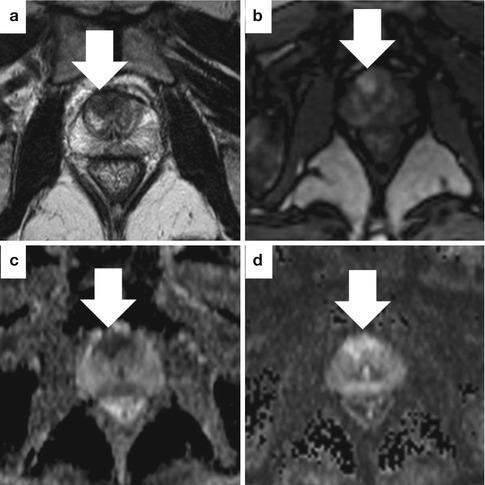
Fig. 13.13
Sample case where a highly suspicious MRI was more informative than biopsy. This 65-year-old man with a rapidly rising PSA underwent MRI following negative systematic biopsies. The axial T2-weighted image (a) shows a low-signal focus with irregular borders in the anterior central gland (arrow). The lesion shows early enhancement with contrast on DCE (b). ADC (c) and DWI (d) maps show increased perfusion and highly restricted diffusion. Targeted biopsy showed high-volume, low-grade cancer (Gleason 3 + 3). Repeat targeted biopsy 6 months later showed Gleason 3 + 5 cancer. Pathology at prostatectomy was Gleason 4 + 3 with tertiary pattern 5
Cancer Staging
Accurate local staging requires information about cancer volume, laterality, extraprostatic extension (EPE), and presence of bony or nodal metastases. Prior to MRI, staging of localized prostate cancer was limited to a digital rectal exam, a test that proves unreliable in determining the extent of cancer in the prostate. Nomograms were developed incorporating PSA, DRE, and biopsy result to predict the presence of cancer spread outside the prostate. Such extraprostatic extension of cancer results in increased rates of cancer recurrence. Knowledge of this prior to prostatectomy enables the surgeon to modify the surgical technique to remove more tissue in that area and reduce the change of leaving prostate cancer.
In a small study involving 27 subjects with radical prostatectomy pathology as the gold standard, MRI was shown to perform better than a commonly used nomogram (Partin tables) in discriminating the 21 men with organ-confined disease from the 6 with extracapsular extension [58]. The most recent study of mpMRI for evaluation of EPE involved 183 men divided into low-, intermediate-, and high-risk groups based on the preoperative d’Amico criteria [59] and compared the MRI result (3 T with ERC using T2WI, DWI, and DCE) to the prostatectomy specimen for each group. The staging accuracy of mpMRI was 73.8 % (PPV 84.1 %, NPV 68.3 %). The PPV was best in the high-risk group (88.8 %), while the NPV was best in the low-risk group (87.7 %). Overall, when including clinical stage, PSA, biopsy Gleason score, and risk classification in a multivariate model, mpMRI (OR 10.3, 95 % CI 4.4–24.2) was the best preoperative predictor of extraprostatic extension [60]. Whether this result can be reproduced in a center with less prostate MRI experience remains to be seen.
The accuracy of staging is highly dependent on the skill and experience of the radiologist. Renard-Penna et al. compared the 1.5-T mpMRI result (T2, DCE, no DWI, no ERC) to the prostatectomy specimen in a prospective study of 101 patients. Two different radiologists with different levels of experience (Reader 1: 7 years in prostate imaging, Reader 2: <1 year) independently interpreted the studies. They found an AUC for Reader 1 of 0.895 (PPV 72 %, NPV 96 %) and an AUC of 0.687 (PPV 50 %, NPV 89 %) for Reader 2. The K-index of interobserver agreement was just 0.56. This difference highlights the importance of a skilled reader [61].
< div class='tao-gold-member'>
Only gold members can continue reading. Log In or Register to continue
Related posts:
 Optical Coherence Tomography for Prostate Cancer and Beyond
 Endoscopic Fluorescence Imaging of Bladder Cancer: Photodynamic Diagnosis and Confocal Laser Endomicroscopy
 Fluorescence Image-Guided Robotic Surgery
 Multiphoton Microscopy in Urologic Surgery
 Augmented Reality for Percutaneous Renal Interventions
 Ultrasound-Guided Prostate Cryotherapy
Stay updated, free articles. Join our Telegram channel

Full access? Get Clinical Tree


