Fig. 1 a, b
a Normal prostate of a 30-year-old man. The transition zone (TZ) is still highly localized around the urethra. It is surrounded by the central zone (CZ) in the basal segments and by fibromuscular tissue (FM). The majority of the prostate is composed of the peripheral zone (PZ). b Nodular changes in benign prostate hyperplasia in an older patient enlarge the transition zone with consecutive compression of central and peripheral zones
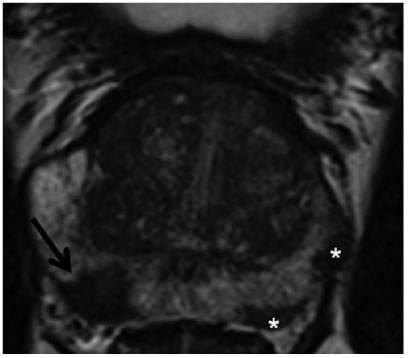
Fig. 2
Prostate cancer of the peripheral zone: Axial T2-weighted turbo- spin-echo (TSE) sequence with a hypointense lesion on the right side in the peripheral zone (arrow). After targeted biopsy under magnetic resonance imaging (MRI) guidance, an acinar prostate adenocarcinoma with a Gleason score of 3+4=7 was detected. The additional, smaller foci on the left side of the peripheral zone should also be mentioned (*)
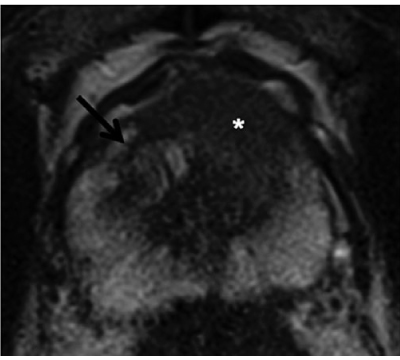
Fig. 3
Prostate cancer of the transition zone: Axial T2-weighted turbo- spin-echo (TSE) with homogeneously hypointense lesion ventral left paramedian (*). Whereas the benign hyperplastic nodule has a distinct hypointense border on the right in the transition zone (arrow), the border around the focus is unclear (erased charcoal sign). There is a ventral protrusion in the contour of the cancer
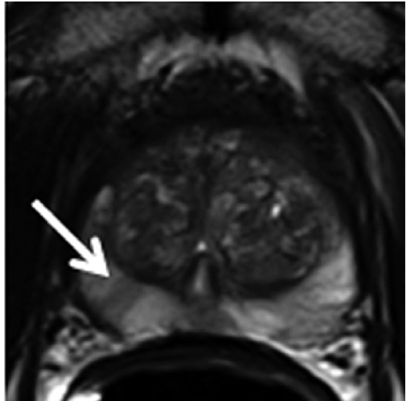
Fig. 4
Prostatitis: Axial T2-weighted turbo-spin-echo (TSE) with slightly hypointense, striated changes on both sides (arrow), diagnosed in histology as chronic prostatitis
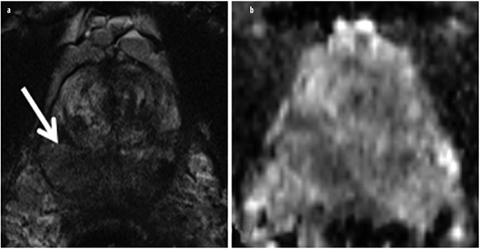
Fig. 5 a, b
Granulomatous prostatitis. a Axial T2-weighted turbo-spin-echo (TSE) and b corresponding apparent diffusion coefficient (ADC) map of a patient with prostate-specific-antigen (PSA) values between 6-8 ng/ml and three transrectal ultrasound (US)-guided biopsies without detecting cancer. The extensive and partially significantly T2-weighted hypointense changes (arrow) were diagnosed as granulomatous prostatitis after targeted magnetic resonance imaging (MRI)-guided biopsy. The finding in T2-weighted imaging would also be consistent with imaging of an advanced, diffusely growing prostate cancer
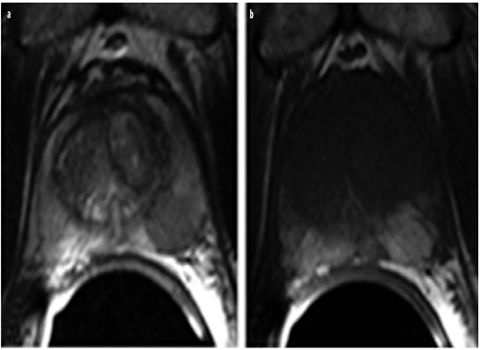
Fig. 6 a, b
Postpuncture bleeding. a Bleeding can be mistaken for prostate cancer in T2-weighted turbo-spin-echo magnetic resonance imaging (TSE-MRI) due to its hypointense appearance. b Hyperintense postpuncture hemorrhagic changes can be detected on both sides in the peripheral zone in the corresponding axial T1-weighted TSE slice
Diffusion-Weighted Imaging
DWI visualizes the Brownian molecular motion of water. It has become an important part of oncological imaging, as malignant tumors are typically composed of densely arranged cells in which their numerous membranes limit this Brownian molecular motion [14]. Prostate cancers are thus visualized on highly diffusionweighted images (typically upper b-values of 800-1,000 s/mm2 in prostate imaging) as areas with high signal intensity (Fig. 7a). Diffusion coefficients [apparent diffusion coefficient (ADC)] can be calculated from the diffusion-weighted data. In ADC maps, areas with normal diffusion can then be differentiated as having high signal intensity and those with diffusion restriction as having comparatively low signal intensity (Fig. 7b). Most studies show that DWI is a very useful addition to morphological imaging and can increase sensitivity in particular by 10–25% [15–17]. Since hyperplastic stromal nodules can have pronounced diffusion restriction in BPH, DWI must be evaluated together with morphological imaging (T2w), especially when assessing the central portions of the prostate gland [16].
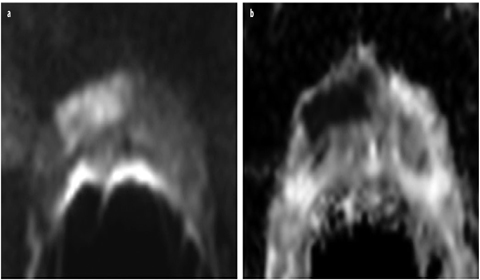
Fig. 7 a, b
a Axial diffusion-weighted imaging (DWI) with a b-value of 1,000 shows a lesion ventral right with a hyperintense signal. b This area has low signal intensity in the corresponding apparent diffusion coefficient (ADC) map. With normal diffusion, the peripheral zone of the prostate has high signal intensity in ADC and low signal intensity in b-1,000. After prostatectomy, an acinar prostate adenocarcinoma with a Gleason score of 4+3=7 was diagnosed ventral right
Studies have increasingly examined the capabilities of DWI with respect to evaluating the aggressiveness of prostate cancer. Such studies show that the ADC value has a negative correlation with the Gleason score, i.e., low ADC values are seen primarily in high-grade, aggressive prostate cancers [15, 18]. Results regarding the ability to differentiate low-grade (Gleason score 3+3=6) and high-grade (Gleason score >4+3=7) tumors in the peripheral zone are very promising, since they may be able to help to better determine patient risk potential [19, 20]. However, since there can still be relevant overlapping of ADC values in different Gleason groups, additional studies are needed to implement this grading potential of DWI in clinical routine. DWI will play an important role in differentiating patients with a low risk from those with a high risk and separating them with respect to management [21].
Dynamic Contrast-Enhanced MRI
Contrast-enhanced MRI sequences can be used to assess tissue vascularity and permeability. Gadolinium-containing extracellular T1w contrast agent is typically administered intravenously for this purpose [22]. Fast T1w gradient- echo (GRE) sequences with a temporal resolution of 4–10 s are primarily used in prostate imaging. Measurements should be performed over a period of up to approximately 5 min after contrast agent application [13]. Enhancement can be displayed in the form of curves over time, thus helping to characterize tissues. Prostate cancers are characterized by fast washin (early peak enhancement) and fast washout compared with healthy tissue (type III curve). Enhancement typically increases steadily (type I) in the given measurement time in cancer-free tissue, whereas a curve with a plateau (type II) occurs relatively frequently in both healthy and cancerous tissue [22]. On the basis of enhancement curves, gadolinium concentrations in tissue and tissue-transport constants in the direction of the tumor interstitium (Ktrans) and back in the direction of the blood plasma (kep) can be calculated using suitable mathematical models (two-compartment Tofts model). Prostate cancers are characterized by an increase in the tissue-transport constants, which can be displayed using color coding in pharmacokinetic parameter maps (Fig. 8) [23]. Available studies do not provide a clear conclusion regarding improvement of prostate cancer detection via DCE. Some studies showed an improvement in diagnostic accuracy of conventional MRI (T2w and T1w) when supplemented by DCE imaging [24, 25]. However, it is problematic in DCE that hyperplastic nodules in BPH can enhance and wash out quickly, like prostate carcinoma foci, and Ktrans and kep can be accordingly increased, thus limiting sensitivity and specificity, particularly in the central portions of the prostate gland [26, 27]. In addition, inflammation can often have greater vascularity and tissue permeability, which also limits its sensitivity and specificity in detecting prostate cancer. However, local staging of prostate cancer and detection of local tumor relapses after definitive therapy can be significantly improved using dynamic T1w sequences, with good spatial resolution [28, 29].
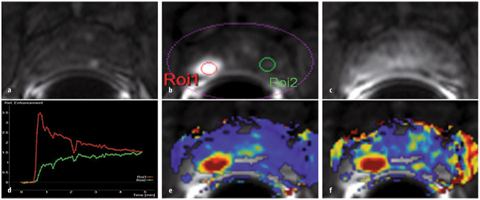
Fig. 8 a–f
a Unenhanced axial T1-weighted gradient echo (GRE) sequence. b After contrast agent administration, an area with early enhancement is seen on the right in the peripheral zone (ROI1), with c significant washout in the late-phase image. d Enhancement can be graphically shown as signal intensity (SI)/time curve. A type III curve (red) with early enhancement is a typical finding in prostate cancer, whereas healthy prostate tissue is characterized by a steady, slow washin (type I, green). Parameter maps represent an alternative. e, f Hightransport constants (Ktrans and kep, respectively) confirm suspicion of prostate cancer. In this example, a minimally differentiated prostate adenocarcinoma with a Gleason score of 4+5=9 was diagnosed after prostatectomy
MR Spectroscopy
MR spectroscopy allows spatially resolved visualization of chemical substances in an organ. The healthy prostate gland produces an ample amount of a citrate-containing secretion, resulting in a high citrate content and a low choline level. In prostate cancer, the choline level is significantly elevated and the citrate content reduced due to the metaplastic processes of cell membranes. The relationship between these two metabolites can therefore be used as a measure of malignancy [30]. MR spectroscopy increases MRI specificity, in particular, but can also be used to evaluate tumor volume [31, 32]. The diagnostic accuracy of morphological MRI can be increased by MR spectroscopy from 52% to 75% [10].
The basic requirement for good spectral resolution of the individual metabolites is a homogeneous magnetic field in the field of measurement and sufficient suppression of the fat and water signal during the measurement. In addition to sequence adjustments, this usually requires multiple shimming steps and saturation bands around the prostate to be manually adjusted to the individual prostate anatomy. Together with these preparations, MR spectroscopy at 1.5 T requires a measurement time of 13–20 min. Evaluation and interpretation are complex and often only possible after appropriate physical adjustments. Even if in the near future automatic segmentation algorithms are able to automatically detect the prostate, thus minimizing measurement preparations, MR spectroscopy will remain limited in its daily use due to the significant time investment and the high level of physical-medical expertise required.
Structured Interpretation and Communication of MRI Findings in the Prostate
In 2012, the European Society of Urogenital Radiology (ESUR) created the Magnetic Resonance Prostate Imaging Reporting and Data System (MR PI-RADS) as part of its MRI guidelines for prostate imaging [13]. Based on the Breast Imaging Reporting and Data System (BIRADS), a standardized method for reporting multiparametric MRI of the prostate for detecting prostate cancer, was proposed here. The goal was to standardize image interpretation and to simplify communication between the radiologist and colleagues in other departments.
Based on clearly defined criteria according to PIRADS, every lesion suspicious for tumor within the prostate is assigned a point value between 1 and 5 for every sequence performed as part of multiparametric MRI (consisting of at least T2w, DWI, and DCE). Moreover, a total point value is calculated for every lesion suspicious for tumor [33]. Thus, a statement regarding the probability of the presence of a clinically significant prostate cancer should be possible: a point value of 1 means that a lesion is probably benign, whereas a point value of 5 indicates a high probability of malignancy. The development of PI-RADS and criteria contained therein for the assignment of point values are based on published literature and an expert consensus. Since being published in February 2012, PI-RADS has been evaluated in multiple studies.
The point values of T2w, DWI, and DCE were added to form a total point value for lesions suspicious for tumor. Good and reproducible diagnostic accuracy was documented for the total point values calculated in this manner [33–37].
Standardization of image interpretation in research and the clinical routine is an important milestone that should accelerate the acceptance of multiparametric MRI in the coming years. The results of clinical studies should be easier to compare using PI-RADS. Moreover, PI-RADS makes it possible to formulate guidelines for diagnostic clarification and perhaps even for treating prostate cancer. The present data indicate that a biopsy should be performed in PI-RADS ⩾4 lesions, whereas monitoring via MRI and PSA could be sufficient in lesions with PI-RADS ⩽3.
MRI and Prostate Biopsy
The standard prostate biopsy is the transrectal ultrasound (TRUS)-guided systematic prostate biopsy. Urological studies in particular show that the detection rate increases as expected with the number of samples so that approximately six samples are taken from each lateral lobe in accordance with the recommendations of the professional associations [38, 39]. However, the entire context of the diagnostic weaknesses of TRUS biopsy only becomes clear with MRI and visualization of prostate cancer [40]. The rate of carcinomas in the ventral portion of the prostate gland, as well as in an extreme lateral position in the peripheral zone and on the apex of the gland, is significant in patients with multiple negative US- guided biopsies. It was shown that patients with a diagnosis of prostate cancer in the ventral portions of the gland have a higher clinical risk than those with a diagnosis of prostate cancer in the peripheral zone [41].
Direct MRI-Guided Biopsies
In all direct MRI-guided biopsy techniques, MRI is performed during the biopsy and the images are used to guide the biopsy needle. Therefore, the biopsy equipment must be MRI compatible. MRI-guided biopsies should be performed on a 1.5-T or 3-T unit, since exact visualization of lesions during biopsy is of essential importance. Direct MRI-guided biopsies can be performed via transgluteal, transperineal, and transrectal access [41–43]. Transrectal biopsy is the most common and most accepted direct MRI-guided biopsy technique, since there are no special requirements regarding anesthesia or sterility in contrast to the transperineal and transgluteal methods. Transrectal MRI-guided biopsy is typically performed after simply coating the rectal mucous membrane with a disinfecting and locally anesthetizing gel [44]. The patient is premedicated with antibiotics, as in standard transrectal US-guided biopsies. Transrectal MRI-guided biopsy can be evaluated as the most exact prostate biopsy method on the basis of current data (Fig. 9): in populations with multiple negative systematic US-guided biopsies, detection rates of 41–59% could be achieved with direct MRIguided prostate biopsy, with the majority of tumors being classified as clinically relevant [41, 45–47]. As shown in Fig. 9, the targeted clarification of non-clinically-relevant cancers is also important, since this can resolve the diagnostic dilemma of an increasing PSA with a negative biopsy, thus creating a foundation for noninvasive and minimally invasive strategies, such as active surveillance or focal therapy.
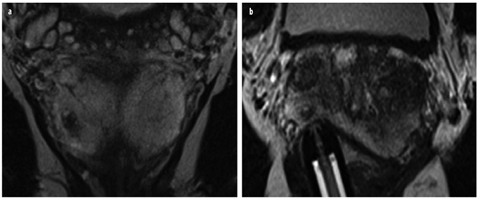
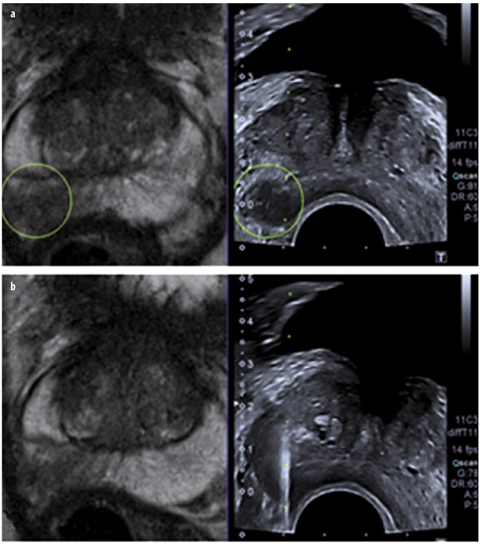
Fig. 9 a, b
Patient with a negative ultrasound (US)-guided biopsy in history and increasing prostate-specific antigen (PSA) value; 12 ng/ml at the time of magnetic resonance imaging (MRI). a Coronal T2-weighted turbo-spin-echo (TSE) with lesion suspicious for cancer measuring a maximum of 5 × 7 mm in the peripheral zone. b Targeted biopsy under direct MRI guidance yielded a total sample length of 12 mm, with 4 mm of an acinar prostate adenocarcinoma (Gleason score 3+3=6)
MRI/US Fusion Biopsy
A multiparametric MRI scan is performed prior to every targeted biopsy to identify lesions suspicious for carcinoma and to evaluate whether targeted biopsy techniques are suitable. A possibility for improving reporting would be to create a drawing of the location of the suspicious focus in addition to the written findings. This drawing can then be used during a planned biopsy to perform a greater number of biopsies in certain regions of the prostate. The procedure is similar for cognitive fusion, in which USguided biopsy is performed immediately after viewing the MRI scan. The objective here is to evaluate the regions suspicious on MRI in a targeted manner and to identify focal lesions on the B-mode image [48]. The prostate must be viewed in both modalities on the same — or at least a comparable — image plane. Otherwise, it is extremely difficult to recognize complex structures in the prostate. Navigation is facilitated by detecting the urethra, prominent hyperplastic nodules, or cysts. Puech et al. detected 15% more clinically relevant cancers per TRUS biopsy in their study by viewing MRI images immediately prior to biopsy [48]. However, cognitive fusion can be expected to be highly examiner dependent. Therefore, software-based fusion of MRI data sets with US images would be desirable. Software on the latest US devices can fuse previously imported MRI data sets three dimensionally and in real time with the B-mode image of a US examination. An electromagnetic unit coupled to the US probe to track probe movement is positioned next to the patient table during the biopsy for this purpose [48, 49]. By selecting individual reference points on MRI and Bmode images, MRI images are adjusted and moved in parallel with the US scan (Fig. 10). This makes it possible to use the US probe to navigate to and biopsy lesions evaluated as being suspicious for cancer in the preceding multiparametric MRI scan [49]. Software-supported 3D real-time fusion is currently under intense evaluation. Multiple workgroups were already able to document a significantly higher detection rate of clinically relevant prostate cancers compared with systematic US-guided biopsy [49–51].
 Enterography: Small Bowel Imaging That Impacts Patient Management
 to Perform and Report Magnetic Resonance Imaging for Pelvic Floor Dysfunction: An Interactive Case-Based Approach
 Should it Be Integrated into Screening and Clinical Routine Imaging?
 Vascular Disease: Diagnosis and Therapy
 and Acquired Pathologies of the Pediatric Gastrointestinal Tract
 Urography in Children


Related posts:
Enterography: Small Bowel Imaging That Impacts Patient Management
to Perform and Report Magnetic Resonance Imaging for Pelvic Floor Dysfunction: An Interactive Case-Based Approach
Should it Be Integrated into Screening and Clinical Routine Imaging?
Vascular Disease: Diagnosis and Therapy
and Acquired Pathologies of the Pediatric Gastrointestinal Tract
Urography in Children
Stay updated, free articles. Join our Telegram channel
Full access? Get Clinical Tree
