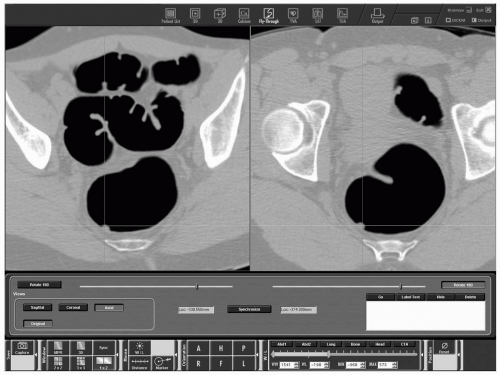
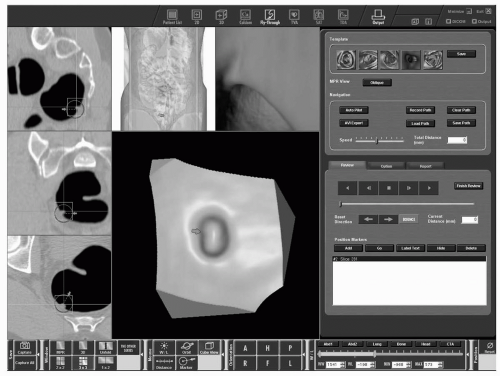
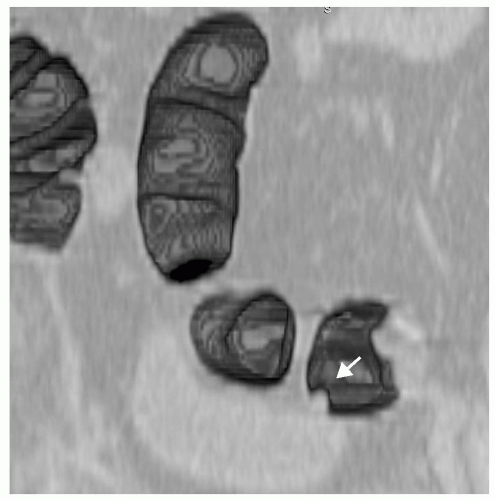
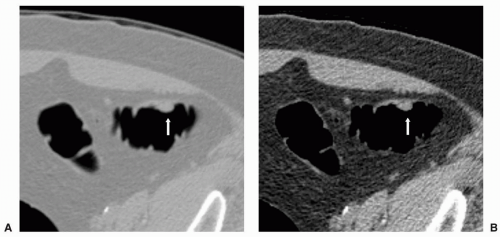
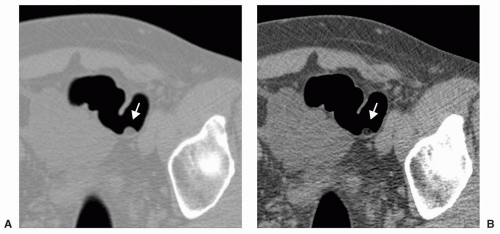
The image displays used for the interpretation of computed tomography colonography (CTC) include standard two-dimensional (2D) axial images, multiplanar reformations (MPR) (coronal, sagittal, or oblique) and three-dimensional (3D) endoluminal views. Various options for the 3D view have been developed and include the “fly-through” navigational view, the subvolume cube view, as well as novel dissection and panoramic views. Various combinations of displays are commercially available, although one display technique (2D vs 3D) is typically chosen as the primary interpretation method, with the other used for problem solving. Debate exists as to the optimal reading strategy. There is evidence that supports the use of a primary 2D technique as well as published data that promotes a primary 3D reading approach. However, it is essential to recognize that both 2D and 3D displays are considered to be necessary and should be used as complementary reading tools for CTC.
DEVELOPING AN INTERPRETATION METHOD
Various factors should be considered when deciding which primary visualization method to use. Ease of use of the workstation and software, interpretation time, and the ability to rapidly generate and export a report are important considerations. Reader preference and training will also contribute to determining which interpretation method is used predominantly. If a computer workstation loaded with CTC software is already available on site, the reader will be more likely to adapt to a particular workstation and software which may be more amenable to one type of interpretation over another. Ultimately, the goal is accurate CTC interpretation irrespective of the primary reading method. Currently most radiologists still use primary 2D axial and MPR displays for interpretation with the use of 3D for problem solving.
1 Modification of reading preferences may occur with the development of newer software, allowing for improved and novel image displays, improved user interface, and increased automated ability.
The ease of use of the 2D and 3D display techniques is directly related to the features and the user interface of the computer workstation and CTC software (see
Tables 4.1 and
4.2). The improved ergonomics of mouse controls compared with keyboard controls are often preferred by readers. User-friendly features that are easily accessible with a single mouse click support faster interpretation times and promote a more relaxed reading style. The CTC software should allow easy magnification (zooming) and panning (roaming) of the image within both 2D and 3D displays. The ability to bookmark a lesion on 2D and 3D with rapid and seamless transition between the two types of images is essential for accurate and efficient lesion identification. Easy linking or synchronization of supine and prone data sets is available on most workstations for axial image review and this feature helps to speed interpretation times.
The interpretation time for CTC consists of the time required to evaluate for both colonic and extracolonic lesions. Documenting colonic and extracolonic findings as well as generating a report are necessary components of the procedure and will contribute to the overall time for the procedure. Features related to data and image storage, exporting images and movie clips, as well as documentation of findings vary widely between computer workstations.
Colon segments are evaluated for adequacy of distention, adequacy of cleansing as well as for the detection and characterization of colonic polyps and masses. When a polyp or mass is detected, the reader must also determine the segmental location of the lesion. The six colonic segments that are typically used include rectum, sigmoid, descending colon, transverse colon, ascending colon, and the cecum.
2 Automatic estimation of the distance of a lesion from the anorectal junction is a useful feature available with some computer software. Accuracy of this tool is dependent upon adequate and continuous distention of the entire colon.
Polyp Measurement
The ability to accurately and easily measure the size of lesions on both 2D and 3D views is an important feature for time-efficient interpretation. Errors in polyp measurement can directly impact on patient management by either causing lesions to drop below a significant threshold or by causing unnecessary referrals for optical colonoscopy. Large polyps measuring ≥10 mm will require a referral for optical colonoscopy and polypectomy whereas small polyps measuring ≤5 mm are considered clinically insignificant and may be left in place and do not even need to be reported.
2,
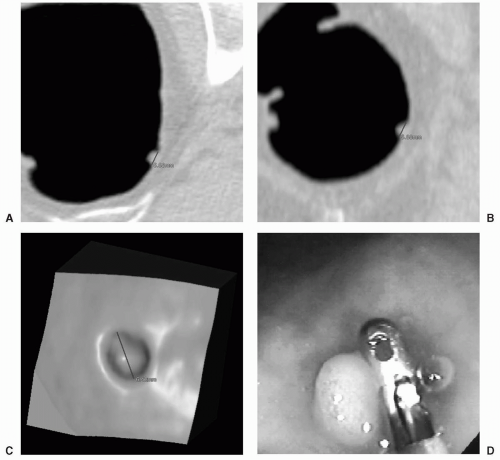
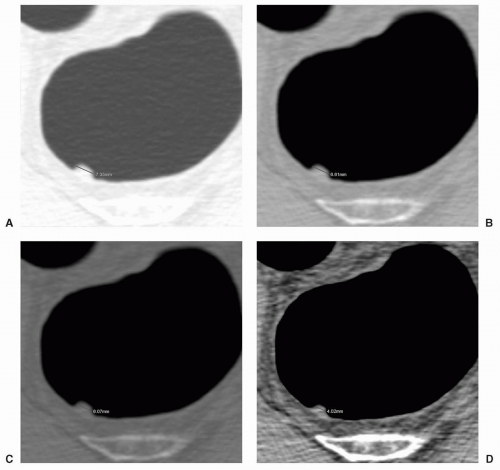
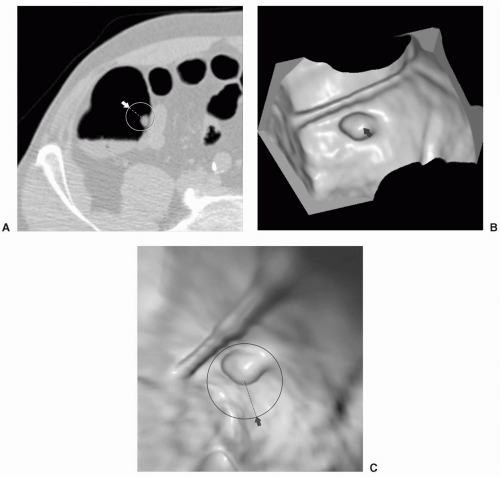
3Polyp size measurements obtained on CTC, particularly using the 3D endoluminal or subvolume cube views may be more accurate than the measurements determined by optical colonoscopy (see
Fig. 4.1). Published studies have documented differences in the reliability between different endoscopic measurement methods. Direct measurement of polyps using a linear probe has been found to be the more accurate method whereas the use of an open biopsy forceps to estimate the size of an adjacent polyp is the less accurate method.
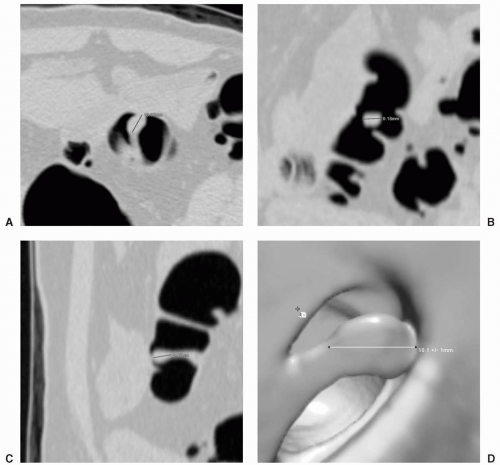
4Good intraobserver and interobserver agreement between measurements has been obtained on CTC using 2D views with a defined measurement protocol. This consists of a high-contrast window width and level with measurement of the largest diameter often found along the base of the polyp and cross-registration of the center of the lesion in three MPR images (axial, coronal, and sagittal) to determine the optimal plane for measurement
5 (see
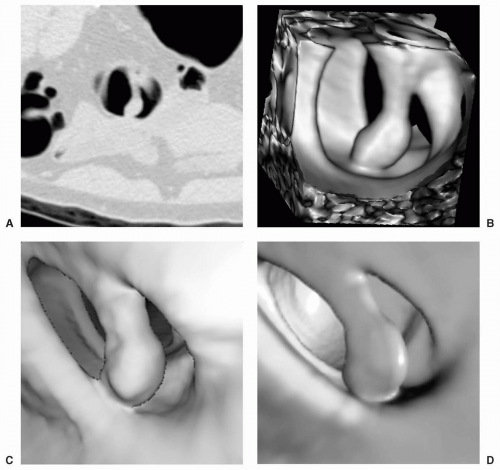
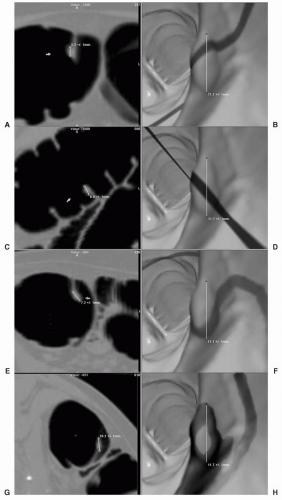
Fig. 4.2). Only the head of a pedunculated polyp is measured with exclusion of the stalk (see
Fig. 4.3). The maximum diameter of 48 polyps measuring between 2 and 12 mm was measured by four observers using three different visualization displays: 2D colonography window, 2D abdominal window, and 3D surface rendering.
6 CT measurements, irrespective of the display used, were found to overestimate polyp diameters with the least amount of error found when using the 2D abdominal window setting. However, only two of the readers used a combination of the three multiplanar views for 2D measurements. Inter- and intraobserver agreement was poorest for the 3D display. Very large polyps and masses, particularly circumferential carcinomas are typically easier to measure using 2D multiplanar images.
Additionally polyps located in a poorly distended segment are often more easily measured on 2D views.
In contrast, polyp measurement was found to be significantly more accurate on 3D endoluminal views than on 2D axial, coronal, or sagittal views in another study.
7 Four readers obtained measurements using 2D MPR and 3D endoluminal images on ten synthetic polyps (6-13 mm) in an
in vitro phantom and on
in vivo polyps in ten patients (10 polyps measuring 7-25 mm). It was also found that the 2D measurements underestimated polyp sizes in all cases. Shortening of polyps may be attributed to the fact that the long axis of polyps is often not aligned along a particular 2D view. The discrepancy between 2D and 3D measurements may be minimized by using an “optimized” 2D measurement, which is the largest diameter as determined from the three standard multiplanar views or by use of an oblique view, which is orthogonal to the axis of the colonic lumen (see
Fig. 4.4).
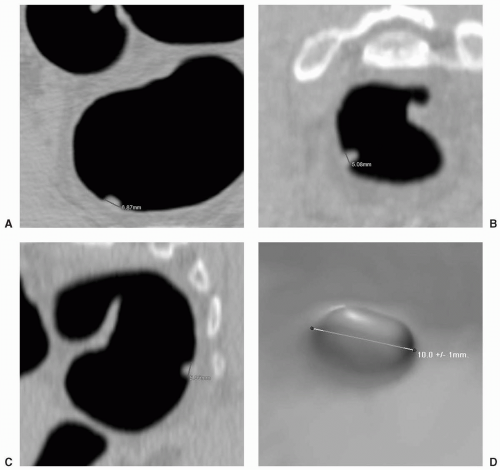
Determination of maximum polyp diameter may be easier and faster on 3D endoluminal or subvolume cube images (see
Fig. 4.5). The start and end points for a lesion on the 3D images may be difficult to ascertain unless the reader interactively manipulates the image to assure accurate point placement. Investigators are evaluating a method to automatically measure polyp size on CTC based on segmentation that grows a surface patch over the polyp surface starting from a seed.
8 The long axis of an ellipse that is fitted to a 2D point set determined from projection of patch points along the polyp axis determines the size of the polyp. The future development of automated polyp volume measurement may prove to be the most accurate method for detecting the relative change in the size of polyps that are followed noninvasively on CTC.
9
PRIMARY TWO-DIMENSIONAL INTERPRETATION
The traditional approach to CTC interpretation is using a primary 2D technique, with the use of 3D views only
when necessary to problem-solve potential lesions. This 2D approach is similar to the typical approach to reading computed tomography (CT) scans that relies on the use of the axial images and may therefore be more familiar and comfortable for readers who are already experienced in interpreting CT data sets. Additionally, most computer workstations easily support a primary 2D interpretation method particularly early in the development of this technique. In a survey of experts in CTC, it was found that most respondents (80%, 20/25) believed that a primary 2D approach with 3D reserved for problem solving was the optimum method for CTC interpretation.
1The primary 2D approach requires evaluation of the colon in a systematic manner typically from the anorectum to the cecum using the 2D axial supine and prone images with the use of the MPR and 3D endoluminal images to aid in differentiating polyps from other structures such as bulbous folds and stool. CTC software should allow the ability to display the supine and prone axial data sets side by side (see
Figs. 4.6 and
4.7). It is also useful to have the MPR and 3D views easily accessible, which may be available in the same display as the axial images.
The reader begins by scrolling to approximately the same level on both the supine and prone axial views. When starting at the level of the anorectal junction, the bony landmarks in the pelvis may be used for initial orientation and registration of similar levels on the supine and prone images. Intracolonic landmarks such as the inferior valve of Houston in the rectum, or specific folds or diverticulae in other parts of the colon may also be used. The supine and prone axial data sets are then linked or synchronized as the reader evaluates each colonic segment systematically (segmental lumen tracking) being sure to scroll through the top and bottom of each portion of the colon. The colon should be magnified so that the gasfilled colonic segment occupies most of the display in each position. The reader will have to link and unlink
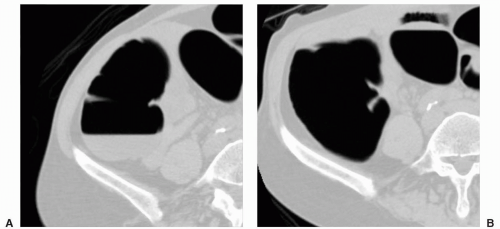
the supine and prone data sets multiple times to maintain similar orientation of a particular colonic segment in both positions during the evaluation. Additionally, supine and prone axial images will require panning or roaming to keep the gas-filled lumen in the center of the display field. This method allows direct comparison of segments that cannot be fully evaluated in one position either due to residual layering fluid or stool obscuring the dependent colonic surface or due to suboptimal distention (see
Fig. 4.8).
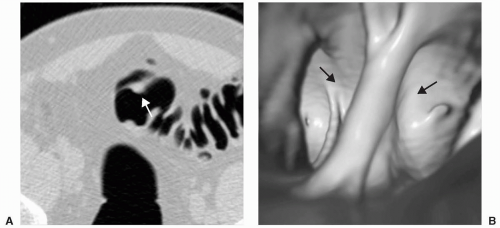
If a suspicious lesion is detected on 2D axial images, it is bookmarked so that it can be quickly located and reviewed using 3D views (see
Figs. 4.9 and
4.10). Depending on reader preference, potential lesions identified on 2D images may be evaluated immediately with 3D views, or they can all be evaluated at the end of the 2D interrogation of the colon. Most CTC software provides a crosshair visible on axial, multiplanar, and 3D views to show the particular location of a lesion on all views.
A high-contrast colon display window (width 1,400, level -350) is recommended to maximize visualization of polyps at the air-soft tissue interface and to help display air or heterogeneous density within stool. A standard soft tissue or abdominal window (width 400, level 40) is used to evaluate for mural thickening due to involvement by cancers. The abdominal window is also used to distinguish the fat density of colonic lipomas as well as the high density of pills and contrast material. In addition, this window is sometimes helpful in tracking the colonic lumen in very tortuous colonic segments. Flat lesions may be easier to visualize using a soft tissue window. Following complete colonic evaluation, the abdominal window is used to review the entire 2D axial data set for extracolonic lesions.
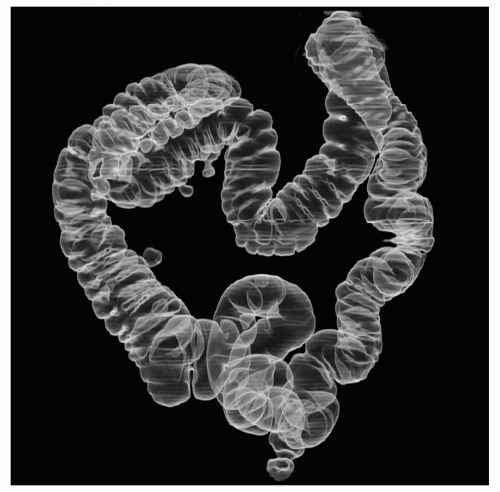
Multiplanar reformations must often be referred to when evaluating very tortuous segments or segments of collapse and should be easily available. The display layout can often be customized and listed as a specific user preference. Multiple types of images may be displayed at one time including 2D axial images in combination with sagittal, coronal, and/or oblique MPRs, and/or 3D views such as either the cube view, fly-through or dissection view for problem solving. A 3D overview of the colon that simulates an air-contrast barium enema may be included and is useful for showing the location of the viewing point or a potential lesion (see
Fig. 4.11). This view also allows easy review of the anatomy of the colon and the detection of variants. 3D thick-slab MPR is also available on some workstations, and has the advantage of the extraluminal orientation of 2D MPR and the ability to display a finite volume beyond a single slice (see
Fig. 4.12).
Advantages of 2D interpretation include the ability to directly visualize the texture and density of potential lesions (heterogeneous stool-containing air, fat density of lipomas, high density of contrast material or pill fragments) (see
Table 4.3 and
Figs. 4.13 and
4.14). The mobility of stool and pedunculated polyps are easily assessed, and structures causing external compression of the colon are quickly identified. 2D views allow the reader to easily avoid the potential pitfalls that occur with primary 3D interpretation such as diverticulae. The entire wall of the colon may be visualized on 2D if there is optimal cleansing and distention. Interpretation times using primary 2D are typically faster than for primary 3D interpretation, ranging between 5 and 20 minutes, and often 10 minutes or less particularly in normal studies. As a reader becomes more experienced in distinguishing true polyps from false positives on 2D images, interpretation times can decrease and 3D problem solving is used less frequently.
Disadvantages of using 2D as a primary method include the difficulty of tracking the colon when there are redundant segments, aberrant anatomy (i.e., cecal bascule), or if multiple collapsed segments are present. Although there have been many single-center studies that have shown excellent sensitivity of CTC for the detection of clinically significant polyps using a primary 2D interpretation approach, results from multicenter trials to date performed in low-prevalence populations have been disappointing.
10,
11 Poorly cleansed colons containing large amounts of residual fluid or solid stool can pose a problem for both 2D and 3D interpretation methods.
PRIMARY THREE-DIMENSIONAL INTERPRETATION
Advances in computer processing power, graphics cards, and the user interface of CTC software have improved the resolution of the 3D view as well as the ability to easily navigate through the endoluminal view. The user should ensure the availability of high quality 3D viewing and usability before attempting a primary 3D interpretation method. Most 3D display techniques currently employ volume rendering for postprocessing of the CT data sets
although surface rendering has been used in the past (see
Fig. 4.15). 3D data can be visualized using monochromatic or color shaded displays which simulate the appearance of colonic mucosa. Perspective lighting can also be adjusted to provide near-field and far-field differentiation. Current CTC software offers real-time interactive 3D viewing and navigation, and offers either a partially or completely automated centerline flight path. Older software only allowed manual adjustment of the centerline flight path for 3D endoluminal navigation.
Several features have been developed to assist interpretation using a primary 3D method. Rapid, automatic segmentation of the gas-distended colon with automatic centerline generation are now available. Automated seed placement for colonic segmentation is available that effectively excludes extracolonic air.
12,
13 and
14 Computation methods for the colonic centerline include decimation and topological thinning.
15,
16 and
17 Some software algorithms use the colonic lumen or wall as a basis for computation of the centerline, although other methods have been developed that do not rely on identification of complete colon segments and this has decreased centerline computation times from 17 seconds down to approximately 10 seconds.
18 Other gas-filled structures such as the stomach or small bowel are initially segmented and identified by different colors and can be manually excluded from evaluation (see
Fig. 4.16).
The display format used for primary 3D interpretation should feature central placement of an enlarged endoluminal 3D view (see
Fig. 4.17). 3D interpretation begins by flying although the colon segments along the centerline, first in a retrograde direction (anorectum to cecum) and then in an anterograde direction (cecum to anorectum). A total of four “fly-throughs” are performed: once in each of the two directions in both supine and prone positions. In a study of 50 patients undergoing both CTC and colonoscopy, the value of two-way 3D interpretation was compared to one-way 3D interpretation.
19 It was found that using three readers, the mean sensitivity of CTC for polyp detection with two-way navigation was significantly higher (88.4%, 411/465) than for one-way navigation (78.1%, 363/465). An increased number of false-positive findings were present when using two-way interpretation as well.
