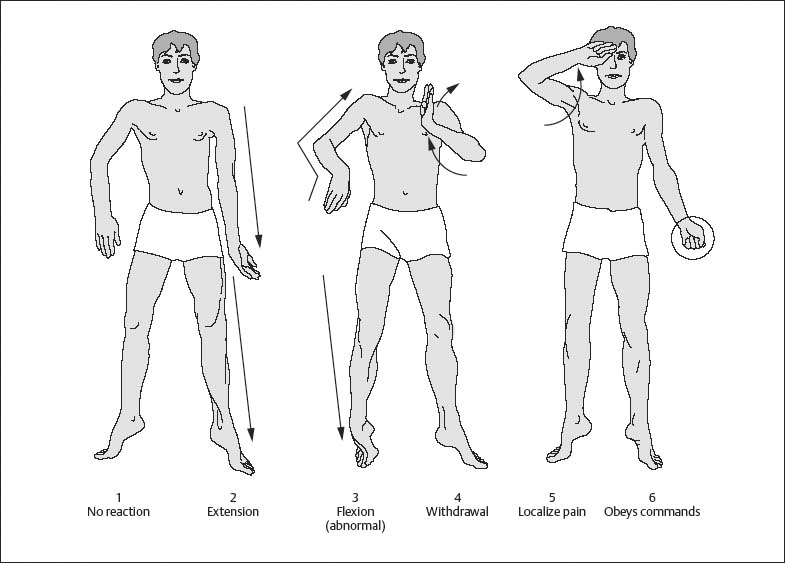
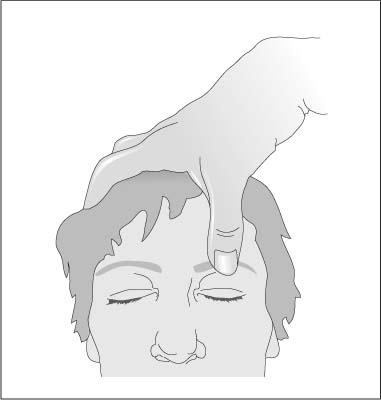
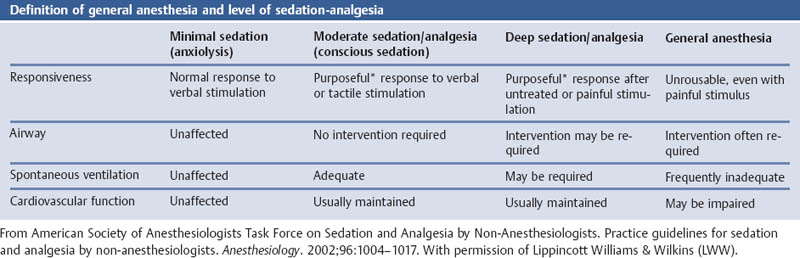
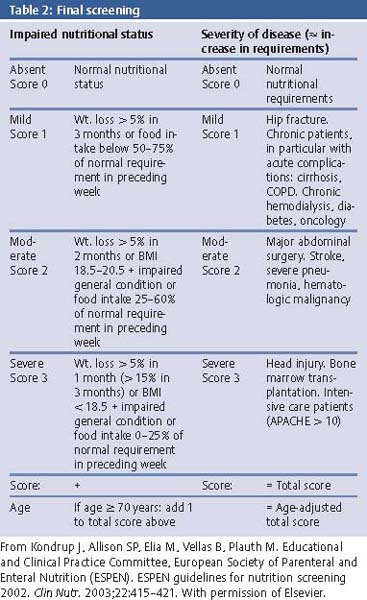
Chapter 1 Instruments for Overall Patient and Disease Assessment Grading of Severity of Disease—Organ Failure Infectious Disorders: Prophylaxis Level of Evidence: Study Quality To quantify physical performance status. Score Description of performance 100 Normal, no complaints 90 Able to carry on activities; minor signs or symptoms of disease 80 Normal activity with effort 70 Cares for self. Unable to carry on normal activity or to do active work 60 Ambulatory. Requires some assistance in activities of daily living and self-care 50 Requires considerable assistance and frequent medical care 40 Disabled; requires special care and assistance 30 Severely disabled; hospitalization indicated though death not imminent 20 Very sick; hospitalization and active supportive treatment 10 Moribund 0 Dead Most commonly used scale for grading physical performance in oncology. Karnofsky DA, Burchenal JH. The clinical evaluation of chemotherapeutic agents in cancer. In: Macleod CM, ed. Evaluation of Chemotherapeutic Agents. New York: Colombia Press; 1949:199–205. To quantify physical performance. Score Description of performance WHO 0 Normal activity WHO 1 Symptomatic, but nearly fully ambulatory (restricted in physical strenuous activity, but ambulatory and able to do light work) WHO 2 Some time in bed, but needs to be in bed less than 50 % of normal daytime (capable of self-care, but not work) WHO 3 Confined to bed more than 50 % of normal daytime (capable of limited self-care) WHO 4 Unable to get out of bed (incapable of any self-care) WHO 5 Dead To give an overall assessment of patient status for ECOG studies. Grade 0 Fully active, able to carry on all predisease performance without restriction 1 Restricted in physically strenuous activity but ambulatory and able to carry out work of a light or sedentary nature, e.g., light housework, office work 2 Ambulatory and capable of all self-care, confined to bed or chair more than 50 % of waking hours 3 Capable of only limited self-care, confined to bed or chair more than 50 % of waking hours 4 Completely disabled. Cannot carry on any self-care. Totally confined to bed or chair 5 Dead The classification was proposed by the Eastern Cooperative Cancer Chemotherapy Group in a critical examination of the methodology of clinical cancer chemotherapy trials. In essence, this grading is similar to the WHO classification. The grading relates to the Karnofsky scale as follows: ECOG grade Karnofsky 0 100–90 1 80–70 2 60–50 3 40–30 4 20–10 5 0 From Oken M, Greech RH, Tormey DC et al. Toxicity and response criteria of the Eastern Cooperative Oncology Group. Am J Clin Oncol. 1982;5:649–655. With permission of Lippincott Williams & Wilkins (LWW). Oken M, Greech RH, Tormey DC et al. Toxicity and response criteria of the Eastern Cooperative Oncology Group. Am J Clin Oncol. 1982;5:649–655. Zubrod CG, Schneiderman M, Frei E et al. Appraisal of methods for the study of chemotherapy of cancer in man: comparative therapeutic trial of nitrogen mustard and triethylene thiophosphoramide. J Chron Dis. 1960;11:7–33. To divide patients into anaesthesia risk classes. The ASA system is a measure of the overall sickness of patients receiving surgery and anesthesia. Class I Healthy patient Class II Mild systemic disease, no functional limitation, no acute problems, e.g. controlled hypertension, mild diabetes, chronic bronchitis, asthma Class III Severe systemic disease, definite functional limitation, e.g. brittle diabetic, frequent angina, myocardial infarction Class VI Severe systemic disease with acute, unstable symptoms, e.g. recent (3 months) myocardial infarction, congestive heart failure, acute renal failure, ketoacidosis, uncontrolled, active asthma Class V Severe systemic disease with imminent risk of death From Keats AS. The ASA classification of physical status—a recapitulation. Anesthesiology. 1978;49:233–236. With permission of Lippincott Williams & Wilkins (LWW). Many further explanations and variations have been published regarding the definition of the ASA status. As illustrated in the following table: Class I The patient has no organic, physiologic, biochemical, or psychiatric disturbance. The pathologic process for which surgery is to be performed is localized and does not entail a systemic disturbance. Examples: a fit patient with an inguinal hernia, a fibroid uterus in an otherwise healthy woman. Class II Mild to moderate systemic disturbance caused either by the condition to be treated surgically or by other pathophysiologic processes. Examples: non- or only slightly limiting organic heart disease, mild diabetes, essential hypertension, or anemia. The extremes of age may be included here, even though no discernible systemic disease is present. Extreme obesity and chronic bronchitis may be included in this category. Class III Severe systemic disturbance or disease from whatever cause, even though it may not be possible to define the degree of disability with finality. Examples: severely limiting organic heart disease, severe diabetes with vascular complications, moderate to severe degrees of pulmonary insufficiency, angina pectoris, or healed myocardial infarction. Class IV Severe systemic disorders that are already life threatening, not always correctable by operation. Examples: patients with organic heart disease showing marked signs of cardiac insufficiency, persistent angina, or active myocarditis, advanced degrees of pulmonary, hepatic, renal, or endocrine insufficiency. Class V The moribund patient who has little chance of survival but is submitted to operation in desperation. Examples: the burst abdominal aneurysm with profound shock, major cerebral trauma with rapidly increasing intra-cranial pressure, massive pulmonary embolus. Most of these patients require operation as a resuscitative measure with little if any anesthesia. Class Description P1 A normal healthy patient P2 A patient with mild systemic disease P3 A patient with severe systemic disease P4 A patient with severe systemic disease that is a constant threat to life P5 A moribund patient who is not expected to survive without the operation P6 A declared brain-dead patient whose organs are being removed for donor purposes Commonly used classification to assess anesthesia risk. A variation, available on the website http://www.asahq.org/clinical/physicalstatus.htm distinguishes seven classes. Cohen MM, Duncan PG, Tate R. Does anesthesia contribute to operative mortality. JAMA. 1988;41:83. Dripps RD, Lamont A, Eckenhoff JE. The role of anesthesia in surgical mortality. JAMA. 1961;178:261–266. Keats AS. The ASA classification of physical status—a recapitulation. Anesthesiology. 1978;49:233–236. Owens WD, Felts JA, Spitznagel EL Jr. ASA physical status classifications: a study of consistency of ratings. Anesthesiology. 1978;49:239–243. The aim here was to design a scoring system for consciousness which is simple, clearly defined, and reliable. Score Subtotal Eyes open (E-score) 4 = Spontaneously 3 = To sound 2 = To pain 1 = Never Best verbal response (V-score) 5 = Oriented 4 = Confused conversation 3 = Inappropriate words 2 = Incomprehensible sounds 1 = None Best motor response (M-score) 6 = Obeys commands 5 = Localize pain 4 = Flexion (withdrawal) 3 = Flexion (abnormal) 2 = Extension 1 = None Total: From: Teasdale G, Jeanett B. Assessment of coma and impaired consciousness: a practical scale. Lancet. 1974;2:81–84. With permission of Elsevier. In case the patient is intubated, the best verbal response cannot be scored. Instead of a number it should be scored as “tube,” i. e. Vt. Teasdale G, Jeanett B. Assessment of coma and impaired consciousness: a practical scale. Lancet. 1974;2:81–84. Teasdale G, Jennett B. Assessment and prognosis of coma after head injury. Acta Neurochir. 1976;34:45–55. Fig. 1.1 Pain stimulus above the eye. Fig. 1.2 Pain stimulus on the finger. Fig. 1.3 Motor response, according to M-score. To grade the level of sedation, particularly after i.v. administration of benzodiazepines. Score 1 Awake 2 Awake, not anxious 3 Eyes open, speech slurred 4 Eyes closed, responds to verbal commands 5 Eyes closed, responds to mild physical stimulation 6 No response to mild physical stimulation From Ng JM, Kong CF, Nyam D. Patient-controlled sedation with propofol for colonoscopy. Gastrointest Endosc. 2001;54:8–13. With permission from the American Society of Gastrointestinal Endoscopy. Scoring system, commonly used in endoscopy. Ng JM, Kong CF, Nyam D. Patient-controlled sedation with propofol for colonoscopy. Gastrointest Endosc. 2001;54: 8–13. To define levels of sedation-analgesia. Minimal sedation (anxiolysis). A drug-induced state during which patients respond normally to verbal commands. Although cognitive function and coordination may be impaired, ventilatory and cardiovascular functions are unaffected. Moderate sedation/analgesia (conscious sedation). A drug-induced depression of consciousness during which patients respond purposefully* to verbal commands, either alone or accompanied by light tactile stimulation. No interventions are required to maintain a patent airway, and spontaneous ventilation is adequate. Cardiovascular function is usually maintained. Deep sedation/analgesia. A drug-induced depression of consciousness during which patients cannot be easily aroused but respond purposefully* following repeated or painful stimulation. The ability to independently maintain ventilatory function may be impaired. Patients may require assistance in maintaining a patent airway, and spontaneous ventilation may be inadequate. Cardiovascular function is usually maintained. General anesthesia. A drug-induced loss of consciousness during which patients are not rousable, even by painful stimulation. The ability to independently maintain ventilatory function is often impaired. Patients often require assistance in maintaining a patent airway, and positive pressure ventilation may be required because of depressed spontaneous ventilation or drug-induced depression of neuromuscular function. Cardiovascular function may be impaired. Because sedation is a continuum, it is not always possible to predict how an individual patient will respond. Hence, practitioners intending to produce a given level of sedation should be able to rescue patients whose level of sedation becomes deeper than initially intended. Individuals administering moderate sedation/analgesia (conscious sedation) should be able to rescue patients who enter a state of deep sedation/analgesia, while those administering deep sedation/analgesia should be able to rescue patients who enter a state of general anesthesia. The definitions are given as part of a guideline for sedation and analgesia by nonanesthesiologists. American Society of Anesthesiologists Task Force on Sedation and Analgesia by Non-Anesthesiologists. Practice guidelines for sedation and analgesia by non-anesthesiologists. Anesthesiology. 2002;96:1004–1017. * Reflex withdrawal from a painful stimulus is not considered a purposeful response. To define the level of cooperation. Two scoring systems are shown below. Score 1 No cooperation; procedure abandoned 2 Minimal cooperation; continuous movement requiring continuous physical restraint 3 Minimal cooperation; intermittent movement requiring intermittent restraint 4 Good cooperation with occasional movement requiring no restraint 5 Full cooperation From Murdoch JA, Kenny GN. Patient-maintained propofol sedation as premedication in day-case surgery: assessment of a target controlled system. Br J Anaesth. 1999;82:429–431. With permission granted by Oxford University Press/British Journal of Anaesthesia on behalf of © The Board of Management and Trustees of the British Journal of Anasthesia. This represents a useful grading of the level of cooperation in patients with propofol sedation. Dell RG, Cloote AH. Patient-controlled sedation during transvaginal oocyte retrieval: an assessment of patient acceptance of patient-controlled sedation using a mixture of propofol and alfentanil. Eur J Anaesthesiol. 1998;15:210–215. Murdoch JA, Kenny GN. Patient-maintained propofol sedation as premedication in day-case surgery: assessment of a target controlled system. Br J Anaesth. 1999;82:429–431. Responsiveness Eyes Score Responds readily to name Clear, no ptosis 5 Lethargic response to name Glazed or mild ptosis (< 1/2 eye) 4 Responds only when called loudly/repeatedly Marked ptosis (> 1/2 eye) 3 Responds after mild prodding/shaking 2 Unresponsive to mild prodding/shaking 1 From Chernik DA, Gillings D, Laine H et al. Validity and reliability of the Observer’s Assessment of Alertness/Sedation Scale: study with intravenous midazolam. J Clin Psychopharmacol. 1990;10:244–251. With permission of Lippincott Williams & Wilkins (LWW). This score ranges from 5–1; 5 represents awake/alert and 1 represents deeply sedated. Chernik DA, Gillings D, Laine H et al. Validity and reliability of the Observer’s Assessment of Alertness/Sedation Scale: study with intravenous midazolam. J Clin Psychopharmacol. 1990;10:244–251. Further neuropsychological function tests are described below. The Hopkins Verbal Learning Test-Revised (HVLT-R) assesses verbal learning and memory. In this test, patients listen to a list of 12 words, recalling as much as they can remember after each of three readings. After a 20-minute delay, subjects again recall as much as they can remember, and next perform an auditory recognition task by responding “yes” to words they had been asked to learn, and “no” to distractors (Discrimination score = True-Positive endorsements–False-Positive endorsements). This and similar measures of anterograde memory are particularly sensitive to disruption of the brain’s hippocampus and cholinergic basal forebrain, which benzodiazepines disrupt. The Trail Making Tests (Parts A and B) test visuomotor (psychomotor) scanning speed and mental flexibility. In part A, subjects connect randomly arranged targets on a page in their numerical order as fast as possible. Part B introduces a component of mental flexibility because the circles have both numbers and letters. Subjects must then alternate their connections between numbers and letters. Both parts A and B are sensitive to frontal lobe and subcortical dysfunction. The Digit Symbol task also measures psychomotor speed and is sensitive to generalized cerebral dysfunction. This test requires subjects to quickly transcribe digits to symbols from a key immediately within view. The Digit Span task assesses working memory and attention span by asking subjects to recall digit strings of increasing length immediately after hearing them. The second part of this test requires subjects to recite the digits in the reverse order they were given. The Stroop Color Word Test (Part C) reflects divided attention and inhibition of conditioned reflex by requiring patients to quickly identify the ink color (red, green, and blue) in which color names (red, green, and blue) are printed. However, the names are always printed in a color different in meaning from the word (e.g., red printed in green letters). Rapid and successful performance requires selective attention to the color, and suppression of the automatic reflex to read the word (see references below). From Sipe BW, Rex DK, Latinovich D et al. Propofol versus midazolam/meperidine for outpatient colonoscopy: administration by nurses supervised by endoscopists. Gastrointest Endosc. 2002;55: 815–825. With permission from the American Society for Gastrointestinal Endoscopy. Golden CJ. Stroop Color and Word Test. Chicago: Stoelting; 1978. Psychological Corporation. WAIS-III WMS-III: technical manual. San Antonio: The Psychological Corporation; 1997. Reitan RM. Trail Making Test. Tucson (AZ): Reitan Neuropsychological Laboratory; 1992. Shapiro AM, Benedict RH, Schretlen D, Brandt J. Construct and concurrent validity of the Hopkins verbal learning test-revised. Clin Neuropsychol. 1999;13:348–358. Sipe BW, Rex DK, Latinovich D et al. Propofol versus midazolam/meperidine for outpatient colonoscopy: administration by nurses supervised by endoscopists. Gastrointest Endosc. 2002;55:815–825. To use a simple index to classify underweight, overweight, and obesity in adults. BMI = weight (kg)/height2 (m) Classification BMI Risk of comorbidities Underweight < 18.50 Low (but risk of other clinical problems increased) Normal range 18.50–24.99 Average Overweight ≥ 25.00 Preobese 25.00–29.99 Increased Obese class I 30.00–34.99 Moderate Obese class II 35.00–39.99 Severe Obese class III ≥ 40.00 Very severe A person of 70 kg weight and a height of 1.75 m has a body mass index of: 70/1.752 = 22.9 Both extremes of the BMI confer increased risk of mortality. Garrow JS. Obesity and Related Diseases. Edinburgh: Churchill Livingstone; 1988. WHO. Obesity: Preventing and Managing the Global Epidemic. WHO Consultation Report. World Health Organization Technical Report Series. 1997;894:1–15. To develop a malnutrition risk scale that can be used for out-patient screening. S Sadness C Cholesterol A Albumin < 40 g/L L Loss of weight E Eating problems (cognitive or physical) S Shopping problems or inability to prepare a meal From Morley JE. Death by starvation. A modern American problem? J Am Geriatr Soc. 1989;37:184–185. With permission of Blackwell Publishing. Each element scores 1 point if present. A score greater than 3 points predicts a high risk of malnutrition. This score was specially developed for the evaluation of malnourishment in geriatric patients. As no physical examination is included, nonmedical health professionals can use it. Morley JE. Death by starvation. A modern American problem? J Am Geriatr Soc. 1989;37:184–185. Omran ML, Morley JE. Assessment of protein energy malnutrition in older persons, part I: History, examination body composition and screening tools. Nutrition. 2000;16:50–63. To provide an objective scale of malnutrition. (1.489 × serum albumin (g/I) + 41.7 × (actual/usual weight), where usual weight = stable weight 6 months before admission Score > 100 No malnutrition 97.5–100 Mild malnutrition 83.5–97.5 Moderate malnutrition < 83.5 Severe malnutrition Objective index of nutritional status, useful for selection of enteral/parenteral nutritional activities. Buzby GP, Williford WO, Peterson OL et al. A randomised clinical trial of total parenteral nutrition in malnourished surgical patients: the rationale and impact of previous clinical trials and pilot study on protocol design. Am J Clin Nutr. 1988;47:357–365. To provide an objective index of malnutrition. 20.68 − [0.24 × serum albumin (g/L)] − [19.21 × prealbumin (g/L)] − [1.86 × lymphocyte count (106/L)] − (0.04 × ideal body weight) From De Jong PCM, Wesdorp RI, Volovis A et al. The value of objective measurements to select patients who are malnourished. Clinical Nutrition. 1985;4:61–66. With permission of Elsevier. Malnutrition is diagnosed if the score is greater than 0. De Jong PCM, Wesdorp RI, Volovis A et al. The value of objective measurements to select patients who are malnourished. Clinical Nutrition. 1985;4:61–66. The SGA is one of the most widely used nutritional indices. It consists of a patient history (recent weight loss, changes in eating habits, gastrointestinal symptoms, physical fitness, and stress factor) and a physical examination (body weight, subcutaneous fat mass, muscle atrophy, edema). The subjective global assessment is easy to calculate and useful in a clinical setting. Detsky AS, McLaughlin JR, Baker JP et al. What is subjective global assessment of nutritional status? J Parenter Enteral Nutr. 1987;11:8–13. The European Society of Parenteral and Enteral Nutrition have recently developed the NRS. It includes a patient history (weight loss, reduced dietary intake) physical parameters (body mass index) and a disease severity factor. The index can be calculated quickly. Yes No 1 Is BMI < 20.5? 2 Has the patient lost weight within the last 3 months? 3 Has the patient had a reduced dietary in-take in the last week? 4 Is the patient severely ill? (e.g. in intensive therapy) Yes: If the answer is “yes” to any question, the screening in Table 2 is performed. No: If the answer is “no” to all questions, the patient is re-screened at weekly intervals. If the patient e.g. is scheduled for a major operation, a preventive nutritional care plan is considered to avoid the associated risk status. With a total score ≥ 3: the patient is nutritionally at risk and a nutritional care plan is initiated. With a total score < 3: weekly rescreening of the patient. If the patient, for example, is scheduled for a major operation, a preventive nutritional care plan is considered to avoid the associated risk status. Kondrup J, Allison SP, Elia M, Vellas B, Plauth M. Educational and Clinical Practice Committee, European Society of Parenteral and Enteral Nutrition (ESPEN). ESPEN guidelines for nutrition screening 2002. Clin Nutr. 2003;22:415–421. Males: BEE = 66.5 + [13.8 × weight (kg)] + [5 × height (cm)] − (6.8 × age) Females: BEE = 655 + [9.6 × weight (kg)] + [1.8 × height (cm)] – (4.7 × age) Resting metabolic expenditure (RME) = BEE × 1.4 Little or no exercise Calorie calculation = BEE × 1.2 Light exercise/sports 1–3 days/week Calorie calculation = BEE × 1.375 Moderate exercise/sports 3–5 days/week Calorie calculation = BEE × 1.55 Hard exercise/sports 6–7 days/week Calorie calculation = BEE × 1.725 Very hard daily exercise/sports and physical job or twice-daily training Calorie calculation = BEE × 1.9 Harris J, Benedict F. A biometric study of basal metabolism in man. Washington, DC: Carnegie Institute of Washington; 1919. Van Way CW 3rd. Variability of the Harris–Benedict equation in recently published textbooks. J Parenter Enteral Nutr. 1992; 16:566–568. To determine the validity of clinical measures in the assessment of dehydration severity among elderly patients. Rating 0 Patient appears normally hydrated; vital signs and laboratory values are within normal range. + 1 Patient is suspected to have mild dehydration; blood pressure and laboratory values are usually within normal range, and serum sodium is < 145 mEq/L. + 2 Patient is moderately dehydrated; several symptoms are present and some laboratory values are abnormal or nearly abnormal. BUN: Cr is 15:1 or above, serum Na, osmolality, or BUN elevated. + 3 Patient is severely dehydrated; symptoms are present and some laboratory values are distinctly abnormal. BUN: Cr is at least 20:1 and usually over 25:1, serum Na > 145 mEq/L, osmolality > 300, or BUN elevated. From Gross CR, Lindquist RD, Wooley AC, Granieri R, Allard K, Webster B. Clinical indicators of dehydration severity in elderly patients. J Emergency Med. 1992;10:267–274. With permission of Elsevier. The severity of dehydration increases with an increased rating. Gross CR, Lindquist RD, Wooley AC, Granieri R, Allard K, Webster B. Clinical indicators of dehydration severity in elderly patients. J Emergency Med. 1992;10:267–274. Instrument used in studies of severe diarrhea in emerging countries. http://www.who.int/csr/resources/publications/cholera/whocddser9115rev1.pdf. Several variants have been published in the literature as follows: Mackenzie A, Barnes G, Shann F. Clinical signs of dehydration in children. Lancet. 1989;2(8663):605–607. http://www.aafp.org/afp/981115ap/eliason.html. No dehydration (less than 3 % weight loss) No signs Mild–moderate dehydration (3–8 % weight loss) (ordered by increasing severity) Dry mucous membranes (be wary with the mouth breather) Sunken eyes (and minimal or no tears) Diminished skin turgor (pinch test 1–2 seconds) Altered neurological status (drowsiness, irritability) Deep (acidotic) breathing Severe dehydration (≥ 9 % weight loss) Increasingly marked signs from the mild– moderate group plus: Decreased peripheral perfusion (cool/mottled/pale peripheries; capillary refill time > 2 seconds) Circulatory collapse Signs are ordered in each column by severity. From Armon K, Stephenson T, MacFaul R, Eccleston P, Werneke U. An evidence and consensus based guideline for acute diarrhoea management. Arch Dis Child. 2001;85:132–142. With permission of the BMJ Publishing Group. Armon K, Stephenson T, MacFaul R, Eccleston P, Werneke U. An evidence and consensus based guideline for acute diarrhoea management. Arch Dis Child. 2001;85:132–142. A simple system to assess hydration status. % Dehydration Clinical signs 2–3 Thirst, mild oliguria 5 Discernable alteration in skin tone, slightly sunken eyes, some loss of intra-ocular tension, thirst, oliguria. Sunken fontanelle in infants. 7–8 Very obvious loss of skin tone and tissue turgor, sunken eyes, loss of intra-ocular tension, marked thirst, and oliguria. Often some restlessness or apathy. ≥ 10 All the foregoing, plus peripheral vasoconstriction, hypotension, cyanosis, and sometimes hyperpyrexia. Thirst may be lost at this stage. From Farthing NJG. Dehydration and rehydration in children. In: Arnaud MJ, ed. Hydration Throughout Life. London: John Libbey Eurotext; 1998: 159–173. With permission from Editions John Libbey Eurotext, Paris. The scale gives a semi-quantitative assessment of the dehydration severity and fluid loss. Farthing NJG. Dehydration and rehydration in children. In: Arnaud MJ, ed. Hydration Throughout Life. London: John Libby Eurotext; 1998:159–173. To correlate physiologic measurements, age, and previous health status to disease severity grading and subsequent risk of hospital death. [B] Age points Assign points to age as follows: Age (yrs) Points ≤ 44 0 45–54 2 55–64 3 75–74 5 ≥ 75 6 APACHE II Score [A] APS points = [B] Age points = [C] Chronic health points = Total APACHE II = [C] Chronic health points If the patient has a history of severe organ system insufficiency or is immuno-compromised assign points as follows: (a) For nonoperative or emergency postoperative patients 5 points or (b) For elective postoperative patients 2 points Definitions: Organ insufficiency or immunocompromised state must have been evident prior to this hospital admission and conform to the following criteria. LIVER: Biopsy proven cirrhosis and documented portal hypertension; episodes of past upper GI bleeding attributed to portal hypertension; or prior episodes of hepatic failure/encephalopathy/coma. CARDIOVASCULAR: New York Heart Association Class IV. RESPIRATORY: Chronic restrictive, obstructive, or vascular disease resulting in severe exercise restriction i. e. unable to climb stairs or perform household duties; or documented chronic hypoxia, hypercapnia, secondary polycythemia, severe pulmonary hypertension (> 40 mmHg), or respirator dependency. RENAL: Receiving chronic dialysis. IMMUNO-COMPROMISED: The patient has received therapy that suppresses resistance to infection, e.g. immuno-suppression, chemotherapy, radiation, long term or recent high dose steroids, or has a disease that is sufficiently advanced to suppress resistance to infection, e.g. leukemia, lymphoma, AIDS. The APACHE II score is the most commonly used survival prediction model in ICU’s worldwide. The worst values are recorded of the first 24 hours of the patient’s stay at the ICU. The score correlates well with mortality. The APACHE prognostic system used for severity of illness adjustments has been primarily created for patients admitted to an ICU. It has been successfully used in other setups, i. e. patients with pancreatitis. Knaus WA, Draper EA, Wagner DP, Zimmerman JE. APACHE II: A severity of disease classification system. Critical Care Medicine. 1985;13:818–829. The APACHE III system was developed to improve the risk prediction of dying in the hospital. Although APACHE III resembles APACHE II, it includes new variables such as prior treatment location and the disease requiring ICU admission. The system consists of two options: (1) the APACHE III score; and (2) a series of predictive equations for which the APACHE III score, in combination with prior treatment location and principal ICU diagnosis, is entered into a logistic regression equation. It compares each individual’s medical profile against nearly 18 000 cases in its memory before reaching a prognosis that is, on average, 95 % accurate. It uses daily updates of clinical information to provide a refinement of predicted mortality. The APACHE III Score is the sum of points assigned to Acute Physiology ([A] the APS Score, [B] Age, and [C] Chronic Health). The score ranges from 0–299 (physiology 0–252; age 0–24; chronic health 0–23). Score Pulse (beats/min): Select heart rate furthest from 75 ≤ 39 8 40–49 5 50–99 0 100–109 1 110–119 5 120–139 7 140–154 13 ≥ 155 17 Mean arterial blood pressure (MAP): Select MAP furthest from 90 ≤ 39 23 40–59 15 60–69 7 70–79 6 80–99 0 100–119 4 120–129 7 130–139 9 ≥ 140 10 Temperature (°C): Select core temperature furthest from 38. Add 1 degree centigrade to axillary temps prior to selecting worst value ≤ 32.9 20 33–33.4 16 33.5–33.9 13 34–34.9 8 35–35.9 2 36–39.9 0 ≥ 40 4 Respiratory rate (breaths/min)*: Select respiratory rate furthest from 19. *For patients on mechanical ventilation no points are given for respiratory rates of 6–12. ≤ 5 17 6–11 8 12–13 7 14–24 0 25–34 6 35–39 9 40–49 11 ≥ 50 18 PaO2 (mmHg)*. *Use only for nonintubated patients or intubated patients with FiO]2 < 0.5 (50 %). ≤ 49 15 50–69 5 70–79 2 ≥ 80 0 Or A-aDO2*. *Only use A-aDO2 for intubated patients with FiO2 ≥ 0.5 (50 %). Do not use PaO2 weights for these patients. < 100 0 100–249 7 250–349 9 350–499 11 ≥ 500 14 Hematocrit (%): Select hematocrit furthest from 45.5. ≤ 40.9 3 41–49 0 ≥ 50 3 WBC (cu/mm): Select WBC furthest from 11.5. < 1.0 19 1.0–2.9 5 3.0–19.9 0 20–24.9 1 ≥ 25 5 Creatinine without ARF* (mg/dL): Select creatinine furthest from 1.0 ≤ 0.4 3 0.5–1.4 0 1.5–1.94 4 ≥ 1.95 7 Or Creatinine with ARF* (mg/dL). *Acute Renal Failure (ARF) is defined as creatinine ≥ 1.5 mg/dL as creatinine ≥ 1.5 mg/dL and urine output < 410 mL/day and no chronic dialysis. 0–1.4 0 ≥ 1.5 10 Urine output (mL/day): Enter total for day ≤ 399 15 400–599 8 600–899 7 900–1499 5 1500–1999 4 2000–3999 0 ≥ 4000 1 BUN (mg/dL): Select highest BUN (furthest from 0) ≤ 16.9 0 17–19 2 20–39 7 40–79 11 ≥ 80 12 Sodium (mEq/L): Select Sodium furthest from 145.5 ≤ 119 3 120–134 2 135–154 0 ≥ 155 4 Albumin (g/dL): Select albumin furthest from 3.5 ≤ 1.9 11 2.0–2.4 6 2.5–4.4 0 ≥ 4.5 4 Bilirubin (mg/dL): Select highest bilirubin (furthest from 0) ≤ 1.9 0 2.0–2.9 5 3.0–4.9 6 5.0–7.9 8 ≥ 8.0 16 Glucose (mg/dL)*: Select glucose furthest from 130. *Glucose≥39 mg/dL is lower weight than 40–59 ≤ 39 8 40–59 9 60–199 0 200–349 3 ≥ 350 5 Neurological abnormalities. Zero points are assigned for a patient who is anesthetized, under the influence of anesthesia, or totally paralyzed/sedated during the ENTIRE data collection period. If unable to determine verbal score (due to intubation status or similar barriers), use clinical judgment and assign Glasgow Verbal Score according to the following scale: Alert, oriented 5 Confused 3 Nonresponsive 1 If the patient’s eyes open spontaneously (4) or to painful/verbal stimulation (2,3), use the following scale: If the patient’s eyes do not open spontaneously or to painful/verbal stimulation (1), use the following scale: Under age 16 Do not score ≤ 44 0 45–59 5 60–64 11 65–69 13 70–74 16 75–84 17 ≥ 85 24 AIDS 23 Hepatic failure 16 Lymphoma 13 Metastatic cancer 11 Leukemia/multiple myeloma 10 Immunosuppression 10 Cirrhosis 4 None/not available 0 Knaus WA, Wagner DP, Draper EA. The APACHE III prognostic system. Risk prediction of hospital mortality for critically ill hospitalized adults. Chest. 1991;100:1619–1636. To develop a simple scoring system reflecting the risk of death in ICU patients. Data is collected during the first 24 hours after ICU admission. If the SAPS is greater than 21 the expected mortality is greater than 80 %. Le Gall JR, Loirat P, Alperovitch A et al. A simplified acute physiology score for ICU patients. Crit Care Med. 1984;12:975–977. The goal of this scoring system is to assist in predicting the outcome in critically ill patients. Organ system Criteria Neurological Glasgow coma scale ≤ 6 (in the absence of sedation at anyone point in the day) Cardiovascular Mean arterial pressure ≤ 50 mmHg and/or Heart rate ≤ 50 beats/min and/or Need for volume loading and/or vasoactive drugs to maintain systolic blood pressure above 100 mmHg and/or Occurrence of ventricular tachycardia/fibrillation and/or Cardiac arrest and/or Acute myocardial infarction Pulmonary Respiratory rate ≤ 5/min or ≥ 50/min and/or Mechanical ventilation for ≥ 3days and/or Fraction of inspired oxygen (FiO2) > 0.4 and/or positive end-expiratory pressure > 5 cmH2O Gastrointestinal Stress ulcer necessitating transfusion of more than 2 units of blood per 24h and/or Hemorrhagic pancreatitis and/or Acalculous cholecystitis and/or Necrotizing enterocolitis and/or Bowel perforation Hepatic Clinical jaundice or total bilirubin level ≥ 3 mg/dL in the absence of hemolysis and/or Serum glutamic-pyruvic transaminase > twice normal and/or Hepatic encephalopathy Renal Serum creatinine level > 3.2 mg/dL and/or A two-fold creatinine rise in chronic renal failure, after correcting prerenal causes and mechanical obstruction and/or Acute need of renal replacement therapy (chronic renal failure was defined as serum creatinine > 2.3 mg/dL) Hematologic Hematocrit ≤ 20% and/or Leukocyte count ≤ 0.3 × 10⁹/L and/or Thrombocyte count ≤ 50 × 109/L and/or Disseminated intra-vascular coagulation From Knaus WA, Draper EA, Wagner DP, Zimmerman JE. Prognosis in acute organ-system failure. Ann Surg. 1985;202:685–693. With permission of Lippincott Williams & Wilkins (LWW). The number and duration of OSF are related to the outcome for ICU patients. Patients with ≥ 3 organ failures (cardiovascular failure, respiratory failure, renal failure, hematologic failure, neurological failure) show 80 % mortality on the first day and 100 % by the fifth to seventh day. Knaus WA, Draper EA, Wagner DP, Zimmerman JE. Prognosis in acute organ-system failure. Ann Surg. 1985;202:685–693. To produce a scoring system that represents the magnitude and severity of organ failure in septic patients. Sum of the squares of the three highest dysfunction ratings equals the SSS. The score includes both subjective and objective observations. Stevens LE. Gauging the severity of surgical sepsis. Arch Surg. 1983;118:1190–1192. To produce a scoring system that represents the magnitude and severity of organ failure in septic patients. SSS indicates the sum of the three highest squared rating points. The authors refined the Septic Severity Score by Stevens to minimize inter-observer variability. Incidence of mortality is strongly correlated to increased scores. Score Mortality (%) 0–15 0 15–30 41 > 30 82 From Skau T, Nyström PO, Carlsson C. Severity of illness in intra-abdominal infection. Arch Surg. 1985;120:152–158. With permission from Copyright © American Medical Association. All rights reserved. Skau T, Nyström PO, Carlsson C. Severity of illness in intra-abdominal infection. Arch Surg. 1985;120:152–158. To use an index to decide whether to re-operate in patients after major abdominal surgery, who present sudden or progressive deterioration. Variable Score Emergency surgery (at primary operation) 3 Respiratory failure 2 Renal failure 2 Ileus (from 72 h after surgery) 4 Wound infection 5 Consciousness alterations 8 Symptoms appearing from 4th day after surgery 2 Total From Pusajo JF, Bumaschny E, Doglio GR, Cherjovsky MJ, Lipinszki AI, Hernández MS, Egurrola MA. Postoperative intra-abdominal sepsis requiring reoperation; value of a predictive index. Arch Surg. 1993;128: 218–222. With permission from Copyright © American Medical Association. All rights reserved. Using the decision tree (Fig. 1.4) reduces the number of reoperations, the time to relaparotomy, and the length of the ICU-stay. Special studies include laboratory assays and imaging modalities. Pusajo JF, Bumaschny E, Doglio GR, Cherjovsky MJ, Lipinszki AI, Hernández MS, Egurrola MA. Postoperative intra-abdominal sepsis requiring reoperation; value of a predictive index. Arch Surg. 1993;128:218–222. Fig. 1.4 Abdominal reoperation predictive index (ARPI): Reoperation decision tree. To produce an objective score measuring the combined loss of organ function. Organ system Criteria Cardiovascular Mean arterial pressure ≤ 50 mmHg. Need for volume loading and/or vasoactive drugs to maintain systolic blood pressure above 100 mmHg. Heart rate ≤ 50 beats/min. Ventricular tachycardia/fibrillation. Cardiac arrest. Acute myocardial infarction. Pulmonary Respiratory rate ≤ 5/min or ≥ 50/min. Mechanical ventilation for three or more days or fraction of inspired oxygen (FiO2) > 0.4 and/or positive end-expiratory pressure > 5 mmHg. Renal Serum creatinine ≥ 280 μmol/L (3.5 mg/dL). Dialysis/ultrafiltration. Neurological Glasgow coma scale ≤ 6 (in the absence of sedation) Hematologic Hematocrit ≤ 20 %. Leukocyte count ≤ 0.3 × 10⁹/L (≤ 300/μL). Thrombocyte count ≤ 50 × 109/L (≤ 50 000/μL). Disseminated intra-vascular coagulation. Hepatic Total bilirubin level ≥ 51 μmol/L (3 mg/dL) in the absence of hemolysis. AST > 100 U/L. Serum glutamicpyruvic transaminase L−I. Gastrointestinal Stress ulcer necessitating transfusion of more than 2 units of blood per 24 h. Acalculous cholecystitis. Necrotizing enterocolitis. Bowel perforation. From Tran DD. Age, chronic disease. Crit Care Med. 1990;18:474–479. With permission of Lippincott Williams & Wilkins (LWW). The MOSF score is the sum of the failing organ systems in one day. The range is 0 to 7. For chronic renal insufficiency a twofold increase in serum creatinine or an acute need for function replacement therapy are scored as organ system failure. Tran DD. Age, chronic disease. Crit Care Med. 1990;18:474–479. Tran DD, Cuesta MA. Evaluation of severity in patients with acute pancreatitis. Am J Gastroenterol. 1992;87:604–608. To develop an objective scale to measure the severity of the multiple organ dysfunction syndrome in critically ill patients. The score is calculated by adding the worst scores from each organ system during the first 24 hours of admission to the ICU. A high initial MODS score and a large increase in score during the ICU stay correlate well with mortality. Marshall JC, Cook DJ, Christou NV, Bernard GR, Sprung CL, Sibbald WJ. Multiple organ dysfunction score: a reliable descriptor of a complex clinical outcome. Crit Care Med. 1995;23:1638–1652. To develop and validate a simple system for estimating the probability of hospital mortality among ICU patients at admission and at 24 hours. Variable β(SE) Estimated adjusted odds ratio (95 % confidence interval) Constant –5.46836 not applicable Physiology Coma or deep stupor 1.48592 (0.079) 4.4 (3.8–5.2) Heart rate ≥ 150 beats/min 0.45603 (0.145) 1.6 (1.2–2.1) Systolic blood pressure ≥ 90 mmHg 1.06127 (0.079) 2.9 (2.5–3.4) Chronic diagnoses Chronic renal insufficiency 0.91906 (0.105) 2.5 (2.0–3.1) Cirrhosis 1.13681 (0.126) 3.1 (2.4–4.0) Metastatic neoplasm 1.19979 (0.098) 3.3 (2.7–4.0) Acute diagnoses Acute renal failure 1.48210 (0.089) 4.4 (3.7–5.2) Cardiac dysrhythmia 0.28095 (0.068) 1.3 (1.2–1.5) Cerebrovascular incident 0.21338 (0.089) 1.2 (1.0–1.5) Gastrointestinal bleeding 0.39653 (0.094) 1.5 (1.2–1.8) Intra-cranial mass effect 0.86533 (0.088) 2.4 (2.0–2.8) Other Age (10-year odds ratio) 0.03057 (0.002) 1.4 (1.3–1.4) Cardiopulmonary resuscitation prior to admission 0.56995 (0.112) 1.8 (1.4–2.2) Mechanical ventilation 0.79105 (0.056) 2.2 (2.0–2.5) Nonelective surgery 1.19098 (0.074) 3.3 (2.8–3.8) Variable β(SE) Estimated adjusted odds ratio (95% confidence interval) Constant −5.64592 not applicable Variables ascertained at admission Age, 10-y odds ratio 0.03268 (0.002) 1.4 (1.3–1.4) Cirrhosis 1.08745 (0.135) 3.0 (2.3–3.9) Intra-cranial mass effect 0.91314 (0.095) 2.5 (2.1–3.0) Metastatic neoplasm 1.16109 (0.095) 2.5 (2.1–3.0) Medical or unscheduled surgery admission 0.83404 (0.080) 2.3 (2.0–2.7) 24-h assessments Coma or deep stupor at 24 h 1.68790 (0.082) 5.4 (4.6–6.4) Creatinine > 176.8 μmol/L (2.0 mg/dL) 0.72283 (0.078) 2.1 (1.8–2.4) Confirmed infection 0.49742 (0.070) 1.6 (1.4–1.9) Mechanical ventilation 0.80845 (0.067) 2.2 (2.0–2.6) Partial pressure of oxygen (PO2) < 7.98 kilopascal (60 mmHg) 0.46677 (0.077) 1.6 (1.4–1.9) Prothrombin time > 3 sec above standard 0.55352 (0.085) 1.7 (1.5–2.1) Urine output < 150 mL in 8 h 0.82286 (0.088) 2.3 (1.9–2.7) Vasoactive drugs > 1 h intravenously 0.71628 (0.65) 2.0 (1.8–2.3) The MPM0 is scored at admission, the MPM24 is scored if a patient remains at the ICU longer than 24 hours. The probability of hospital mortality is calculated as follows: Compute the logit g(x), defined as g(x) = β0 + β1x1 + β2x2 +… βkxk, where β0 is the constant and βixi is the estimated coefficient for the i th variable times the value of the i th variable, with i taking on the values from 1 to k being the number of variables in the MPM, except age, take on the value of 0 or 1, signifying the absence or presence, respectively, of the characteristic. Age is entered as age in years. The logit is transformed into a probability through the following calculation: Pr (hospital mortality) = [eg(x)/1 +eg (x)]. Lemeshow S, Teres D, Klar J, Avrunin J, Gehlbach SH, Rapoport J. Mortality probability models (MPM II) based on an international cohort of intensive care patients. JAMA. 1993;270: 2478–2486. To develop an objective method for assessing organ dysfunction among intensive care unit (ICU) patients on the first day of the ICU stay. Variables and definitions for the logistic organ dysfunction (LOD) system: All variables must be measured at least once. If they are not measured they are assumed to be within the normal range for scoring purposes. If they are measured more than once in the first 24 h the most severe value is used in calculating the score. Neurological system. Glasgow coma score: Use the lowest value; if the patient is sedated, record the estimated Glasgow coma score before sedation. The patient is free of neurological dysfunction if the estimated Glasgow coma score is 14 or 15. Renal system. Serum urea or serum urea nitrogen level: Use the highest value in mmol/L or g/L for serum urea, in mmol/L (mg/dL) of urea for serum urea nitrogen. Creatinine: Use the highest value in μmol/L (mg/dL). Urinary output: If the patient is in the ICU for less than 24 h, make the calculation for 24 h (e.g., 1 L/8 h = 3 L/24 h), If the patient is on hemodialysis, use the pretreatment values. Pulmonary system. If ventilated or under continuous positive airway pressure (CPAP), use the lowest value of the PaO2/FiO2, (fraction of inspired oxygen) ratio (whether PaO2 is mmHg or kPa). A patient who has no ventilation or CPAP during the first day is free of pulmonary dysfunction. Hematologic system. White blood cell count: Use the worst (high or low) white blood cell count that scores the highest number of points. Platelets: If there are several values recorded, find the lowest value and assign 1 LOD point if the lowest value is less than 50 × 109/L. Hepatic system. Bilirubin: Use the highest value in μmol/L (mg/dL). Prothrombin time (seconds or%): If there are several values recorded, assign 1 LOD point if the prothrombin time was ever more than 3 s above standard or less than 25% of standard during the day.
Performance Status
Performance Status: Karnofsky Scale
Aims
Comments
References
Performance Status: World Health Organization (WHO) Performance Classification
Aims
Eastern Cooperative Cancer Chemotherapie Group (ECOG) Performance Status
Aims
Comments
References
Performance Status: The ASA Classification of Anesthesia Risk
Aims
Comments
References
Mental Status
Mental Status: The Glasgow Coma Scale (GCS)—Level of Consciousness
Aims
Comments
References

Mental Status: Depth of Sedation
Aims
Comments
References
Mental Status: Depth of Sedation: Definition of General Anesthesia and Level of SedationAnalgesia by the American Society of Anesthesiologists
Aims
Comments
References
Mental Status: The Level of Cooperation
Aims
Comments
References
Mental Status: Observer Assessment of Alertness/Sedation Scale (OAA/S)
Comments
References
Mental Status: Neurophysiologic Function Analysis
References
Nutritional Status
Nutritional Status: The Body Mass Index
Aims
Comments
References
Nutritional Status: The Malnutrition Risk Scale
Aims
Comments
References
Nutritional Status: Nutritional Index According to Buzby
Aims
Comments
References
Nutritional Status: Maastricht Index of Nutritional Status
Aims
Comments
References
Nutritional Status: the Subjective Global Assessment (SGA)
Comments
References
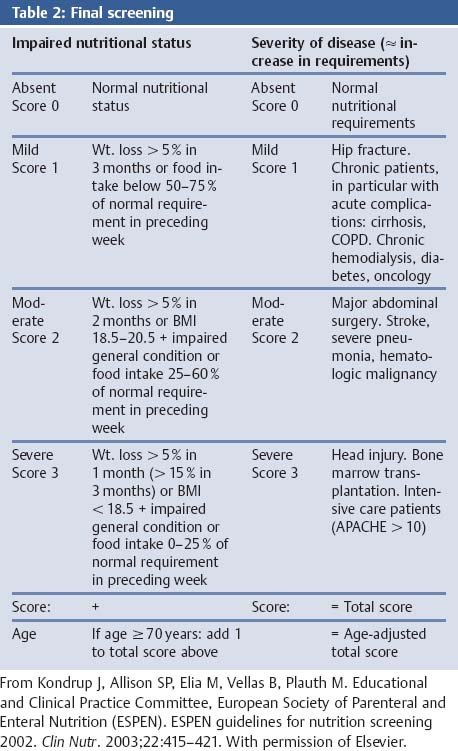
Nutritional Status: The NRS 2002
Aims
Comments
References
Nutritional Status: The Harris–Benedict Equation of Basal Energy Expenditure (BEE)
References
Hydration Status
Hydration Status: Dehydration—Physician Dehydration Rating Scale
Aims
Comments
References
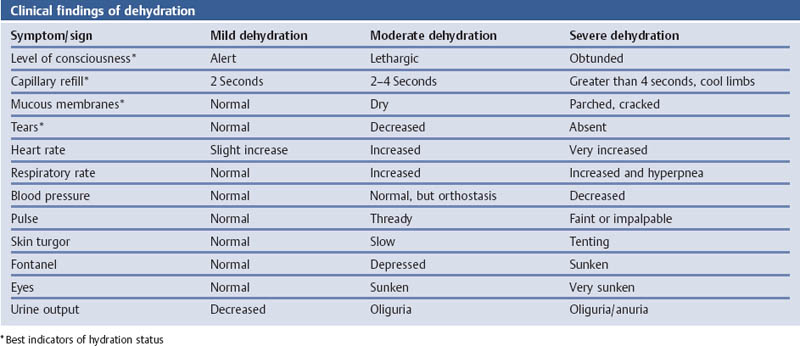
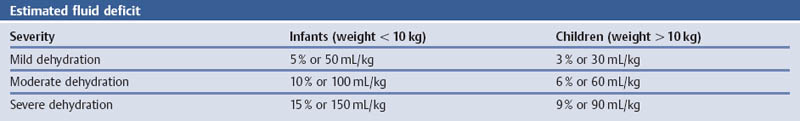
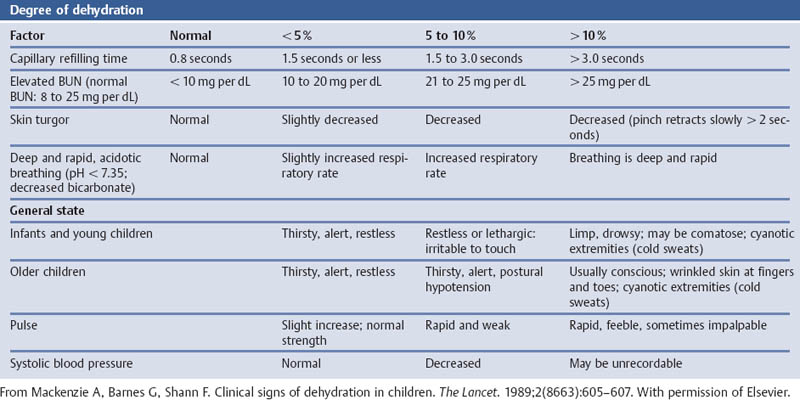
Hydration Status: Dehydration—WHO Guidelines for the Assessment of Dehydration and Fluid Deficit
Comments
References
References
References
Hydration Status: Dehydration—Simplified Guidelines for Assessing the Severity of Dehydration
Aims
Comments
References
Grading of Severity of Disease—Organ Failure
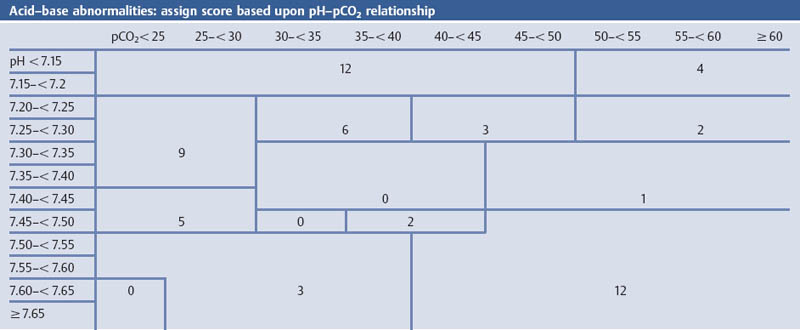
Grading the Severity of Disease: The APACHE II Score
Aims
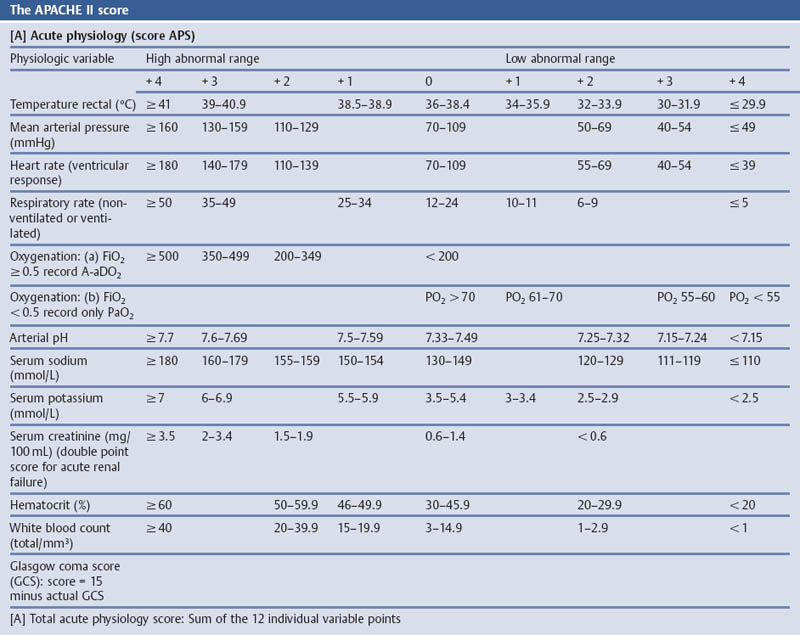
Comments
References
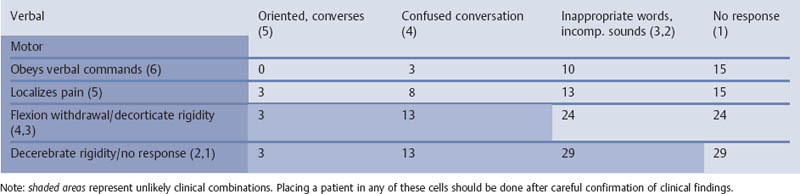
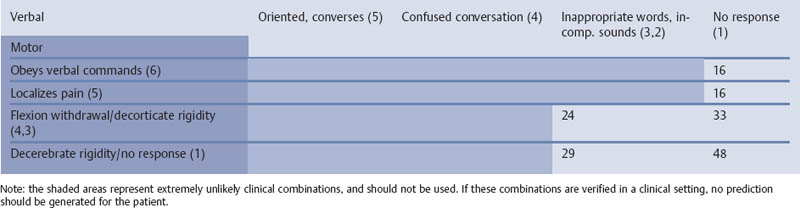
Grading the Severity of Disease: the APACHE III Score
Aims
References
http://www.apache-web.com/public/CalcAP3Score.xls.
http://www.apache-web.com/public/HospMortality.xls.
http://www.apache-web.com/public/CalcAPSScore.xls.
Grading the Severity of Disease: Simplified Acute Physiology Score (SAPS)
Aims
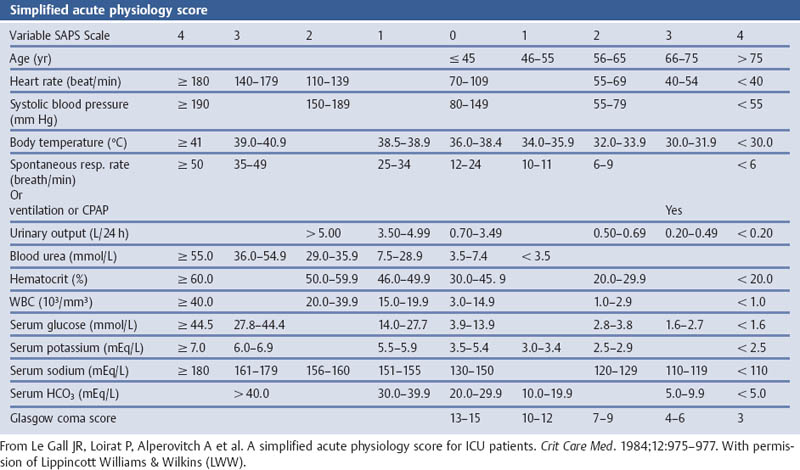
Comments
References
Grading the Severity of Disease: Organ System Failure (OSF)
Aims
Comments
References
Grading the Severity of Disease: Organ System Failure—the Septic Severity Score (SSS)
Aims
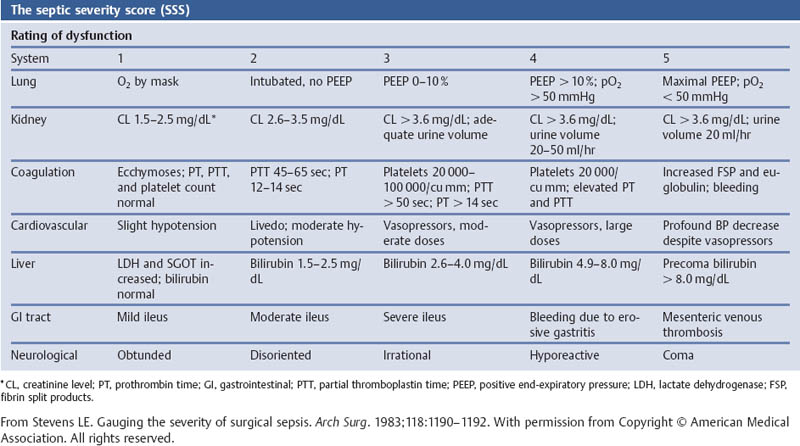
Comments
References
Grading the Severity of Disease: Organ Failure—the Septic Severity Score (SSS) Modified According to Skau
Aims
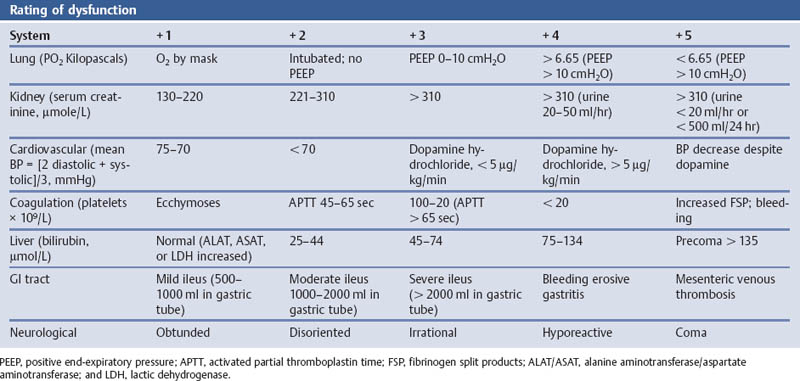
Comments
References
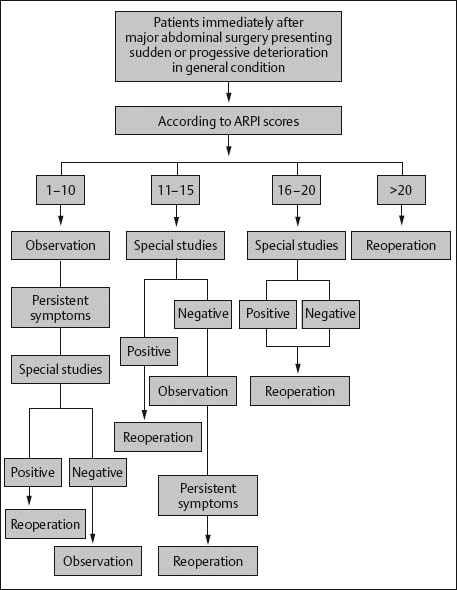
Grading the Severity of Disease: Sepsis—Abdominal Reoperation Predictive Index (ARPI)
Aims
Comments
References
Grading the Severity of Disease: Organ System Failure—Multiple Organ System Failure Score (MOSF Score)
Aims
Comments
References
Grading the Severity of Disease: Organ System Failure—the Multiple Organ Dysfunction Score (MODS)
Aims
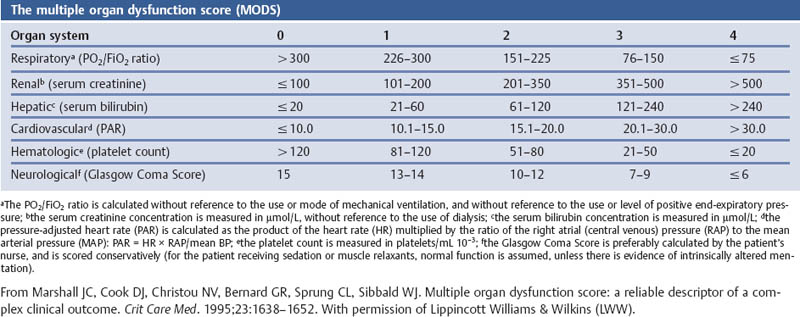
Comments
References
Grading the Severity of Disease: Mortality Probability Model II (MPM II)
Aims
Comments
References
Grading the Severity of Disease: Organ System Failure—the Logistic Organ Dysfunction (LOD) System
Aims
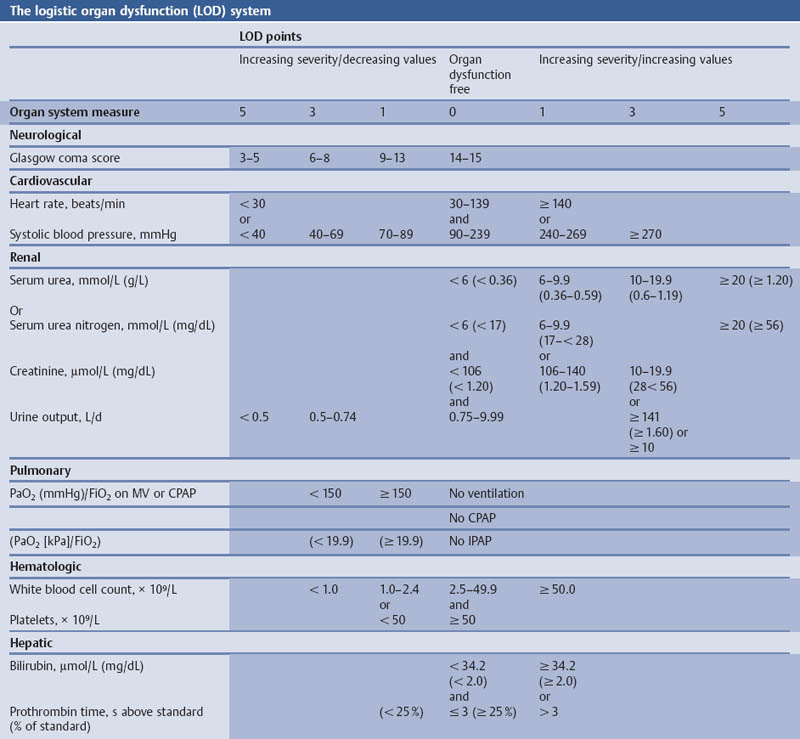
Comments
Related posts:
![]()
Stay updated, free articles. Join our Telegram channel

Full access? Get Clinical Tree