The treatment of gallbladder disease has been revolutionized by improvements in laparoscopic surgery as well as endoscopic and radiologic interventional techniques. Therapeutic success is dependent on accurate radiologic assessment of gallbladder pathology. This article describes recent technical advances in ultrasonography, multidetector computed tomography, magnetic resonance imaging, positron emission tomography, and scintigraphy, which have significantly improved the accuracy of noninvasive imaging of benign and malignant gallbladder disease. The imaging findings of common gallbladder disorders are presented, and the role of each of the imaging modalities is placed in perspective for optimizing patient management.
Recent technical advances in ultrasonography, multidetector computed tomography (CT), magnetic resonance imaging (MRI), and scintigraphy have significantly improved the accuracy of the noninvasive imaging of benign and malignant gallbladder pathology. Because of high diagnostic accuracy, wide availability, and ease of performance, ultrasonography and CT are the primary imaging tests for patients with suspected gallbladder and biliary tract pathology. MRI with magnetic resonance cholangiopancreatography (MRCP) is assuming an increasingly important role in the imaging armamentarium and has largely replaced diagnostic endoscopic retrograde cholangiopancreatography (ERCP). Evaluation of acute cholecystitis using hepatobiliary scintigraphy has diminished over the past decade. Positron emission tomographic (PET) imaging is being used with increased frequency to stage gallbladder neoplasms. This article presents the imaging findings of common gallbladder diseases, and the role of each of the imaging modalities is placed in perspective for optimizing patient management.
Cholelithiasis
The nature and size of a gallstone affects its imaging characteristics. Gallstones are comprised mainly of cholesterol, bilirubin, and calcium salts, with smaller amounts of protein and other materials including bile acids, fatty acids, and inorganic salts. In Western countries, cholesterol is the principal constituent of more than 75% of gallstones, with smaller amounts of calcium bilirubinate. Pure cholesterol stones contain more than 90% cholesterol and account for less than 10% of biliary calculi. The more cholesterol and less calcium a stone contains, the less likely will it be seen on CT scan, which best depicts predominantly calcified stones. Black or brown pigment stones consist of calcium salts of bilirubin and contain less than 25% cholesterol. These stones compose only 10% to 25% of gallstones in North America. These stones show a less-dramatic duct shadow than cholesterol or more calcified stones, particularly when present in the bile duct.
Plain Radiographic Findings
The abdominal plain radiograph is insensitive in depicting gallstones because only 15% to 20% are sufficiently calcified to be visualized. Oral cholecystography was the mainstay of gallstone detection for more than 50 years but was replaced in the late 1970s by ultrasonography.
Sonographic Findings
Ultrasonography is now the gold standard for the noninvasive diagnosis of cholelithasis. This imaging test is highly accurate (>96%), can be performed at the patient’s bedside, and does not require the use of ionizing radiation. Gallstones must fulfill 3 major sonographic criteria. They must (1) show an echogenic focus, (2) cast an acoustic shadow, and (3) seek gravitational dependence. Gallstones are accurately diagnosed when a 5 mm or larger defect meets all 3 major criteria. Stones smaller than 2 to 3 mm may be difficult to visualize. Small stones, however, are usually multiple in occurrence, assisting their detection.
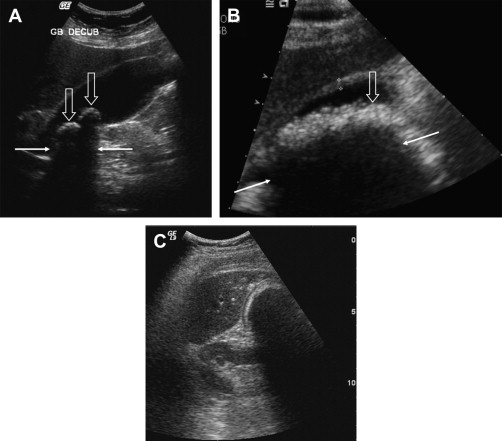
Gallstones produce 3 patterns of shadowing. The first is a discrete shadow ( Fig. 1 A) emanating from a solitary stone. The second pattern is confluent shadowing because of multiple stones (see Fig. 1 B) or gravel that abut each other in the gallbladder. The third pattern, the wall-echo-shadow (WES) complex (see Fig. 1 C) occurs when a contracted gallbladder is completely filled with gallstones. These stones give an echogenic double arc appearance, which consists of 2 parallel arcuate hyperechoic lines separated by a thin hypoechoic space and distal acoustic shadowing. The more superficial hyperechoic arc represents reflections from gallstones, and the hypoechoic space in between represents either a small sliver of bile between the wall and the stones or a hypoechoic portion of the gallbladder wall. The WES sign must be differentiated from a partially collapsed duodenal bulb, porcelain gallbladder, emphysematous cholecystitis, xanthogranulomatous cholecystitis, and a calcified hepatic artery aneurysm.
Gallstones characteristically produce “clean” shadowing without reverberation because most of the sound is absorbed by the stone. Bowel gas reflects 99% of the incident sound energy producing reverberations and backscatter echoes (dirty shadowing). Reverberation artifacts may be seen posterior to calcified stones that contain gas within fissures.
CT Findings
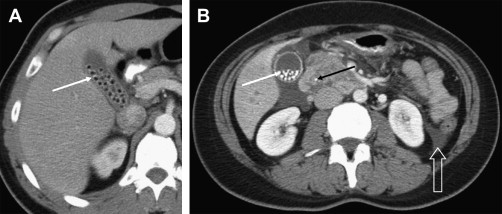
The CT appearance of gallstones is variable ( Fig. 2 ), depending on their composition; pattern of calcification; and the presence of lamellation, fissuring, or gas. Stones with high cholesterol content are difficult to visualize because they are isodense with the surrounding bile. Well-calcified stones are readily detected on CT scan. Stones that are denser than bile may be seen because of a rim or nidus of calcification. The CT attenuation of gallstones correlates more closely with the cholesterol content of the stones than with the calcium content. On CT scan, gallstones can be simulated by the enhancing mucosa of a contracted gallbladder wall or neck, which often folds on itself.
MRI Findings
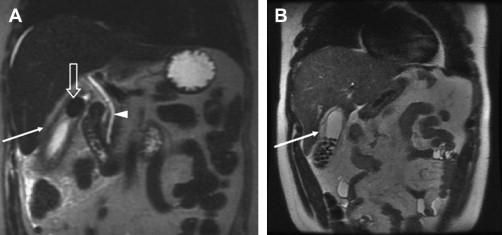
On MRI, most gallstones ( Fig. 3 ) produce little or no signal because of the restricted motion of water and cholesterol molecules in the crystalline lattice of the stone. Gallstones and bile duct stones are best seen on T2-weighted imaging sequences that produce bright bile. MRI is superior to CT in detecting small calculi because of the inherent contrast between low signal intensity stones and high signal intensity bile.
Choledocholithiasis
Choledocholithiasis is found in 7% to 20% of patients undergoing cholecystectomy and 2% to 4% of patients after cholecystectomy. These stones are usually silent unless they obstruct the common bile duct (CBD). Small calculi may intermittently cause colicky pain as they obstruct at the ampulla of Vater but generally pass into the duodenum. Larger stones between 5 and 10 mm in size are difficult to pass and can result in intermittent long-term symptoms and sequelae such as cholangitis and sepsis.
The detection of bile duct stones is easiest in the setting of biliary dilatation. But biliary dilatation is present in only 66% to 75% of patients with bile duct stones, and depiction of the stones may be difficult.
Sonographic Findings
Bile duct stones appear as echogenic foci within the fluid-filled duct that may cast an acoustic shadow in a sonograph. The stone may appear as an echogenic curved line; therefore, only the anterior margin is visualized. Stones may also appear with homogeneous echogenicity throughout the stone, with or without acoustic shadowing. Adjacent duodenal and colonic gas can make it difficult to image the distal CBD; therefore, sonography only has a sensitivity of 18% to 45% in the detection of CBD stones.
CT Findings
As with gallstones, the CT appearance of CBD stones is variable, depending on their composition and pattern of calcification. High-attenuation stones can be easily seen with the duct lumen even in the absence of biliary dilatation. Only 20% of common bile stones have a homogeneously high density. Other findings include a rim of high attenuation (which may be difficult to detect when impacted against the duct wall), soft tissue attenuation, and homogeneous near-water attenuation. Stones may rarely have sufficient pure cholesterol to appear in lower attenuation than surrounding bile. Multidetector CT with coronal reformatted images has a sensitivity of 76% to 80% in the depiction of bile duct stones.
MRI Findings
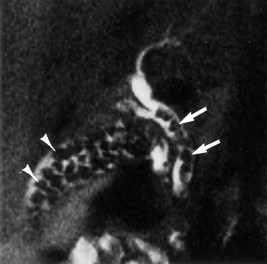
On MRI, CBD stones appear as foci of low signal intensity surrounded by bright bile on T2-weighted sequences ( Fig. 4 ). Stones as small as 2 mm can be depicted by this technique, which has an excellent sensitivity (81%–100%) and specificity (85%–99%). MRCP is superior to CT and ultrasonography in selecting patients who may benefit from preoperative ERCP. MRCP is recommended in patients with gallstones and a moderate-to-high suspicion of CBD stones based on clinical, sonographic, and laboratory data. MRCP can rule out CBD stones in up to 48% of patients with high preoperative probability of CBD stones.
Choledocholithiasis
Choledocholithiasis is found in 7% to 20% of patients undergoing cholecystectomy and 2% to 4% of patients after cholecystectomy. These stones are usually silent unless they obstruct the common bile duct (CBD). Small calculi may intermittently cause colicky pain as they obstruct at the ampulla of Vater but generally pass into the duodenum. Larger stones between 5 and 10 mm in size are difficult to pass and can result in intermittent long-term symptoms and sequelae such as cholangitis and sepsis.
The detection of bile duct stones is easiest in the setting of biliary dilatation. But biliary dilatation is present in only 66% to 75% of patients with bile duct stones, and depiction of the stones may be difficult.
Sonographic Findings
Bile duct stones appear as echogenic foci within the fluid-filled duct that may cast an acoustic shadow in a sonograph. The stone may appear as an echogenic curved line; therefore, only the anterior margin is visualized. Stones may also appear with homogeneous echogenicity throughout the stone, with or without acoustic shadowing. Adjacent duodenal and colonic gas can make it difficult to image the distal CBD; therefore, sonography only has a sensitivity of 18% to 45% in the detection of CBD stones.
CT Findings
As with gallstones, the CT appearance of CBD stones is variable, depending on their composition and pattern of calcification. High-attenuation stones can be easily seen with the duct lumen even in the absence of biliary dilatation. Only 20% of common bile stones have a homogeneously high density. Other findings include a rim of high attenuation (which may be difficult to detect when impacted against the duct wall), soft tissue attenuation, and homogeneous near-water attenuation. Stones may rarely have sufficient pure cholesterol to appear in lower attenuation than surrounding bile. Multidetector CT with coronal reformatted images has a sensitivity of 76% to 80% in the depiction of bile duct stones.
MRI Findings
On MRI, CBD stones appear as foci of low signal intensity surrounded by bright bile on T2-weighted sequences ( Fig. 4 ). Stones as small as 2 mm can be depicted by this technique, which has an excellent sensitivity (81%–100%) and specificity (85%–99%). MRCP is superior to CT and ultrasonography in selecting patients who may benefit from preoperative ERCP. MRCP is recommended in patients with gallstones and a moderate-to-high suspicion of CBD stones based on clinical, sonographic, and laboratory data. MRCP can rule out CBD stones in up to 48% of patients with high preoperative probability of CBD stones.
Gallbladder sludge
Gallbladder sludge is thick viscous bile that consists of cholesterol monohydrate crystals and calcium bilirubinate granules embedded in a gel matrix of mucus glycoproteins. It often develops in patients with prolonged fasting in intensive care units, trauma patients receiving total parenteral nutrition, and within 5 to 7 days of fasting in patients who have undergone gastrointestinal surgery. Sludge typically has a fluctuating course and may disappear and reappear over several months or years. Sludge may be an intermediate step in the formation of gallstones. Some 8% of patients with sludge will develop asymptomatic gallstones.
Sludge produces low-amplitude, nonshadowing echoes that tend to layer in the most dependent portion of the gallbladder and moves slowly when the patient changes positions ( Fig. 5 ). Aggregated sludge may appear as a mobile nonshadowing, echogenic, intraluminal mass (sludge ball) or as a nonshadowing polypoid mass (tumefactive sludge) in the dependent portion of the gallbladder. A gallbladder completely filled with sludge may be isoechoic with the adjacent liver and difficult to identify, hence called hepatization of the gallbladder. Sludge is also different in appearance from gravel and multiple small stones in that sludge is echogenic but does not cast an acoustic shadow. In addition, sludge is more viscous and does not seek gravitational dependence as rapidly as gravel.
Acute cholecystitis
Acute cholecystitis results from obstruction of the gallbladder neck or cystic duct by a gallstone in 80% to 95% of patients. Acute acalculous cholecystitis (AAC) composes 5% to 15% of cases of acute cholecystitis and is typically caused by diminished gallbladder emptying (eg, in patients with severe trauma/surgery, burns, shock, anesthesia, diabetes); by decreased blood flow in the cystic artery because of obstruction, hypotension, or embolization; or by bacterial infection. Although most patients present with typical right upper quadrant symptoms, this diagnosis may be challenging in patients with complicated systemic disease and sepsis.
Patients with suspected cholecystitis should be imaged for 2 major reasons. First, most patients (60%–85%) referred to exclude cholecystitis have other causes of right upper quadrant pain, including peptic ulcer disease, pancreatitis, hepatitis, appendicitis, hepatic congestion from right-sided heart failure, perihepatitis from pelvic inflammatory disease (Fitz-Hugh-Curtis syndrome), right lower lobe pneumonia, right-sided pyelonephritis, or nephroureterolithiasis. If the patient does not have acute cholecystitis, the clinical workup can be redirected before the patient’s clinical condition deteriorates. Secondly, imaging can diagnose severe complications such as emphysematous cholecystitis and perforation, which require immediate surgery.
Patients with suspected acute cholecystitis should be evaluated with ultrasonography as the initial imaging procedure. If the diagnosis is in doubt, it can be confirmed with hepatobiliary scintigraphy or CT. Multidetector CT is often initially performed in many cases because the diagnosis is unclear. CT is also helpful in suspected complications of acute cholecystitis, such as emphysematous cholecystitis or gallbladder perforation. MRI is usually used to exclude obstructing and nonobstructing biliary tract stones.
The morphologic changes that occur in acute cholecystitis are well depicted in imaging studies and result from the presence of stones, increased mural blood flow, and capillary leakage caused by inflammatory changes, mural thickening of the gallbladder, and pericholecystic fluid.
Sonographic Findings
The sonographic findings of acute uncomplicated cholecystitis include gallstones often impacted in the cystic duct or gallbladder neck ( Fig. 6 ), mural thickening (>3 mm), a 3-layered appearance of the gallbladder wall, hazy delineation of the gallbladder, localized pain with maximal tenderness elicited over the gallbladder (sonographic Murphy’s sign), pericholecystic fluid, and gallbladder distension. Gallstones and the sonographic Murphy’s sign are the most specific indicators of acute cholecystitis with a positive predictive value of 92%. The sonographic Murphy’s sign may be difficult to elicit in obtunded patients and those who have received pain medication. The sign may be absent in patients with gangrenous cholecystitis. Finding an impacted stone in the cystic duct or gallbladder neck also increases the likelihood of acute cholecystitis.
Multidetector CT Findings
The CT findings ( Fig. 7 ) of acute cholecystitis have been well described and include gallstones, mural thickening of the gallbladder, mural edema, pericholecystic fluid and inflammation, and transient increased enhancement of the liver parenchyma adjacent to the gallbladder caused by hyperemia. CT is less sensitive (75%) than ultrasonography in the depiction of gallstones. Stones with significant calcification or the presence of gas in a noncalcified stone (the Mercedes-Benz sign) are best seen with CT. The CT findings of acute cholecystitis have been divided into major and minor criteria. Major findings include calculi, mural thickening of the gallbladder, pericholecystic fluid, and subserosal edema. Minor findings are gallbladder distension and sludge. The overall sensitivity, specificity, and accuracy of CT for the diagnosis of acute cholecystitis are 91.7%, 99.1%, and 94.3%, respectively.
MRI Findings
MRI ( Fig. 8 ) rivals ultrasonography and CT in the depiction of acute cholecystitis. On postgadolinium T1-weighted images, acute cholecystitis manifests as increased mural enhancement, mural thickening, and transient increased enhancement of the adjacent liver parenchyma. Findings on T2-weighted images include the presence of gallstones, the presence of an intramural abscess appearing as a hyperintense focus in the gallbladder wall, and increased wall thickness. Periportal edema depicted as periportal high signal intensity may be observed but is a nonspecific finding.
Hepatobiliary Scintigraphy
Radionuclide cholescintigraphy with technetium Tc 99m-labelled iminodiacetic acid analogs (hepatobiliary iminodiacetic acid scan) was first introduced in the late 1970s. In this study, hepatic parenchymal uptake is observed within 1 minute, with peak activity occurring at 10 to 15 minutes. The bile ducts are usually visualized within 10 minutes, and the gallbladder should fill with isotope within 1 hour if the cystic duct is patent. If the gallbladder is not identified, delayed imaging up to 4 hours should be performed. Prompt biliary excretion of the isotope without visualization of the gallbladder is the hallmark of acute cholecystitis ( Fig. 9 ).
False-positive results may occur in patients with abnormal bile flow because of hepatic parenchymal disease or a prolonged fast with a distended, sludge-filled gallbladder. Delayed gallbladder filling can be seen in the setting of chronic cholecystitis.
Acute acalculous cholecystitis
Acute gallbladder inflammation in the absence of stones, AAC, is seen in 2% to 15% of patients undergoing cholecystectomy and accounts for 47% of cases of postoperative cholecystitis and 50% of children with acute cholecystitis. It is difficult to make the diagnosis of AAC clinically and on imaging.
AAC has a mortality rate approaching 60% and should be considered in every postoperative, posttraumatic, or coronary care patient with sepsis. AAC typically results from a gradual increase of bile viscosity because of prolonged stasis that leads to functional obstruction of the cystic duct. Mural necrosis occurs in 60% of cases, and gangrene and perforation are common.
Sonographic findings of AAC include gallbladder distention and sludge, with more specific signs of mural thickening, hypoechoic regions within the wall ( Fig. 10 A), pericholecystic fluid, diffuse increased echogenicity within the gallbladder resulting from hemorrhage, pus, intraluminal membranes, and a positive sonographic Murphy’s sign.
Related posts:


Stay updated, free articles. Join our Telegram channel

Full access? Get Clinical Tree


