Fig. 23.1
Various types of intraoperative ultrasound (IOUS) probes
Clinical Usefulness
Kupffer imaging makes it possible to visualize the location, size, and shape of tumors that are difficult to visualize in B-mode images and at the same time allows the courses of vessels near tumors to be confirmed before resection. This is a great advantage for surgical application. As shown in Fig. 23.2, the difference between conventional B-mode and Kupffer images are obvious. The exact shape of the tumor, which cannot be determined accurately in the B-mode image, is clearly depicted in the Kupffer image.
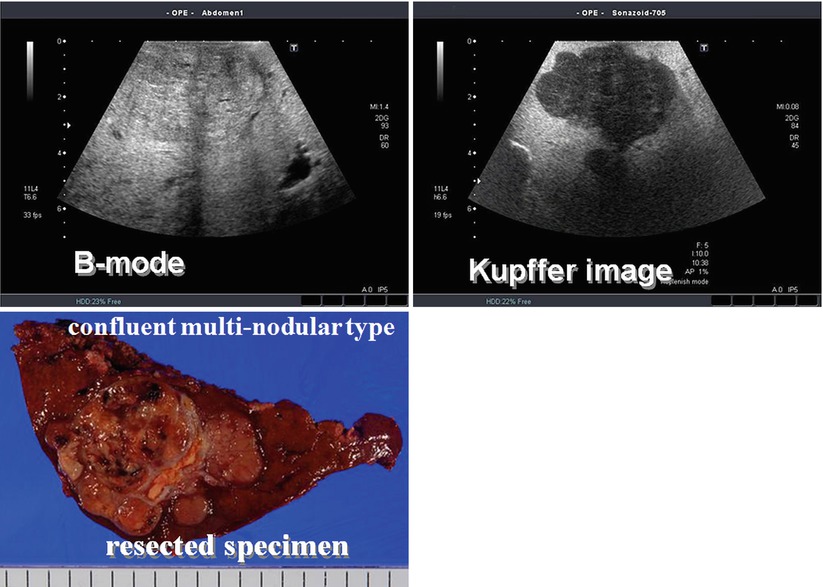
Fig. 23.2
IOUS B-mode and Kupffer images of a malignant liver tumor with a resected specimen
Kupffer imaging is also useful for detecting small malignant lesions. Metastases measuring less than 5 mm cannot be often visualized by B-mode. Kupffer imaging, on the other hand, is able to detect smaller intrahepatic metastases, as shown in Fig. 23.3.
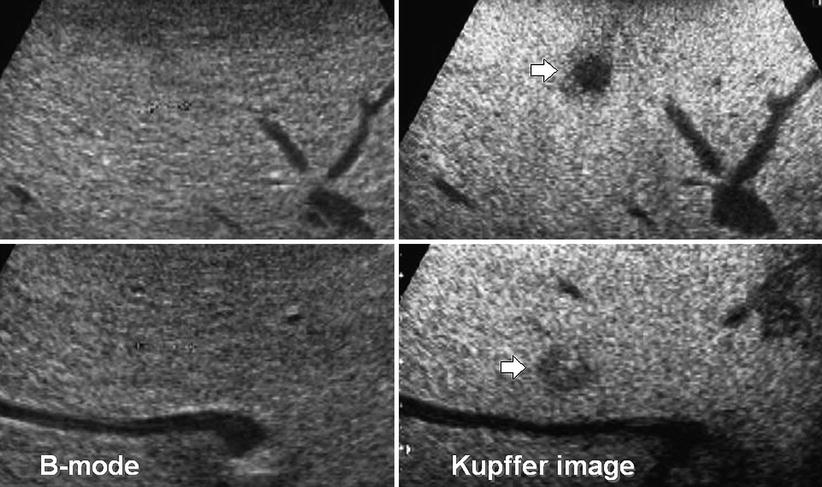
Fig. 23.3
IOUS B-mode and Kupffer images showing liver metastases (arrows) from a pancreatic cancer. While these tumors are difficult to recognize by B-mode, these are readily detected by Kupffer images
Attempts have also been made to assess the degree of tissue differentiation by observing the courses of vessels within the tumor in the vascular phase. When micro-flow imaging (MFI), which displays bubble motion as a summed residual image, is used, fine blood vessels exhibiting various degrees of differentiation can be observed within an HCC, as shown in Fig. 23.4 (see also Video 23.1). It has been found that well-differentiated carcinomas exhibit the so-called “cotton pattern” and moderately differentiated carcinomas exhibit the “vascular pattern.”
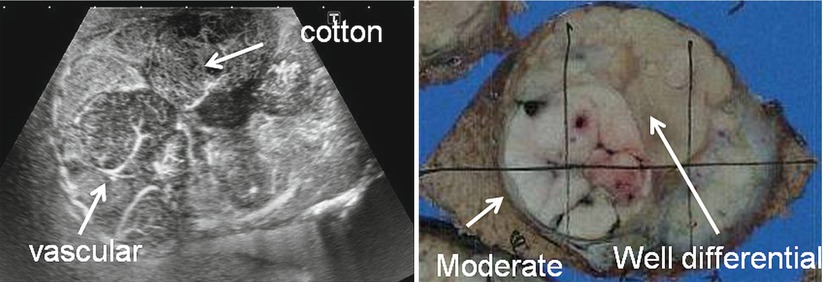
Fig. 23.4
IOUS image of multinodular HCC (hepatoma) (left) and a section of corresponding area of a resected specimen (right). See also Video 23.1
Portal Invasion by Tumors
The degree of portal invasion must be carefully assessed before surgery. Using MFI, it is possible to observe portal invasion in the early stages, as shown in Fig. 23.5 (see also Video 23.2). This image shows the leakage of portal vein blood in a pattern known as the “thread and streak sign,” in which small straight lines are seen in areas of portal invasion.
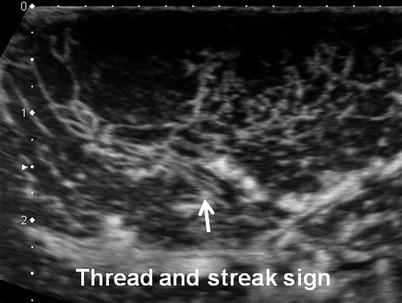
Fig. 23.5
IOUS image showing thread and streak sign in vascular MFI (micro-flow imaging). See also Video 23.2
Conclusion
Contrast-enhanced ultrasound (CEUS) is useful for navigation in surgery of the liver. In addition, liver metastases can be more accurately diagnosed before surgery. The clear depiction of such tumors including primary and metastatic tumors provides extremely valuable information before liver surgery. (As of 2013, in the United States, Sonazoid® is not approved by FDA).
Intraoperative Ultrasound 3D Display Techniques and Cavity and FlyThru Methods
Introduction
Various 3D display techniques have recently been introduced in the field of ultrasound diagnosis. Such 3D techniques, which provide images that depict structures more accurately than 2D images, have been clinically employed for the examination of the fetus, luminal structures in the abdomen, and the internal structure of the heart as well as for the evaluation of the cardiac valves and myocardium. In particular, recent advances in graphics workstations and computer graphics have led to the development of 3D display techniques for CT and MRI images, and 3D display is now employed proactively in clinical practice. Here, intraoperative ultrasound 3D display techniques and the cavity and FlyThru methods, which are based on virtual reality technology, are briefly discussed.
How Are 3D Images Obtained?
Precisely determining the positions of the imaging planes is essential for accurately depicting 3D structures. Two techniques are available (Fig. 23.6): the matrix array (2D array) technique, which electronically aims the ultrasound beam in the desired direction, and the mechanical scanning technique, which swings the transducer elements of the 2D probe back and forth. The former technique requires advanced micromachining technology, complex electronic processing, and large-scale integrated circuits but controls beam acquisition electronically and provides a high degree of flexibility during scanning (Fig. 23.6, left). A major disadvantage of this technique is that the number of transducer elements and amount of circuitry required increases as the square of that for conventional systems, and systems employing this technique are therefore expensive. The latter technique can be implemented by combining existing technology and mechatronics, and the required circuitry can be incorporated by simply adding a mechanical control section to the standard 2D imaging circuits. This helps to control (save) the cost (Fig. 23.6, right). In both techniques, 3D information is obtained based on the ultrasound beams in the scanning field as shown in Fig. 23.6, and 3D images are reconstructed from this three-dimensionally extended fan-shaped ultrasound echo information.
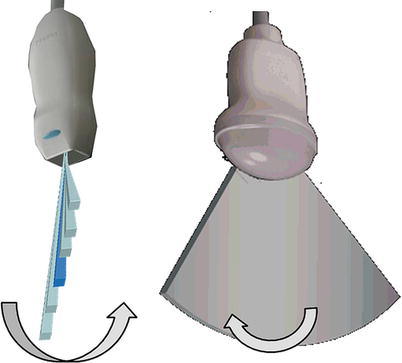
Fig. 23.6
Acquisition method for 3D data. Left: 2D array method. Right: mechanical method
How Is 3D Information Displayed?
Details of the 3D information display (3D rendering) technique have been discussed elsewhere [1, 2], and therefore a brief summary of 3D rendering is provided here.
Multiplanar reconstruction (MPR) is the standard technique for displaying a 3D volume as slice images. In MPR, the three orthogonal planes in a 3D volume are displayed simultaneously as shown in Fig. 23.7 (see also Video 23.3). Normally, the plane of ultrasound scanning is defined as the A-plane; the scanning plane perpendicular to the A-plane is defined as the B-plane (i.e., the plane in which the transducer elements swing in the mechanical technique); and the plane perpendicular to both the A-plane and the B-plane is defined as the C-plane. Such images are intuitive and easy to interpret, but the simultaneously displayed area is limited, and it is therefore necessary to align the planes with the region of interest.
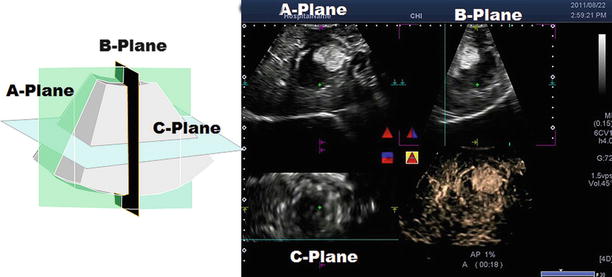
Fig. 23.7
Three planes of 3D (left) and MPR (multi-planar reconstruction) display method in CEUS (right). See also Video 23.3
In the multiview method, many slice images at different slice positions in one of the MPR planes are displayed (Fig. 23.8) (see also Videos 23.4, 23.5, and 23.6). This is the basic 3D display method and is suitable for observing the 3D information in its entirety by selecting the desired display plane from among A, B, and C.
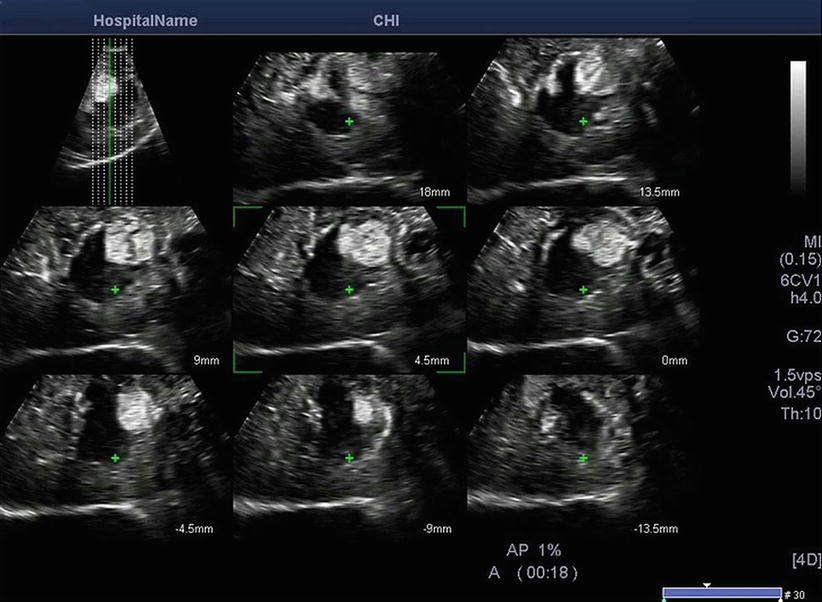
Fig. 23.8
Multiview method (example of A-plane display): many slice images. See also Videos 23.4, 23.5, and 23.6 showing A-plane, B-plane, and C-plane
What Is the Cavity Method?
In the cavity method, which is also referred to as the inversion method, the brightness of the image is inverted and the image is then displayed three-dimensionally so that areas of low brightness, such as the lumens of hollow structures, can be clearly visualized. This is useful for observing the overall luminal morphology and vascular structures (Fig. 23.9) (see also Video 23.7). When this method is employed for Kupffer imaging in contrast-enhanced ultrasound examinations, the positional relationships between a tumor and nearby vessels can be clearly observed in real time. This technique is expected to be useful for real-time navigation during surgical procedures.
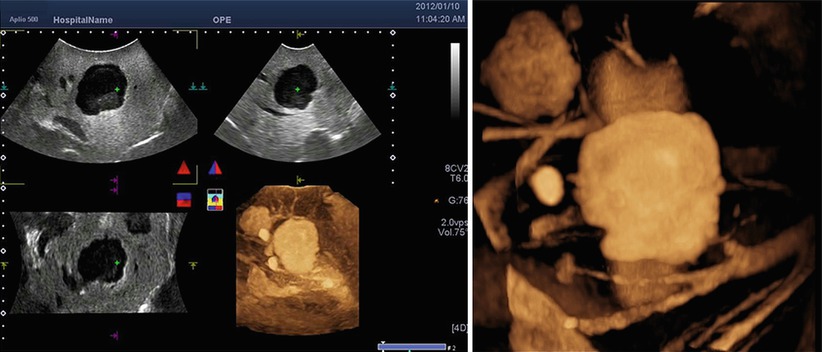
Fig. 23.9
Cavity display in IOUS Kupffer imaging of metastases. See also Video 23.7. Left: multiview three planes and cavity display. Right: cavity display
What Is the FlyThru Method?
The terms “fly-through” and “virtual endoscopy” have been used in 3D diagnostic imaging modalities such as CT and MRI. “Fly-through” refers to “flying through the human body,” and virtual endoscopic 3D display in which the observer appears to be flying through luminal structures such as the trachea or blood vessels is known as FlyThru. This method makes it possible to observe the courses of luminal structures and blood vessels and also to detect the presence of plaque, protrusions (e.g., tumor invasion), or external compression from any desired viewpoint within the lumen. Examples of typical clinical applications are shown in Fig. 23.10 (see also Video 23.8 and 23.9).
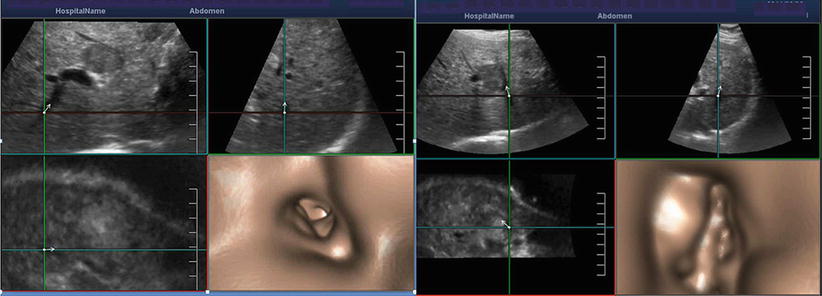
Fig. 23.10
FlyThru display of HCC and portal and hepatic veins. See also Videos 23.8 and 23.9. Left: multiview three planes and FlyThru (right lower) of PV (portal vein). Right: multiview three planes and FlyThru (right lower) of HV (hepatic vein)
Conclusion
The usefulness of 3D display in ultrasound has been discussed for many years. Cardiovascular examinations have led the way in the clinical application of 3D display, and the value of 3D display has been confirmed, particularly for the detailed evaluation of the cardiac valves. The value of 3D has also been confirmed in its application to obstetric examinations. Recently, with the development of 2D array technology, new 3D display techniques with improved real-time performance characteristics are being explored.
Fusion Technique for Combining Ultrasound with CT and MR
Introduction
The fusion technique allows the volume-to-volume fusion of images acquired by two different modalities. Real-time ultrasound images can be viewed in the same cross-sectional planes as in previously acquired CT or MR volume data. This makes it possible to observe structures from the same locations and to navigate in the region of interest. The fusion technique reads 3D DICOM datasets from all major imaging modalities and displays the corresponding images in real time next to the live ultrasound display, as shown in Fig. 23.11. To permit comprehensive pre- and post-intervention evaluation, Smart Fusion is available in all ultrasound imaging modes, including color Doppler and contrast-enhanced ultrasound.
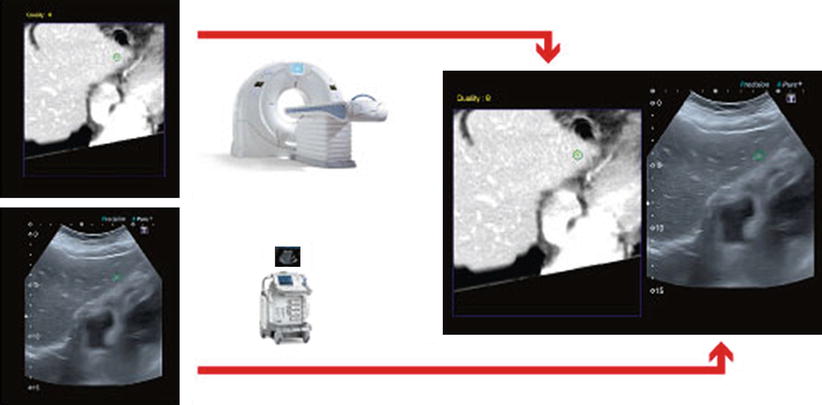
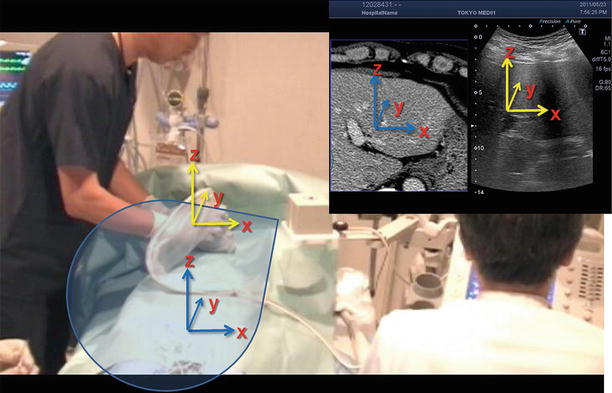
Fig. 23.11
Fusion technology. The fusion technique displays both a CT image and an ultrasound image simultaneously
Easy Setup
Image alignment is required in order to synchronize the ultrasound images and CT/MR volumes. Figure 23.12 shows how the image directions are set using an ultrasound probe. A position sensor attached to the ultrasound probe receives position information from a magnetic field generator. After setup, the ultrasound image and the CT or MR image are precisely synchronized, and after synchronization, the positions of the images are adjusted automatically.