Fig. 9.1
Sagittal view of the abdominal aorta. Note the sample volume (large arrow) within the lumen of the aorta. The Doppler beam (small arrow) is adjusted to an angle of 60° relative to the direction of flow
Spectral Broadening: Normal arterial flow is laminar, and spectral waveforms taken in a discrete sample volume will display a relatively narrow band of frequencies. In areas of stenosis or other abnormalities that disrupt laminar flow, these disturbances will display a broader range of frequencies at any given point in time. This increase in width of the displayed frequency shifts is referred to as spectral broadening and along with increases in the peak-systolic and end-diastolic velocities is used as a criterion to define stenosis within arterial beds (see Fig. 9.2).
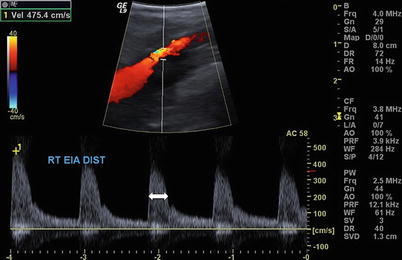
Fig. 9.2
Sagittal view of the right external iliac artery with elevated velocity (475 cm/s) and spectral broadening (arrow) consistent with turbulence and flow limiting stenosis
Aliasing: One of the physical limitations of ultrasound is the frequency at which ultrasound pulses can be sent in order to ensure that the reflected signal from each pulse is received before the transmission of the next pulse. The limitation of this pulse repetition frequency (PRF) is defined as
 where C is the speed of sound in tissue and d is the distance from the transducer to the sample volume. Higher PRF values result in more ultrasound pulses to provide a better representation of the Doppler signal. When the pulsed Doppler provides less than two samples for each cycle of the Doppler signal, a phenomenon called aliasing occurs where the spectral waveform appears to be “cut off” and then “wraps around” and appears as flow below the baseline. This is an artifact of the sampling process and can occur in an area with high flow velocity, such as a jet of blood associated with a severe stenosis, or in deep structures where low PRF values are needed to detect flow due to the attenuation of the additional tissue. The same effect can be seen in color flow imaging, where aliasing results in flow appearing to be present in opposite directions (colors) at a single sample volume. This is often referred to as a “color bruit” (see Fig. 9.3a, b).
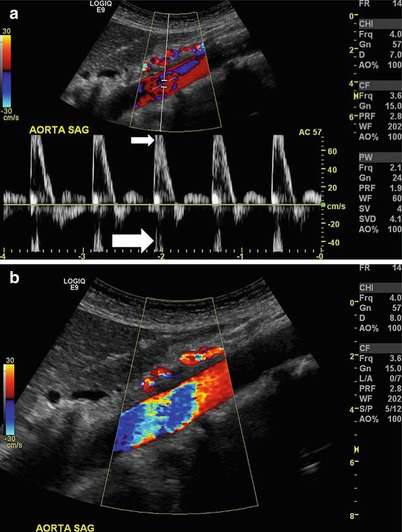
Fig. 9.3
Aliasing. (a) Sagittal view of the aorta where the relationship between the pulse repetition frequency and velocity causes the spectral waveform to be cut off (small arrow) and wrap around below the baseline (large arrow). (b) Color flow used in sagittal view of the same aorta as in (a). While multiple colors (color bruit) suggest turbulence, this is in fact an artifact of aliasing
Anatomy
Vascular structures in the abdomen and retroperitoneum that are typically imaged with ultrasound include the aorta and its branches, as well as the vena cava and associated branches, and the portal circulation. Variations in anatomy can provide challenges, but many of these variations are well described, and an experienced technician can typically identify them. Obesity provides perhaps the greatest challenge to accurate identification of disease within the abdominal vascular structures. Bowel gas also limits visualization and these tests are best performed in the morning or at a time when the patient has had limited oral intake to limit associated bowel gas.
Aorta: The abdominal aorta lies in the retroperitoneum and is typically imaged from the midline. Lower-frequency transducers will sacrifice resolution but are required to adequately image structures at this depth. An ultrasound unit with color flow Doppler capabilities is necessary, and proper imaging requires range-gated spectral Doppler that has the ability to adjust the depth and position of the range gate within the area of interest. Both longitudinal and transverse views are required to assess the aorta for flow and size. The aorta should be visualized in its proximal, mid-, and distal portions, and aneurysm size should be determined at its widest diameter measured outer wall to outer wall (see Fig. 9.4a, b).
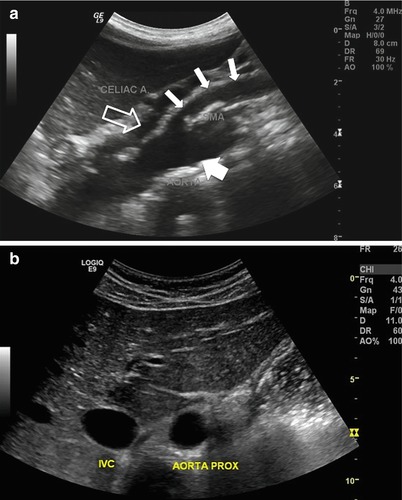
Fig. 9.4
(a) Gray-scale sagittal image of the aorta visualizing the proximal aorta (large arrow), celiac trunk (hollow arrow), and superior mesenteric artery (small arrows). Note the use of the liver as an acoustic window to visualize the proximal aorta. (b) Gray-scale transverse view of the aorta and adjacent inferior vena cava (IVC). The liver is used as an acoustic window
Visceral/Renal Arteries: Imaging of these vessels in any significant detail is best performed in a qualified and accredited facility by experienced operators. These challenging studies require a thorough understanding of both typical and variant anatomy among these adjacent structures. The celiac trunk and the superior mesenteric artery, the two most cephalad aortic branches, can be imaged in both a transverse and longitudinal axis. From a transverse image, the celiac trunk can be followed to its bifurcation into the splenic and hepatic arteries. The superior mesenteric artery can be visualized at its origin from the aorta in a longitudinal plane, with the left renal vein seen between it and the aorta. The renal arteries can also be imaged from an anterior position; however, in order to accurately identify and quantify flow in the distal arteries, a flank approach may be necessary with the kidney serving as an acoustic window (see Figs. 9.5a, b, 9.6a, b and 9.7a, b).
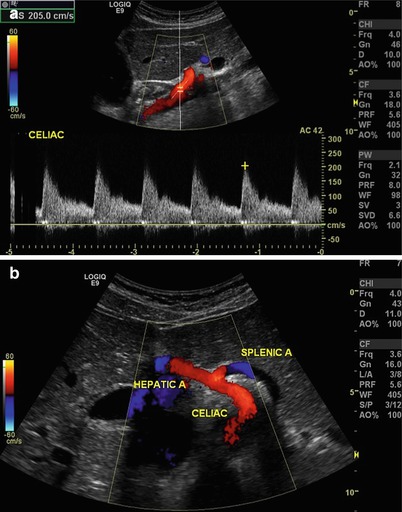
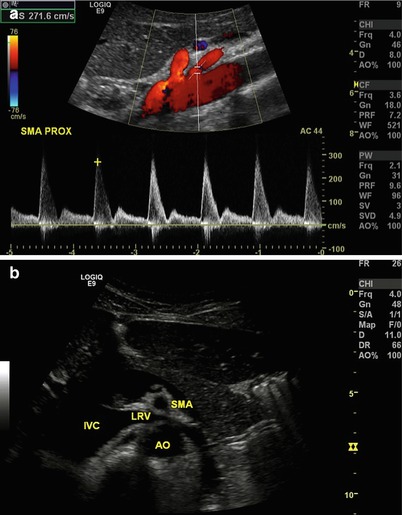
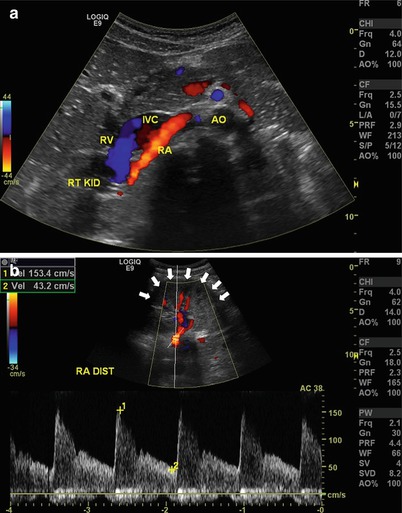
Fig. 9.5
(a) Longitudinal view of the aorta with Doppler interrogation of origin of the celiac trunk. Peak systolic velocity is 205 cm/s suggesting no evidence of significant stenosis. (b) Transverse view of the celiac trunk and hepatic and splenic arteries. Color flow is useful to identify vascular structures
Fig. 9.6
(a) Longitudinal view of the aorta with Doppler interrogation of origin of the superior mesenteric artery. Peak systolic velocity is 271.6 cm/s suggesting no evidence of significant stenosis. (b) Transverse view of the aorta (AO) and superior mesenteric artery (SMA), with the left renal vein (LRV) interposed between as it empties into the inferior vena cava (IVC). Note the similarity between this and a familiar view from cross-sectional imaging such as CT or MRI
Fig. 9.7
(a) Transverse view of the right renal artery (RA) as it exits the aorta (AO) and lies posterior to the inferior vena cava (IVC). RV renal vein, RT KID right kidney. (b) The distal renal artery (RA DIST) may sometimes need to be imaged by placing the transducer on the flank and using the kidney (arrows) as an acoustic window
Vena Cava: The vena cava is imaged in a similar fashion to the abdominal aorta. Transverse and longitudinal views can be used, and color flow is often helpful to identify these large vascular structures that lie in the retroperitoneum. The vena cava can be imaged both centrally (at the hepatic vein confluence) and more distally (between the renal veins and the caval bifurcation). Overlying bowel gas is the most consistent challenge to overcome adequate imaging of these structures (see Fig. 9.8a, b).
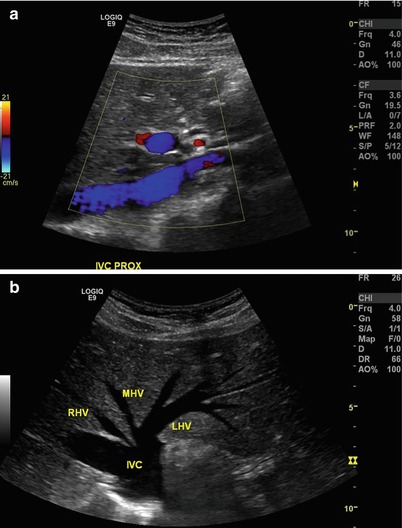
Fig. 9.8
 Introduction: The Importance of Ultrasound in a Surgical Practice
Abdominal Ultrasound: Credentialing and Certification
Introduction: The Importance of Ultrasound in a Surgical Practice
Abdominal Ultrasound: Credentialing and Certification
 Trauma Ultrasound
 Techniques in Laparoscopic and Intraoperative Ultrasound Guidance
 Abdominal Wall Anatomy, Pathology, and Intervention
 Percutaneous Ultrasound Guidance Techniques and Procedures


(a) Longitudinal view of the proximal inferior vena cava at the level of hepatic veins. Note the use of the liver (arrows) as an acoustic window. (b) Transverse view of the inferior vena cava (IVC) at the level of hepatic veins. RHV right hepatic vein, MHV middle hepatic vein, LHV left hepatic vein
Related posts:
Introduction: The Importance of Ultrasound in a Surgical Practice
Abdominal Ultrasound: Credentialing and Certification
Trauma Ultrasound
Techniques in Laparoscopic and Intraoperative Ultrasound Guidance
Abdominal Wall Anatomy, Pathology, and Intervention
Percutaneous Ultrasound Guidance Techniques and Procedures
Stay updated, free articles. Join our Telegram channel
Full access? Get Clinical Tree
