Contemporary imaging techniques for renal mass evaluation are essential to clinical management and surgical planning. Ultrasonography can be used to distinguish cystic from solid lesions but is less sensitive and accurate in renal mass characterization than computed tomography (CT) and magnetic resonance imaging (MRI). Multiphase CT imaging before and after administration of contrast is the primary imaging modality for characterization and staging of renal lesions. MRI is increasingly used as a problem solving tool. Advanced MRI techniques such as diffusion-weighted imaging and perfusion-weighted imaging are being explored in assessment of renal lesions. These techniques are discussed in this article.
Most renal masses are discovered incidentally on medical imaging. Although approximately 80% of all renal lesions are malignant, up to 38% of masses with diameters less than 1 cm are benign. Increased detection of renal masses has prompted the need for improved characterization as well as exploration of less invasive treatment strategies. Ultrasonography, computed tomography (CT), and magnetic resonance imaging (MRI) are currently available imaging modalities used to evaluate renal masses. Understanding the strengths and limitations of these modalities can enable better use of these resources and has important implications in the management of patients with renal tumors. In addition, advanced MRI techniques can potentially provide information beyond anatomic description of tumors and may assist in noninvasive assessment of renal cell cancer (RCC) aggressiveness.
Ultrasonography
Major advantages of sonographic evaluation include low cost and lack of ionizing radiation or need for intravenous contrast administration. The modality is widely accessible and is therefore commonly used for initial screening evaluation of renal disease or lesions. It is also routinely used to discriminate cystic lesions from solid lesions, monitor growth of a lesion, and evaluate hyperdense lesions found on CT that could be cysts. Cystic lesions are examined for the presence of internal septations, calcifications, vascularity, and mural nodularity. Presence of these features increases the likelihood of a lesion being malignant, thus requiring definitive characterization with a dedicated renal CT or MRI. Although recent studies suggest that use of contrast-enhanced ultrasonography has the potential to improve detection and characterization of renal lesions, these contrast agents are not approved by the Federal Drug Administration (FDA), and are not available for clinical use in the United States.
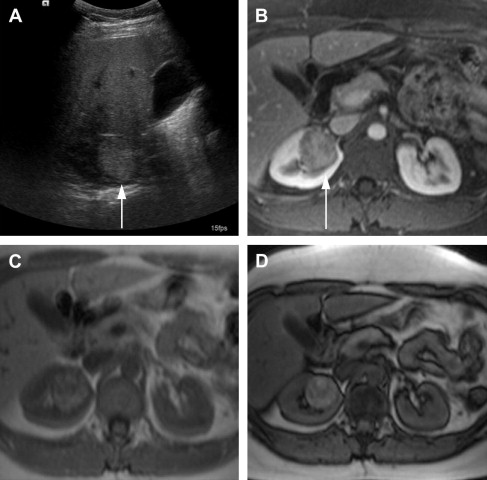
One of the limitations of the sonography is the lower accuracy for smaller lesions compared with CT. In a study by Jamis-Dow and colleagues, ultrasonography detected 58% of lesions sized 15 to 20 mm, compared with CT, which detected all the (100%) lesions. Characterization of renal masses on ultrasonography is also limited because of the variable echogenicity of RCC, which can range from hypoechoic to hyperechoic when compared with the renal parenchyma. Solid hyperechoic RCC ( Fig. 1 ) may overlap in appearance with benign angiomyolipomas. Furthermore, ultrasonography is user dependent, which can lead to interobserver variability in follow-up of lesions and in size measurements.
CT
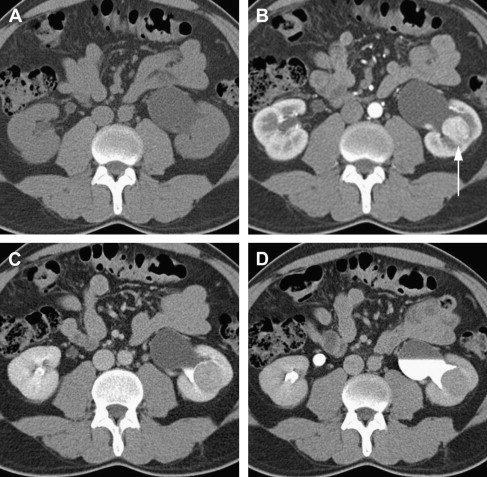
CT is currently the modality of choice for characterization and staging of renal masses. CT is more than 90% sensitive for detecting small renal masses. Multidetector CT (MDCT), the most recent generation of scanners, is now in widespread use and uses multiple rows of detectors providing nearly isotropic datasets. Images can therefore be reformatted in coronal or sagittal planes with near-equal resolution. The MDCT protocol for renal mass evaluation includes a noncontrast phase followed by postcontrast acquisitions acquired at multiple times after injection of contrast, with corticomedullary, nephrographic, and delayed phases of enhancement at approximately 40 seconds, 90 seconds, and 7 minutes after contrast injection, respectively. The nephrographic phase serves best for assessing the presence of a renal lesion and its enhancement and is thus sufficient for detection and characterization of renal lesions. Corticomedullary (arterial) and urographic phases are often acquired to provide additional valuable information for presurgical planning and assessing proximity or involvement of the collecting system ( Fig. 2 ). An important drawback to this multiphase technique is the higher ionizing radiation dose to the patient.
Assessment of Renal Lesions
The presence of enhancement is the most important factor in determining the likelihood of malignancy in a renal mass. Enhancement on CT is defined as an attenuation increase of at least 15 to 20 Hounsfield units (HU) on postcontrast image with respect to the noncontrast acquisition. Lesions demonstrating an increase of up to 10 HU are not categorized as enhancing masses because of the phenomenon of pseudoenhancement, which causes a renal cyst to appear increased in density on contrast-enhanced images. In cases in which a lesion is incompletely characterized because of increase in attenuation between 10 and 20 HU on postcontrast CT, MRI may be helpful as a problem-solving tool. MRI can also be useful in the assessment of hypovascular malignancies such as papillary RCC, which may be mistaken for renal cysts on a postcontrast CT in nephrographic phase due to low level of enhancement.
Studies have reported the possibility of differentiating papillary type RCCs from other subtypes on CT using the degree of contrast enhancement. In one study, attenuation of less than 100 HU on the corticomedullary phase of enhancement was 95.7% accurate for distinguishing papillary carcinomas from clear cell carcinomas after normalizing for the degree of aortic enhancement. A homogeneous pattern of enhancement has also been reported to be significantly associated with papillary RCC.
Cystic lesions
The Bosniak classification system is both an imaging and clinical management system for evaluation of cystic renal lesions. Although this classification scheme was initially described based on the findings at CT, it is also applicable to MRI. Category 1 lesions are simple cysts, category 2 lesions are mildly complicated benign cysts, and category 4 lesions are cystic renal neoplasms or cystic RCC. Diagnosis and management of these lesions is straight forward, such that category 1 and 2 lesions are benign and no further workup is required, whereas category 4 lesions are managed surgically. Category 2F lesions are moderately complicated cystic masses that are indeterminate and require follow-up to demonstrate stability and exclude malignancy. Category 3 lesions have some features that can be seen with cystic RCC, and, because of suspicion of malignancy, these lesions are managed surgically.
Although CT remains the modality of choice in evaluation of renal lesions, some of the disadvantages of CT include limited characterization of lesions less than 1 cm in diameter, the potential for allergic reaction or nephrotoxicity due to the iodinated contrast medium, and exposure to ionizing radiation, which is of concern in patients undergoing repeated CT examinations.
CT
CT is currently the modality of choice for characterization and staging of renal masses. CT is more than 90% sensitive for detecting small renal masses. Multidetector CT (MDCT), the most recent generation of scanners, is now in widespread use and uses multiple rows of detectors providing nearly isotropic datasets. Images can therefore be reformatted in coronal or sagittal planes with near-equal resolution. The MDCT protocol for renal mass evaluation includes a noncontrast phase followed by postcontrast acquisitions acquired at multiple times after injection of contrast, with corticomedullary, nephrographic, and delayed phases of enhancement at approximately 40 seconds, 90 seconds, and 7 minutes after contrast injection, respectively. The nephrographic phase serves best for assessing the presence of a renal lesion and its enhancement and is thus sufficient for detection and characterization of renal lesions. Corticomedullary (arterial) and urographic phases are often acquired to provide additional valuable information for presurgical planning and assessing proximity or involvement of the collecting system ( Fig. 2 ). An important drawback to this multiphase technique is the higher ionizing radiation dose to the patient.
Assessment of Renal Lesions
The presence of enhancement is the most important factor in determining the likelihood of malignancy in a renal mass. Enhancement on CT is defined as an attenuation increase of at least 15 to 20 Hounsfield units (HU) on postcontrast image with respect to the noncontrast acquisition. Lesions demonstrating an increase of up to 10 HU are not categorized as enhancing masses because of the phenomenon of pseudoenhancement, which causes a renal cyst to appear increased in density on contrast-enhanced images. In cases in which a lesion is incompletely characterized because of increase in attenuation between 10 and 20 HU on postcontrast CT, MRI may be helpful as a problem-solving tool. MRI can also be useful in the assessment of hypovascular malignancies such as papillary RCC, which may be mistaken for renal cysts on a postcontrast CT in nephrographic phase due to low level of enhancement.
Studies have reported the possibility of differentiating papillary type RCCs from other subtypes on CT using the degree of contrast enhancement. In one study, attenuation of less than 100 HU on the corticomedullary phase of enhancement was 95.7% accurate for distinguishing papillary carcinomas from clear cell carcinomas after normalizing for the degree of aortic enhancement. A homogeneous pattern of enhancement has also been reported to be significantly associated with papillary RCC.
Cystic lesions
The Bosniak classification system is both an imaging and clinical management system for evaluation of cystic renal lesions. Although this classification scheme was initially described based on the findings at CT, it is also applicable to MRI. Category 1 lesions are simple cysts, category 2 lesions are mildly complicated benign cysts, and category 4 lesions are cystic renal neoplasms or cystic RCC. Diagnosis and management of these lesions is straight forward, such that category 1 and 2 lesions are benign and no further workup is required, whereas category 4 lesions are managed surgically. Category 2F lesions are moderately complicated cystic masses that are indeterminate and require follow-up to demonstrate stability and exclude malignancy. Category 3 lesions have some features that can be seen with cystic RCC, and, because of suspicion of malignancy, these lesions are managed surgically.
Although CT remains the modality of choice in evaluation of renal lesions, some of the disadvantages of CT include limited characterization of lesions less than 1 cm in diameter, the potential for allergic reaction or nephrotoxicity due to the iodinated contrast medium, and exposure to ionizing radiation, which is of concern in patients undergoing repeated CT examinations.
Dual-energy CT
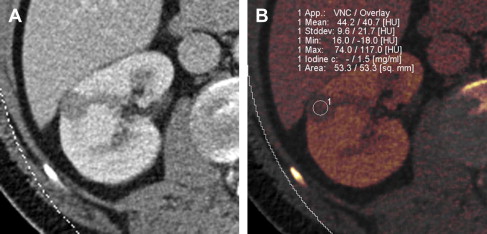
The recent development of dual-energy CT (DECT) technology has the potential to lower radiation dose to the patient. DECT involves simultaneous acquisition of CT data at 2 different energies or peak tube voltages. Different materials (such as iodine and soft tissue) demonstrate unique attenuation differences at the varying tube voltages, allowing for material decomposition. When the technology is applied to remove iodine contribution from a postcontrast image, the generated set of images is termed virtual noncontrast dataset. Use of the virtual noncontrast dataset has been studied as a replacement for a true noncontrast acquisition in the evaluation of renal lesions. The single-phase DECT examination resulted in a 47% reduction in radiation dose compared with a dual-phase CT examination in a study by Graser and colleagues, while preserving accurate lesion characterization. Review of a single-phase postcontrast DECT examination in conjunction with virtual noncontrast data set produced an accuracy of 94.6% in diagnosing malignant renal lesions, when compared with 96% accuracy using a 2-phase CT examination with a true noncontrast data set. Alternatively it is possible to measure iodine concentration (instead of attenuation values) within the lesion. Enhancing renal mass demonstrates presence of iodine, whereas benign nonenhancing lesion has absence of intralesional iodine ( Fig. 3 ). Although preliminary results of renal mass evaluation with DECT are encouraging, the technology is not yet widely available and clinical use is in early stages.
MRI
MRI can be a potent problem-solving tool in clinical practice for characterization of renal masses. Like CT, MRI offers accurate anatomic information in evaluation of renal lesion. However, unlike CT, advanced MRI techniques can provide information about tissue structure and function without exposure to ionizing radiation. MRI also serves as an alternative to CT in patients with allergies to iodinated contrast.
MRI of the kidneys is usually performed on 1.5- or 3-T magnets, which are widely available. Recent advances in MRI hardware and software enable faster imaging so that sequences through the kidneys can be acquired in a breath-hold (suspended respiratory motion) with an examination time of approximately 30 minutes. Free-breathing techniques are also in development and may be useful in subjects who are unable to suspend respiration. The standard MRI protocol for renal mass evaluation includes multiple sequences ( Table 1 ): T2-weighted imaging, T1-weighted opposed-phase imaging (with in-phase and out-of-phase sequences) for detection of microscopic fat, and fat-suppressed T1-weighted gradient-echo acquisition before and after administration of intravenous gadolinium contrast in corticomedullary, nephrographic, and urographic phases of renal enhancement.
| Sequence | Clinical Use |
|---|---|
| T1 in and out of phase | Detection of macroscopic and microscopic fat |
| T2 HASTE | Lesion detection, high water content is bright |
| Diffusion-weighted sequence, including multi–b value DWI | Lesion cellularity and vascularity (investigational) |
| Dynamic T1 gradient-echo 3D fat saturation (before and after contrast administration) at following time points: | — |
| Arterial phase/corticomedullary (no delay) | Vascular anatomy, lesion detection and characterization |
| Nephrographic (70–90 s) | Best phase for lesion detection and characterization |
| Urographic/excretory phase (7 minutes) | Relationship of mass to collecting system |
| Coronal T1 gradient-echo 3D with fat saturation: urogram | Evaluation of collecting system in the coronal plane |
Related posts:
 The Surgical Approach to Multifocal Renal Cancers: Hereditary Syndromes, Ipsilateral Multifocality, and Bilateral Tumors
 Histologic Variants of Renal Cell Carcinoma: Does Tumor Type Influence Outcome?
Current Practice Patterns in the Surgical Management of Renal Cancer in the United States
Does Renal Mass Ablation Provide Adequate Long-term Oncologic Control?
Histologic Variants of Renal Cell Carcinoma: Does Tumor Type Influence Outcome?
Current Practice Patterns in the Surgical Management of Renal Cancer in the United States
Does Renal Mass Ablation Provide Adequate Long-term Oncologic Control?
 Partial Nephrectomy: Contemporary Outcomes, Candidate Selection, and Surgical Approach
 Defining an Individualized Treatment Strategy for Metastatic Renal Cancer
Stay updated, free articles. Join our Telegram channel

Full access? Get Clinical Tree


