Computer-Aided Detection
Judy Yee
Computer-aided detection (CAD) has been predominantly applied to mammography for the detection of breast cancer. The first CAD products approved by the U.S. Food and Drug Administration (FDA) in the United States were for mammography.1 Since then CAD has been applied to chest radiographs and computed tomography (CT) images for lung nodule detection. CAD of polyps and cancer on computed tomographic colonography (CTC) has also been demonstrated to be feasible and useful.
CAD for CTC has the potential to decrease interpretation time, which is important as this test is increasingly disseminated as a clinical tool and the volume of CTC studies increases. CAD also has the potential to improve both the sensitivity and specificity of CTC. Missed lesions due to human perceptual error may be detected using CAD. False positives may be excluded based on lack of detection by CAD. The variable performance of CTC in clinical trials is in part due to differences in reader experience and CAD can help to reduce inter-reader variability. The actual improvement in performance with the use of CAD likely will depend upon individual reader experience, the CT scan parameters used and the adequacy of colonic cleansing and distention.
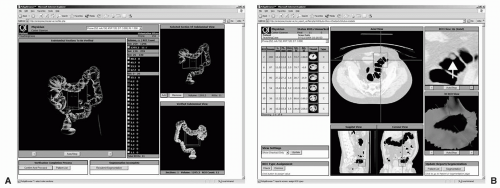
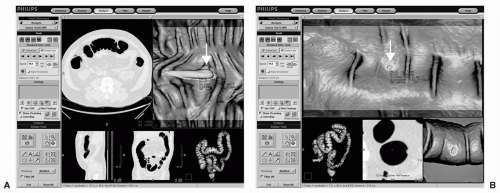
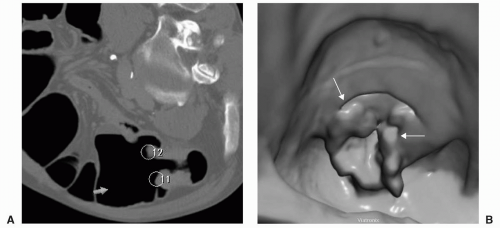
CAD for CTC relies on three general steps: (a) segmentation of the colon from the three-dimensional (3D) data set; (b) detection of the polyp candidates; and (c) reducing false positives. CAD software typically generates a list of potential lesions with their locations that is displayed to the reader for review in order of likelihood of being a true lesion based on preset parameters. Various image displays are available that include different 2D (two dimensional) and 3D views with polyp candidates marked on them (see Figures 11.1, 11.2, 11.3 and 11.4). CAD interpretation schemes include its use as a primary reader and as a secondary reader. Many reviewers will interpret the entire CTC data set and then use CAD as a secondary reader to determine if there were additional lesions not detected initially. Some CAD software allow displays for concurrent interpretation of the CTC data set, which is placed adjacent to the same data set with marked potential lesions.
CAD algorithms are being evaluated using combined supine and prone image data sets to help find true polyps and to decrease the number of false positives.2,3 Integration of CAD with tagged data sets combined with electronic cleansing is being explored as perhaps the most time-efficient and accurate method for interpretation.4, 5, 6 and 7
COMPUTER-AIDED DETECTION TECHNIQUES AND FEASIBILITY STUDIES
Various prototypes of CAD schemes have been developed for the detection of polyps and masses on CTC. Some algorithms extract the colonic wall surface and determine local variations in the curvature of the surface to identify polyps.8, 9, 10, 11, 12, 13, 14, 15 and 16 Other algorithms are based on a contour normal technique that is based on the directions of normal vectors from air to soft tissue.17, 18, 19 and 20 These two techniques have shown high sensitivity for polyp detection but with a high false-positive rate. Still other algorithms extract a much thicker region of the colonic wall, which includes the entire polyp to decrease the number of false positives.21, 22 and 23 3D geometric features such as volumetric shape index and curvedness may then be used to help distinguish between polyps and folds or colon wall to further improve sensitivity. Internal features of polyps may be used to help decrease the number of false positives and improve specificity.
Blake et al. evaluated the performance of a CAD algorithm for measurement of the largest linear dimension and the volume of simulated polyps in a phantom.24 Twenty spherical and hemispherical simulated polyps within a Plexiglas phantom ranging in size between 6 mm and 25 mm were scanned using four-channel MDCT at 1.3-mm slice thickness, 0.6-mm reconstruction interval, 100 mAs (high dose), and 30 mAs (low dose). The inner surface of the phantom was derived from the CT data to calculate the maximum length and volume of each polyp. Seed filling of the lumen allowed identification of the tessellated surface between the air in the lumen and the simulated polyps. Results showed that the CAD software provided accurate measurements. Mean error for length
measurements for both spheres and hemispheres was 2%. Mean error for volume measurements was 3% for spheres and 5% for hemispheres.
measurements for both spheres and hemispheres was 2%. Mean error for volume measurements was 3% for spheres and 5% for hemispheres.
 FIGURE 11.1 CAD for CTC first segments the colon from the 3D data set (A). The CAD system then automatically identifies, measures, and characterizes polyp candidates and they are organized into a list of decreasing order of likelihood (B). The display also includes axial, magnified axial, sagittal and coronal multiplanar images, and 3D view of the polyp candidate. (Views A and B: See also color plate.) |
Nappi et al. evaluated region-based supine-prone correspondence of CTC data sets to help reduce false positives.2 The colon was extracted from the original CT data set by using an automated centerline-based colon segmentation method. Up to six landmarks were established for each data set and a region-growing scheme was used to divide the colon lumen into overlapping segments that matched in the supine and prone data sets. Polyp candidates detected by CAD were eliminated if contained in only one of the data sets of a patient. This method was evaluated in 121 CTC studies and results showed that there was partial or complete correspondence in 71% of cases. The sensitivity for polyp detection was 91% and there was a 19% reduction in false positives. It was concluded that supine and prone correlation of data sets can improve the specificity of CAD in CTC. Other methods for establishing supine and prone correspondence have been based on colon centerlines.13
 FIGURE 11.2 CAD algorithm integrated into CTC software with various image display options. A large polyp is identified in the descending colon of the first patient using a display that includes the axial image, dissection view, sagittal and coronal multiplanar reformats, and colon overview. A: A small polyp is detected in the sigmoid colon of the second patient using a display that includes dissection views, magnified axial view and the colon overview. B: Note that the CAD system provides measurements of polyp candidates automatically. (Views A and B: See also color plate.) |
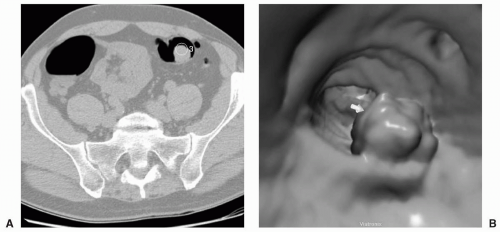
 FIGURE 11.3 Large Polyp. CAD identification of a large polyp on axial (A) and 3D endoluminal view (B). |
Surface Curvature
CAD algorithms have been developed for CTC that delineate the surface of the colon wall and then polyp candidates are detected using shape criteria to determine variations in the surface curvature. The colon wall is characterized by computing its minimum, maximum, mean, and Gaussian curvatures. Additional restrictive criteria such as sphericity are then applied to exclude nonspherical shapes. The surface curvature method typically generates a small number of false positives but may have a lower sensitivity for polyp detection relative to other methods.
Summers et al. initially evaluated the surface curvature method for CTC using ten simulated colon polyps inserted into an abdominal CT scan.8 Polyp detection was performed using a prototype detector that identified areas of the colon wall with abnormal shape. The shape-based polyp detector using a primary shape criterion of elliptic curvature of the peak subtype was able to locate six of the ten polyps. With edge profile enhancement eight of ten polyps were detected and there were no false positives. This study showed that shape analysis of colon polyps is technically feasible on CTC. A follow-up study by Summers et al. used the same shape-based algorithm measuring local variations in surface curvature but with additional filters to study 20 patients with 50 known polyps.9 The algorithm detected lesions that protruded into the colonic lumen. The filters were additional shape criteria that included mean curvature, dimensionless ratio sphericity, and minimum polyp size. The sensitivity for detecting polyps 10 mm or larger was 64% (18/28 polyps) which increased to 71% (10/14 polyps) when considering only well-distended segments. There was a mean of six false positives per colon, which was decreased to 3.5 per
colon after sampling CT scan attenuation at lesion sites and discarding those lesions having an attenuation less than the threshold.
colon after sampling CT scan attenuation at lesion sites and discarding those lesions having an attenuation less than the threshold.
Various classifiers such as support vector machines (SVM) that use sphericity individually or with other features have been evaluated to improve sensitivity and decrease false positives generated by CAD systems.10 Polyp segmentation based on fuzzy clustering and deformable models have also been applied to CAD to reduce false positives and to provide volumetric features for polyp classification.11 Polyp surface shape has been evaluated by using lines of curvature to detect polyps rather than using scalar curvature of the colon wall which may cause more false positives.12


Stay updated, free articles. Join our Telegram channel

Full access? Get Clinical Tree


