Fig. 3.1
Comparing the urinary proteins after removing cells in urine by centrifugation or filtration, respectively [1]
Testing the loading capacity of the PVDF membrane
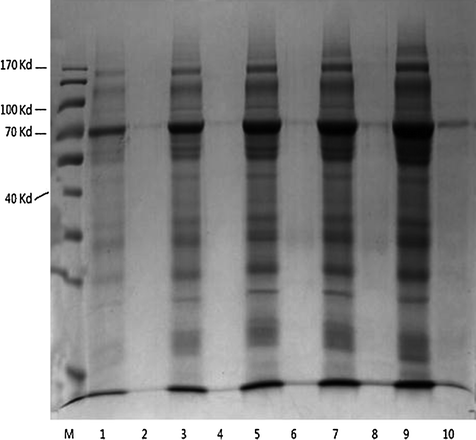
As shown in Fig. 3.2, after protein elution from the PVDF membrane with 1 ml elution buffer, 30 μl elution buffer was used for SDS-PAGE. Lanes 1, 3, 5, 7, and 9 represent the eluted proteins from 10, 20, 30, 40, and 50 ml of urine, respectively, in 5 sheets of 10 cm2 PVDF membrane. Lanes 2, 4, 6, 8, and 10 represent the eluted proteins in the flow-through from the PVDF membrane onto which 10, 20, 30, 40, or 50 ml of urine proteins was absorbed from another 5 sheets of 10 cm2 PVDF membrane. For urine volumes greater than 30 ml, the protein was not absorbed entirely into the membrane. Thus, the largest urine volume was 20 ml/10 cm2, and the urine protein concentration was 33 μg/ml. The concentration of the urine protein that passed through the PVDF membrane was less than 66 μg/cm2.
The urinary proteins recovered from the membrane preserved for 18 days at −80 °C and at room temperature exhibit the same SDS – PAGE pattern
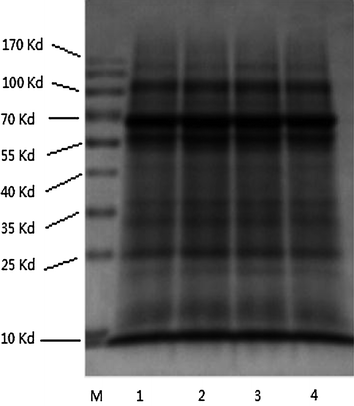
Four aliquots of 20 ml of urine proteins were retained on 4 sheets of 10 cm2 PVDF membranes and stored at four temperature conditions: room temperature, 4, −20, and −80 °C for 18 days. After protein elution from the PVDF membrane with 1 ml elution buffer, 30 μl elution buffer was used for SDS-PAGE. Shown in lanes 1, 2, 3, and 4 of Fig. 3.3 are the proteins that were stored at −80, −20, 4 °C, and room temperature, respectively.


Fig. 3.3


Comparing the urinary proteins recovered from the membranes after preservation for 18 days with different temperature [1]
Stay updated, free articles. Join our Telegram channel

Full access? Get Clinical Tree


