Fig. 1
Longitudinal waves. The expansion and contraction of piezoelectric crystals caused by the application of alternating current to the crystals causes compression and rarefaction of molecules in the body
The compression and rarefaction of molecules is represented graphically as a sine wave alternating between a positive and negative deflection from the baseline. A wavelength is described as the distance between one peak of the wave and the next peak. One complete path traveled by the wave is called a cycle. One cycle per second is known as 1 Hz (Hertz). The amplitude of a wave is the maximal excursion in the positive or negative direction from the baseline. The period is the time it takes for one complete cycle of the wave (Fig. 2).
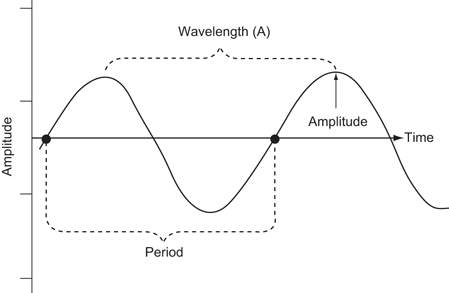
Fig. 2
Characteristics of a sound wave: The amplitude of the wave is a function of the acoustical power used to generate the mechanical compression wave and the medium through which it is transmitted
The velocity with which a sound wave travels through tissue is a product of its frequency and its wavelength. The velocity of sound in tissues is relatively constant. Therefore, as the frequency of the sound wave changes the wavelength must also change. The average velocity of sound in human tissues is 1540 m/s. Wavelength and frequency vary in an inverse relationship. Velocity equals frequency times wavelength (Fig. 3). As the frequency diminishes from 10 to 1 MHz the wavelength increases from 0.15 to 1.5 mm. This has important consequences for the choice of transducer depending on the indication for imaging, since ultrasound can effectively penetrate to approximately 200 times its wavelength.

Fig. 3
Since the average velocity of sound in tissue is considered to be constant, the frequency and wavelength of sound must vary inversely
Ultrasound Image Generation
The image produced by an ultrasound machine begins with the transducer. The term Transducer, from the Latin transducere, means “to convert.” In this case, electrical impulses are converted to mechanical sound waves via the piezoelectric effect.
In ultrasound imaging the transducer has a dual function as a sender and a receiver. Sound waves are transmitted into the body where they are at least partially reflected. The piezoelectric effect occurs when alternating current is applied to a crystal containing dipoles [1]. Areas of charge within a piezoelectric element are distributed in patterns which yield a “net” positive and negative orientation. When alternating charge is applied to the two-element faces, a relative contraction or elongation of the charge areas occurs resulting in a mechanical expansion and then a contraction of the element. This results in a mechanical wave which is transmitted into the patient (Fig. 4).
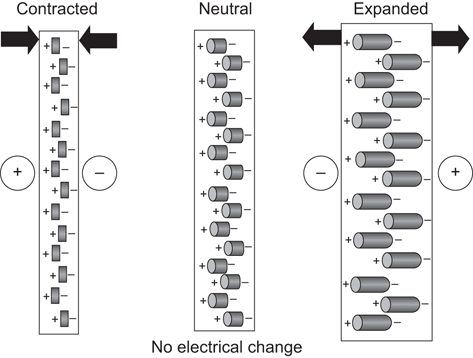
Fig. 4
Piezoelectric effect. Areas of “net” charge within a crystal expand or contract when current is applied to the surface, creating a mechanical wave. When the returning wave strikes the crystal an electrical current is generated
Reflected mechanical sound waves are received by the transducer and converted back into electrical energy via the piezoelectric effect. The electrical energy is interpreted within the ultrasound instrument to generate an image which is displayed upon the screen.
For most modes of ultrasound, the transducer emits a limited number of wave cycles (usually 2–4) called a pulse. The frequency of the 2–4 wave cycles is usually in the 2.5–14 MHz range. The transducer is then “silent” as it awaits the return of the reflected waves from within the body (Fig. 5). The transducer serves as a receiver more than 99 % of the time.
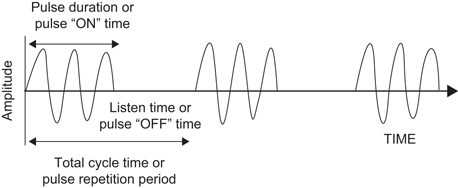
Fig. 5
The pulsed wave ultrasound mode depends on an emitted pulse of 2–4 wave cycles followed by a period of “silence” as the transducer awaits the return of the emitted pulse
Pulses are sent out at regular intervals which are known as the pulse repetition frequency (PRF). By timing the pulse from transmission to reception it is possible to calculate the distance from the transducer to the object reflecting the wave. This is known as ultrasound ranging (Fig. 6). This sequence is known as pulsed-wave ultrasound.
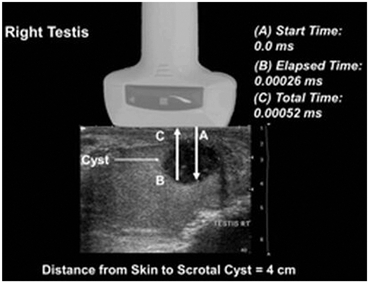
Fig. 6
Ultrasound ranging depends on assumptions about the average velocity of ultrasound in human tissue to locate reflectors in the ultrasound field. The elapsed time from pulse transmission to reception of the same pulse by the transducer allows for determining the location of a reflector in the ultrasound field. In this example of a testis, the elapsed time from transmission of a pulse (A) until it reaches the back wall of the cyst (B) is 0.00026 ms (based on the average velocity of sound in human tissue 1540 m/s) resulting in a total transit time of 0.00052 ms (C).The calculated distance to the back wall of the cyst is approximately 4 cm
The amplitude of the returning waves determines the brightness of the pixel assigned to the reflector in an ultrasound image. The greater the amplitude of the returning wave, the brighter the pixel assigned. Thus, an ultrasound unit produces an “image” by first causing a transducer to emit a series of ultrasound waves at specific frequencies and intervals and then interpreting the returning echoes for duration of transit and amplitude. This “image” is rapidly refreshed on a monitor to give the impression of continuous motion. Frame refresh rates are typically 12–30/s. The sequence of events depicted in Fig. 7 is the basis for all “scanned” modes of ultrasound including the familiar gray-scale ultrasound.
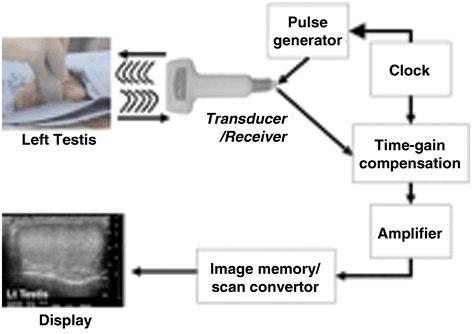
Fig. 7
Schematic depiction of the production of an ultrasound image. In this example of an ultrasound of the testis, the transducer transmits an ultrasound wave into the testis. The wave is generated at regular intervals based on the clock and the pulse generator. The transducer receives the returning wave and alters it according to the machine settings (i.e., time-gain compensation). The machine amplifies the image according to the settings and the signal is converted into a gray-scale image on the display screen.
Interaction of Ultrasound with Biological Tissue
As ultrasound waves are transmitted through human tissue they may be altered in a variety of ways by loss of energy, change of direction, and change of frequency. An understanding of these interactions is necessary to maximize image quality and correctly interpret the resultant images.
Attenuation refers to a loss of kinetic energy as a sound wave interacts with tissues and fluids within the body [2]. Specific tissues have different potentials for attenuation. For example, water has an attenuation of 0.0 whereas kidney has an attenuation of 1.0 and muscle an attenuation of 3.3. Therefore, sound waves are much more rapidly attenuated as they pass through muscle than as they pass through water (Fig. 8; Attenuation is measured in dB/cm/MHz).
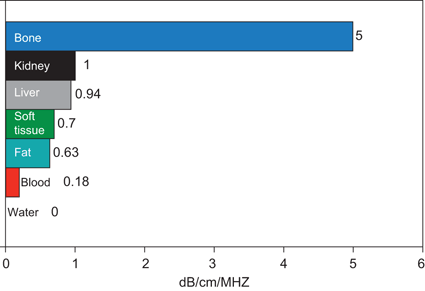
Fig. 8
Attenuation of tissue. The attenuation of a tissue is a measure of how the energy of an ultrasound wave is dissipated by that tissue. The higher the attenuation value of a tissue, the more the sound wave is attenuated by passing through that tissue (Adapted from Diagnostic Ultrasound, 3rd Ed., Vol. 1)
The three most important mechanisms of attenuation are absorption, reflection, and scattering. Absorption occurs when the mechanical kinetic energy of a sound wave is converted to heat within the tissue. Absorption is dependent of the frequency of the sound wave and the characteristics of the attenuating tissue. Higher frequency waves are more rapidly attenuated by absorption than lower frequency waves.
Since sound waves are progressively attenuated with distance traveled, deep structures in the body (e.g., kidney) may require adjustments in acoustic output or in the gain settings. Compensation for loss of acoustic energy by attenuation can be accomplished by increasing the sensitivity of the transducer to returning sound waves and selection of a lower frequency.
Refraction occurs when a sound wave encounters an interface between two tissues at any angle other than 90°. When the wave strikes the interface at an angle a portion of the wave is reflected and a portion transmitted into the adjacent media. The direction of the transmitted wave is altered (refracted). Refraction not only results in a loss of some information because the wave is not completely reflected back to the transducer, but also potential errors in registration of object location because of the refraction (change in direction) of the wave. The optimum angle to minimize distortion from refraction is 90° (Fig. 9).
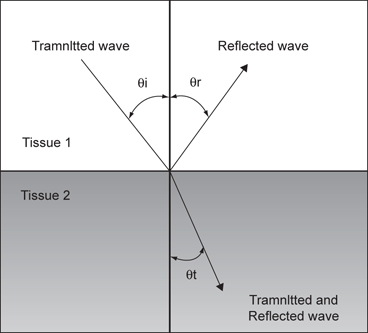
Fig. 9
A wave which strikes the interface between two tissues of differing impedance is usually partially reflected and partially transmitted with refraction. A portion of the wave is reflected (θR) at an angle equal to the angle of insonation (θi), a portion of the wave is transmitted at a refracted (θt) angle into the second tissue
Reflection occurs when sound waves strike an object or an interface between unlike tissues or structures. If the object has a relatively large flat surface it is called a specular reflector and sound waves are reflected in a predictable way based on the angle of insonation. If a reflector is small or irregular it is called a diffuse reflector. Diffuse reflectors produce scattering in a pattern which produces interference with waves from adjacent diffuse reflectors. The resulting pattern is called “speckle” and is characteristic of solid organs which have repetitive internal glandular or tubular structures such as the testes, kidneys, and liver (Fig. 10).
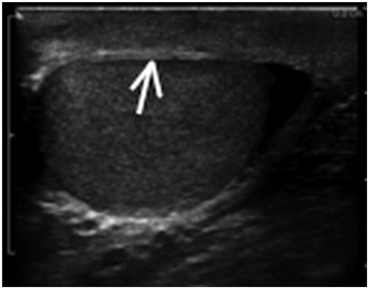
Fig. 10
Demonstrates a diffuse reflector. In this image of the testis, small parenchymal structures scatter sound waves. The pattern of interference resulting from this scattering provides the familiar “speckled” pattern of testicular echo architecture. A specular reflector reflects sound waves at an angle equal to the incident angle without producing a pattern of interference caused by scattering. In this image of the testis the tunica albuginea (arrow) covering the testis serves as a specular reflector
When a sound wave travels from one tissue to another a certain amount of energy is reflected at the interface between the tissues. The percentage of energy reflected is a function of the difference in the impedance of the tissues. Impedance is a property of tissue related to its “stiffness” and the speed at which sound travels through the tissue [3]. If two adjacent tissues have a small difference in tissue impedance very little energy will be reflected. The impedance difference between kidney (1.63) and liver (1.64) is very small so that if these tissues are immediately adjacent it may be difficult to distinguish the interface between the two by ultrasound (Table 1).
Table 1
Impedance of tissue. Impedance (Z) is a product of tissue density (p) and the velocity of that tissue (c). Impedance is defined by the formula: Z (Rayles) = p (kg/m3) × c (m/s). (Adapted from Diagnostic Ultrasound, 3rd Ed., Vol. 1)
Tissue | Density (kg/m3) | Impedance (Rayles) |
|---|---|---|
Air and other gases | 1.2 | 0.0004 |
Fat tissue | 952 | 1.38 |
Water and other clear liquids | 1000 | 1.48 |
Kidney (average of soft tissue) | 1060 | 1.63 |
Liver | 1060 | 1.64 |
Muscle | 1080 | 1.70 |
Bone and other calcified objects | 1912 | 7.8 |
Hydrocele fluid has a sufficient impedance difference from the testis and testicular appendages that the appendix testis and epididymis can be distinguished from the testis when a sufficient amount of hydrocele fluid is present (Fig. 11).
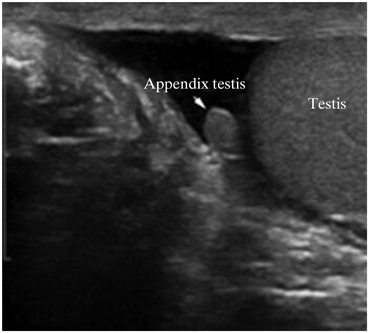
Fig. 11
This image demonstrates that when hydrocele fluid (which has a significantly lower impedance) is interposed it is far easier to appreciate the appendix testis
If the impedance differences between tissues are very high, complete reflection of sound waves may occur, resulting in acoustic shadowing. In ultrasound of the male genitalia this may occur with ejaculatory duct stones or with penile plaques (Fig. 12).
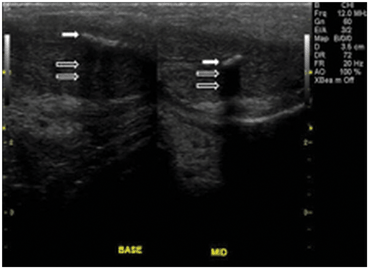
Fig. 12
In the phallus, reflection of sound waves as the result of large impedance differences between corpora cavernosa and the plaque (solid arrow). Acoustic shadowing results from nearly complete reflection of sound waves (open arrows)
Artifacts
Sound waves are emitted from the transducer with a known amplitude, direction, and frequency. Interactions with tissues in the body result in alterations of these parameters. Returning sound waves are presumed to have undergone alterations according to the expected physical principles, such as attenuation with distance and frequency shift based on the velocity, and direction of objects they encountered. The timing of the returning echoes is based on the expected velocity of sound in human tissue. When these expectations are not met, it may lead to image representations and measurements which do not reflect actual physical conditions. These misrepresentations are known as “artifacts.” Artifacts, if correctly identified, can be used to aid in diagnosis.
Increased through-transmission occurs when sound waves pass through tissue with less attenuation than occurs in the surrounding tissues. For example, when sound waves pass through a fluid filled structure such as an epididymal cyst, the waves experience relatively little attenuation compared to that experienced in the surrounding scrotal tissue. Thus, when the waves reach the posterior wall of the cyst and the renal tissue beyond it they are more energetic (have greater amplitude) than the adjacent waves. The returning echoes have significantly greater amplitude than waves returning through the scrotal tissue from the same region of the scrotum. Therefore, the pixels associated with the region distal to the cyst are assigned a greater “brightness.” The tissue appears hyperechoic compared to the adjacent renal tissue even though it is histologically identical (Fig. 13). This artifact can be overcome by changing the angle of insonation or adjusting the time-gain compensation settings .
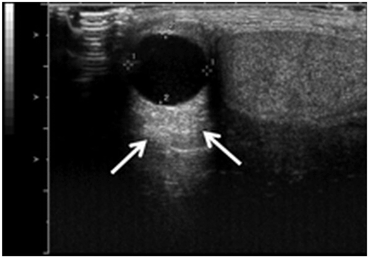
Fig. 13
Increased through transmission with hyperechogenicity (arrows) as the result of decreased attenuation by the fluid filled cyst. This is an example of artifactual misrepresentation of tissue characteristics and must be recognized and corrected in order to avoid incorrect clinical conclusions or to avoid missing objects distal to the cyst
Acoustic shadowing occurs when there is significant attenuation of sound waves at a tissue interface causing loss of information about other structures distal to that interface. This attenuation may occur on the basis of reflection or absorption, resulting in an “anechoic” or “hypoechoic” shadow. The significant attenuation or loss of the returning echoes from tissues distal to the interface may lead to incorrect conclusions about tissue in that region. For instance, when sound waves strike the interface between testicular tissue and a testicular calcification there is a large impedance difference and significant attenuation and reflection occur. Information about the region distal to the interface is therefore lost or severely diminished (Fig. 14). Thus, in some cases spherical objects may appear as crescenteric objects and it may be difficult to obtain accurate measurements of such three-dimensional (3D) objects. Furthermore, fine detail in the region of the acoustic shadow may be obscured. The problems with acoustic shadowing are most appropriately overcome by changing the angle of insonation.
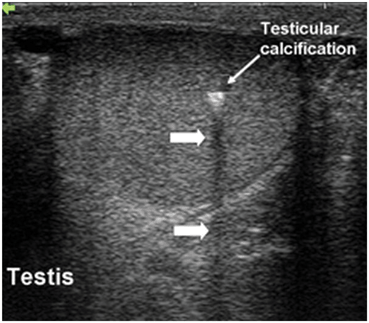
Fig. 14
Acoustic shadowing occurs distal to a calcification in the testis (large arrows). Information about testicular parenchymal architecture distal to the area of calcification is lost
Edging artifact occurs when sound waves strike a curved surface or an interface at a critical angle. A critical angle of insonation is one which results in propagation of the sound wave along the interface without significant reflection of the wave to the transducer. Thus, information distal to the interface is lost or severely diminished. This very common artifact in urology must be recognized and can, at times, be helpful. It is seen in many clinical situations but very commonly seen when imaging the testis. Edging artifacts often occur at the upper and lower pole of the testis as the sound waves strike the rounded testicular poles at the critical angle. This artifact may help differentiate between the head of the epididymis and the upper pole of the testis. The edging artifact is also prominently seen on transrectal ultrasound where the two rounded lateral lobes come together in the midline. This produces an artifact that appears to arise in the vicinity of the urethra and extend distally. Edging artifact may be seen in any situation where the incident wave strikes an interface at the critical angle (Fig. 15). Edging artifact may be overcome by changing the angle of insonation .
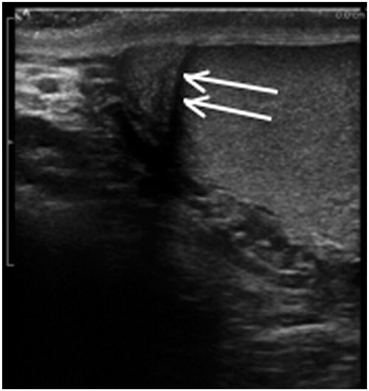
Fig. 15
Edging artifact seen between the epididymis and testis in this longitudinal view is the result of reflection of the sound wave along the curved lateral surface of the testis
A reverberation artifact results when an ultrasound wave bounces back and forth (reverberates) between two or more reflective interfaces. When the sound wave strikes a reflector and returns to the transducer an object is registered at that location. With the second transit of the sound wave the ultrasound equipment interprets a second object that is twice as far away as the first. There is ongoing attenuation of the sound wave with each successive reverberation resulting in a slightly less echogenic image displayed on the screen. Therefore, echoes are produced which are spaced at equal intervals from the transducer but are progressively less energetic (Fig. 16) .
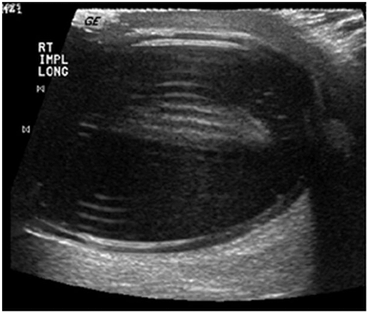
Fig. 16
A reverberation artifact occurs when a sound wave is repeatedly reflected between reflective surfaces as demonstrated in this ultrasound image of a left testicular prosthesis. The resultant echo pattern is a collection of hyperechoicartifactual reflections distal to the structure with progressive attenuation of the sound wave
The reverberation artifact can also be seen in cases where the incident sound wave strikes a series of smaller reflective objects (such as the gas-fluid mixture in the small bowel) which results in multiple reflected sound waves of various angles and intensity (Fig. 17).
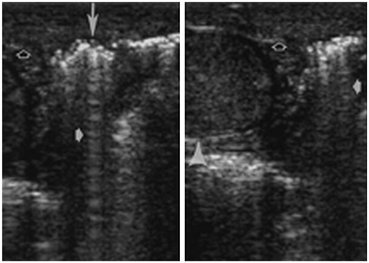
Fig. 17
Surgically proved Fournier gangrene in a 38-year-old man. Longitudinal US scan of the testis (arrowhead) shows sparing of the testis in Fournier gangrene. Both sonograms show scrotal wall thickening (open arrows) and air (long arrow) parallel to the transducer face, with reverberation artifacts (short solid arrows). (Dogra VS et al. Radiology. 2003;227:18–36)
This familiar artifact may obscure important anatomic information and is frequently encountered during renal ultrasound. It may be overcome by changing the transducer location and the angle of insonation .
Modes of Ultrasound
Gray-Scale, B-Mode Ultrasound
Gray-scale, B-mode ultrasound (brightness mode) produces images via a transducer which sends out ultrasound waves in a carefully timed, sequential way (pulsed wave). The reflected waves are received by the transducer and interpreted for distance and amplitude. Time of travel is reflected by position on the image monitor and intensity by “brightness” of the corresponding pixel. Each sequential line-of-sight echo is displayed side-by-side and the entire image refreshed at 15–40 frames/s. This results in the illusion of continuous motion or “real-time” scanning. The intensity of the reflected sound waves may vary by a factor of 1012 or 120 dB. Although the transducer can respond to such extreme variations in intensity most monitors or displays have an effective range of only 106 or 60 dB. Each of 512 × 512 or 512 × 640 pixels may display 28 or 256 shades of gray [3]. Most ultrasound units internally process and compress ultrasound data to allow it to be displayed on a standard monitor. Evaluation of gray-scale imaging requires the ability to recognize the normal patterns of echogenicity from anatomic structures. Variations from these expected patterns of echogenicity indicate disorders of anatomy or physiology or may represent artifacts.
Doppler Ultrasound
The Doppler ultrasound mode depends on the physical principle of frequency shift when sound waves strike a moving object. The basic principle of Doppler ultrasound is that sound waves of a certain frequency will be shifted or changed based on the direction and velocity of the moving reflective object as well as the angle of insonation. This phenomenon allows for the characterization of motion; most commonly the motion of blood through vessels, but may also be useful for detecting the flow of urine.
The Doppler effect is a shift in the frequency of the transmitted sound wave based on the velocity of the reflecting object that it strikes. If the reflecting object is stationary relative to the transducer then the returning frequency will be equal to the transmitted frequency. However, if the echo generating object is traveling toward the transducer the returning frequency will be higher than the transmitted frequency. If the object generating the echo is traveling away from the transducer then the reflected frequency will be lower than the transmitted frequency. This is known as the frequency shift, or Doppler shift (Fig. 18).
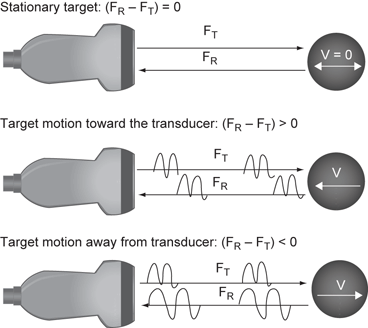
Fig. 18
Dopper effect. FT is the transmitted frequency. When the FT strikes a stationary object the returning frequency FR is equal to the FT. When the FT strikes a moving object the FR is “shifted” to a higher or lower frequency
The frequency shift of the transmitted wave is also dependent on the angle of the transducer relative to the object in motion. The maximum Doppler frequency shift occurs when the transducer is oriented directly on the axis of motion of the object being insonated. That is, when the transducer is oriented parallel (angle θ = 0°) to the direction of motion, the shift is maximal. Conversely, when the transducer face is oriented perpendicular to the direction of motion (angle θ = 90°) there will be no shift in Doppler frequency detected (Fig. 19).
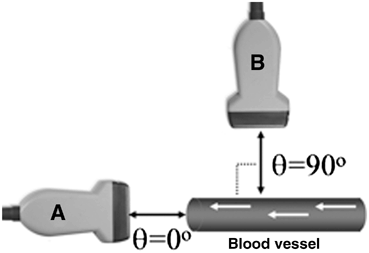
Fig. 19
(A) Maximum frequency shifts are detected when the transducer axis is parallel to the direction of motion. (B) No frequency shift is detected when the transducer axis is perpendicular to the direction of motion
An accurate calculation of velocity of flow depends on the angle (θ) between the transducer and the axis of motion of the object being insonated (Fig. 20a).
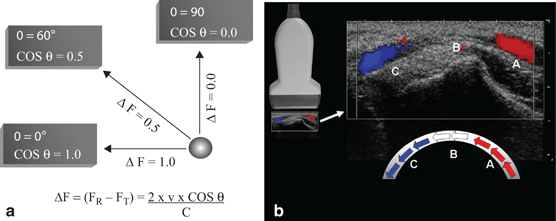
Fig. 20
a Angle of insonation. The calculated velocity of an object using Doppler shift is dependent on the transducer angle (θ). If the transducer axis is perpendicular to the direction of flow (90°) then the cosine of θ is 0. Based on this formula for Doppler shift (ΔF), the detected frequency change would be 0 (Radiographics. 1991;11:109–19). b In this image of an artery, blood is flowing through the curved vessel from A to C. Flow toward the transducer (A) is depicted in red. Flow in the middle of the vessel (B) is perpendicular to the transducer axis and produces no Doppler shift thus, no color is assigned even though the velocity and intensity of flow are uniform through the vessel. Flow away from the transducer (C) is depicted in blue
Color Doppler ultrasonography allows for an evaluation of the velocity and direction of an object in motion. A color map may be applied to the direction. The most common color map uses blue for motion away from the transducer and red for motion toward the transducer (Fig. 20b).
The velocity of motion is designated by the intensity of the color. The greater the velocity of the motion, the brighter is the color displayed. Color Doppler may be used to characterize blood flow in the kidney, testis, penis and prostate. It also may be useful in the detection of “jets” of urine emerging from the ureteral orifices. An accurate representation of flow characteristics requires attention to transducer orientation relative to the object in motion. Therefore, in most clinical circumstances the angle between the transducer and the direction of motion should be less than or equal to 60° (Fig. 21).
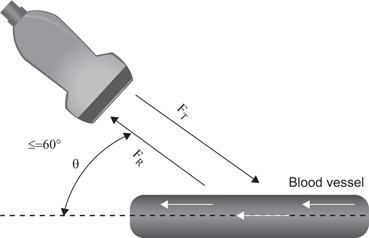
Fig. 21
The transducer angle should be ≤ 60° relative to the axis of fluid motion to allow a more accurate calculation of velocity of flow
When it is not possible to achieve an angle of 60° or less by manipulation of the transducer, the beam may be “steered” electronically to help create the desired angle θ (Fig. 22). The electronic caliper should ideally be ¾ of the vessel diameter. The electronic cursor needs to be lined up with the vessel. Therefore, when interrogating cavernosal vessels which run 90° to the direction of the ultrasound beam, electronic beam steering is often needed to make the angle θ 60° or less .
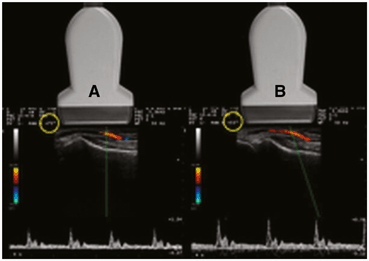
Fig. 22
Beam steering. In image (A) the angle of insonation is 75° (yellow circle) which is unfavorable for accurate velocity calculations. This is because the axis of the transducer is perpendicular to the vessel. In image (B) the beam has been “steered” to produce an angle of 55° (yellow circle) without changing the physical position of the transducer. The resultant velocity calculation is more accurate at 55°
Power Doppler ultrasonography is a mode which assigns the amplitude of frequency change to a color map. This does not permit evaluation of velocity or direction of flow but is less affected by back-scattered waves. Power Doppler is therefore less angle-dependent than color Doppler and is more sensitive for detecting flow [4].
When a sound wave strikes an object within the body, the sound wave is altered in a variety of ways including changes in frequency and changes in amplitude (Fig. 23).
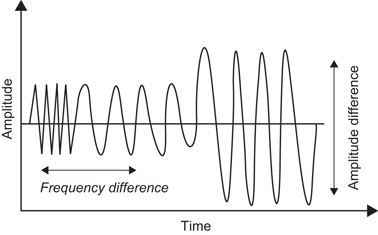
Fig. 23
Backscatter is defined as a combination of changes in frequency and amplitude which occur in the reflected sound wave of a primary frequency
While color Doppler assigns the changes in frequency to a color map, power Doppler assigns changes in integrated amplitude (or power) to a color map. It is possible to assign low level back scattered information to a color which is unobtrusive on the color map, thereby allowing increased gain without interference from this backscattered information (Fig. 24). Power Doppler may be more sensitive than color Doppler for the detection of diminished flow [4].
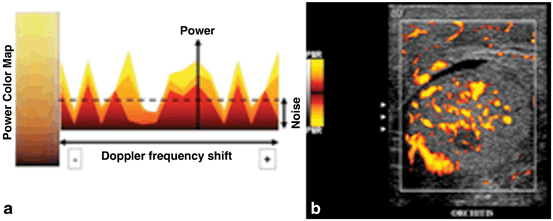
Fig. 24
a For power Doppler the intensity of color is related to changes in amplitude (power) rather than changes in frequency. b In this sagittal image of the testis, power Doppler blood flow is demonstrated. Note that the color map depicted to the left of the image does not have a scale since quantitative measurement of velocity is not display with standard power Doppler
The amplitude of the Doppler signal is signified by the brightness of the color. Because frequency shift is not displayed in standard power Doppler the direction and velocity of flow are not indicated .
Directional Color Power Doppler
There is also a recent hybrid mode called directional Color Power Doppler (DCPD) where Power Doppler information in combined such that direction information can be color coded. (DCPD) Directional color power Doppler combines power (amplitude) of the Doppler signal with directional (phase) information to encode direction and variations in blood flow. This is a very sensitive ultrasound modality and frequently requested by the end user.
Color Doppler with spectral display is a mode which allows the simultaneous display of a color Doppler image and representation of flow as a wave form within a discrete area of interrogation. This mode is commonly used to evaluate the pattern and velocity of blood flow in the kidney, testis and penis (Fig. 25).
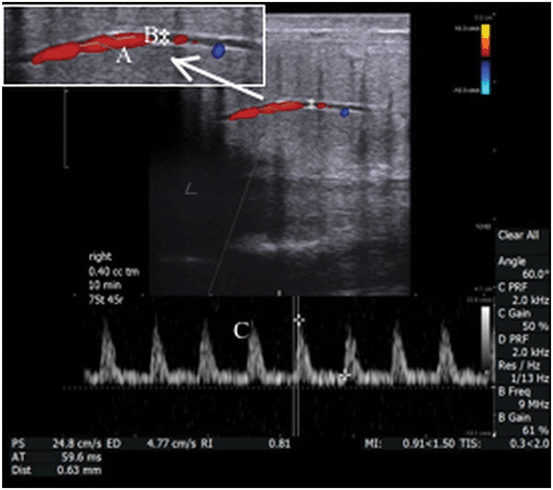
Fig. 25


In this example, the cavernosal artery is show in real-time gray scale ultrasound with color Doppler overlay. The caliper in the interrogation box (A) is positioned over the vessel of interest and the angle of insonation is indicated by marking the orientation of the vessel with a cursor (B). The velocity of the flow within the vessel is depicted quantitatively in the spectral display (C)
Related posts:


Stay updated, free articles. Join our Telegram channel
Full access? Get Clinical Tree
