(1)
Department of Endoscopy, Fukuoka University Chikushi Hospital, Fukuoka, Chikushino, Japan
Abstract
With an understanding of the theoretical background from Chap. 7, I would now like to explain the phenomena that occur when we employ magnifying endoscopy with narrow band imaging (M-NBI) in examining glandular epithelium in the stomach, and the anatomical markers we visualize. Glandular epithelium is a semitransparent mucosa with glandular crypts and other irregularities in its surface. Even more complicated phenomena occur than those seen when light is projected onto a flat semitransparent surface, such as the stratified squamous epithelium of the esophagus, and attempting to interpret the images obtained can be most confusing. In this chapter, I will explain how the findings with M-NBI are derived, using diagrams and illustrations of mucosal microanatomical structures (microvascular architecture and microsurface structure) I produced after close discussions with Olympus engineers.
Keywords
AnatomyGlandular epitheliumMagnifying endoscopyNarrow band imaging (NBI)Normal gastric mucosa8.1 Different Microanatomical Structures Visualized with Different Light Wavelengths
I would like to start by presenting color separated grayscale images of the gastric body taken with magnifying endoscopy with narrow band imaging (M-NBI), and explain the differences between images taken with the two wavelengths of light used.
8.1.1 Characteristics of Grayscale Images Taken with Narrow Band Blue Light (Central Wavelength 415 nm) (Fig. 8.1a)
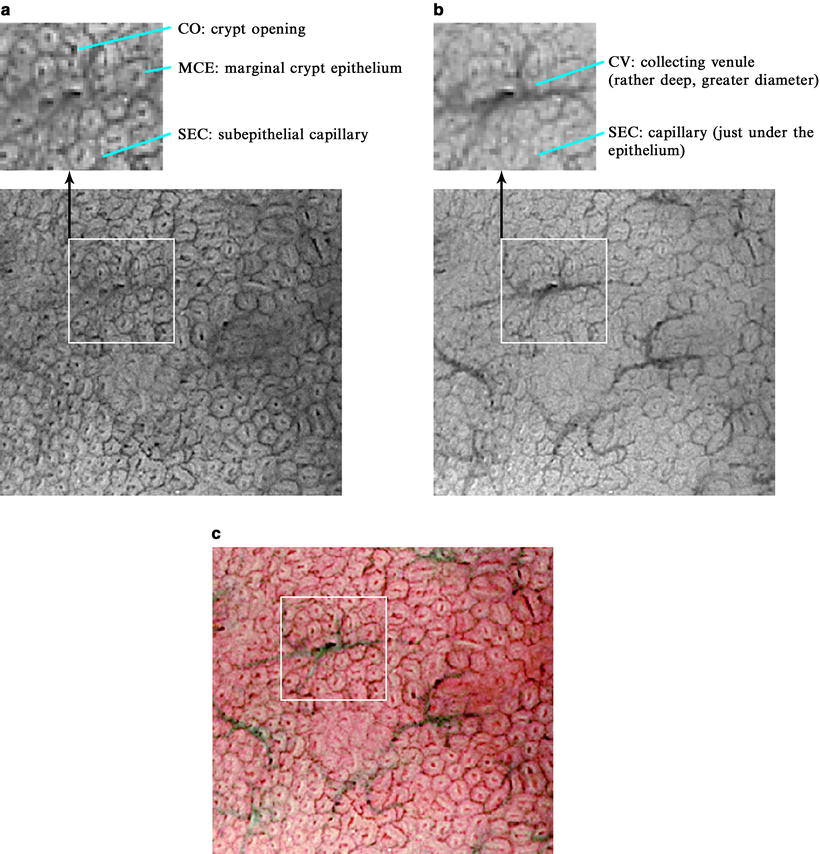
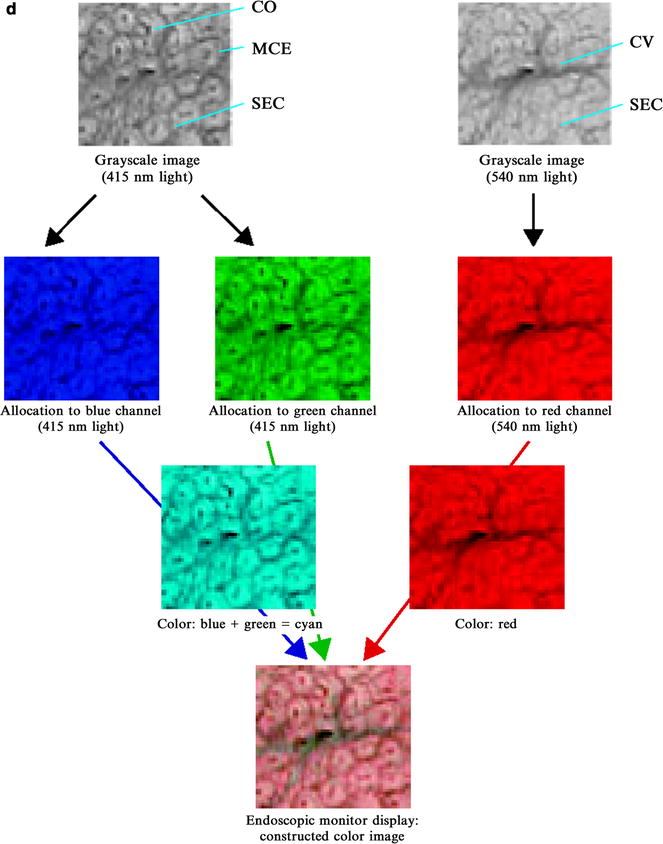
Fig. 8.1
(a) Grayscale image of gastric body mucosa taken with narrow band blue light with a central wavelength of 415 nm. (b) Grayscale image of gastric body mucosa taken with narrow band green light with a central wavelength of 540 nm. (c) Constructed color image. From Fig. 8.1a, the subepithelial capillaries (SECs) and crypt openings (COs) are colored brown, the marginal crypt epithelium (MCE) white and semitransparent, and the intervening part (IP) transparent. From Fig. 8.1b, the collecting venules (CVs) are colored cyan.
(d) Allocation to color channels and construction of a color image on the monitor. On the monitor, the images taken with 415 nm incident light are allocated to the blue and green channels, and the images taken with 540 nm incident light to the red channel. The SECs and crypt openings (COs) are well reproduced using 415 nm light. As they are expressed as a darker pattern using the blue and green channels than with the red channel, the blue/green density is decreased. As a result, elements of the remaining red channel are relatively strongly expressed, and the SECs and COs are displayed as brown (dark red) in color on a liquid crystal monitor. Vessels (CVs: collecting venules) somewhat deeper and greater in diameter than those just underneath the epithelium are well reproduced using 540 nm light. As they are expressed as a darker pattern using the red channel than with the blue and green channels, the red density is decreased. As a result, CVs are seen as a combination of the remaining green and blue channels, or cyan in color. The MCE is relatively bright with all the color channels; so in the constructed image it retains a bright pattern (white semitransparent)
I will analyze in detail the grayscale image taken with light with a central wavelength of 415 nm (Fig. 8.1a). When we project a narrow band blue light with a central wavelength of 415 nm, it is strongly reflected at the mucosal surface; so the indentations of the gastric fundic glands (crypts) are seen as black, and we can clearly see the morphology of the crypt openings (COs). We see white semitransparent rings of marginal crypt epithelium (MCE) bordering the COs. Surrounding the rings of MCE are polygonal (mainly regular hexagonal and pentagonal) closed loops of subepithelial capillaries (SECs) anastamosing with each other. This honeycomb-like subepithelial capillary network (SECN) pattern can be visualized as black in high contrast. However, the collecting venules (CVs), located somewhat deeper than the capillaries, are not delineated. In other words, this narrow band blue light contributes to the visualization of SECs and the mucosal microsurface structure.
8.1.2 Characteristics of Grayscale Images Taken with Narrow Band Green Light (Central Wavelength 540 nm) (Fig. 8.1b)
When we project a narrow band green light with a central wavelength of 540 nm (Fig. 8.1b), there is little reflection or scattering at the mucosal surface; so the CO morphology and MCE are not clearly delineated.
Capillaries just underneath the surface epithelium only absorb some light; so they are delineated as a low contrast gray. However, the CVs, with a larger diameter and located somewhat deeper than the capillaries, that were not visualized using 415 nm light, are clearly delineated as higher contrast black with narrow band 540 nm light. In other words, this narrow band green light is not useful for visualizing the mucosal microsurface structure (COs and MCE), but contributes somewhat to the visualization of part of the SECN and CVs.
8.2 Allocation to Color Channels and Construction of Color Image
< div class='tao-gold-member'>
Only gold members can continue reading. Log In or Register to continue
Related posts:
 Basic Principles for the Interpretation of Magnified Endoscopic (ME) Findings: Vessels (V) Plus Surface (S) Classification System
The Proposed Vessels Plus Surface (VS) Classification System: Principles for Interpretation of Magnifying Endoscopy with Narrow-Band Imaging (M-NBI) Findings
Basic Principles for the Interpretation of Magnified Endoscopic (ME) Findings: Vessels (V) Plus Surface (S) Classification System
The Proposed Vessels Plus Surface (VS) Classification System: Principles for Interpretation of Magnifying Endoscopy with Narrow-Band Imaging (M-NBI) Findings
 Clinical Applications of Magnifying Endoscopy with Narrow-Band Imaging (M-NBI) of the Stomach
 Light Blue Crests (LBCs) and White Opaque Substance (WOS)
 Magnifying Endoscopy (ME) of the Stomach Targeting the Microvascular Architecture
 Analysis and Interpretation of Magnifying Endoscopy with Narrow Band Imaging (M-NBI) Findings in Gastric Epithelial Tumors (Early Gastric Cancer and Adenoma) Stratified for Paris Classification of Macroscopic Appearance
Stay updated, free articles. Join our Telegram channel

Full access? Get Clinical Tree


