The Men’s Health Initiative of British Columbia (MHIBC) was created as a large-scale umbrella initiative aimed at connecting the dots by identifying, coordinating, and consolidating the existing foci of excellence across the many domains of male health in the province, enabling widespread community and professional education, risk assessment, prevention-promotion, screening, and early diagnosis. The MHIBC will reach out to men across all ages, races, and socioeconomic groups and will apply a male lens to current and future health research, health promotion, awareness, and health policy development.
Overview
The health risks associated with men’s gender or masculinity have remained largely unproblematic…. Left unquestioned, men’s shorter lifespan is often presumed to be natural and inevitable
The women’s health lens has become an important aspect of planning in many health care systems. Results have been impressive, with better-targeted policies, sophisticated research programs, and improved clinical services acting together to enhance health outcomes for women. An example from British Columbia, Canada is the British Columbia Center of Excellence for Women’s Health, established in the early 1970s to respond to unmet health needs identified by leaders in the women’s movement. The center has identified and provided comprehensive health services to women for the past 25 years, but there is no equivalent center for men.
The lens through which men’s health is examined will influence how it is understood and advanced. As Courtenay highlights :
Most of what we currently understand about men’s health is fragmented and diffuse. It is fragmented by the individual disciplinary lenses through which we view men’s health as epidemiologists, health educators, medical anthropologists, nurses and physicians, psychiatrists, ethnographers, psychologists, public health workers, social workers and sociologists. These individual lenses enable us to deeply understand very specific aspects of men’s health. However, they also often limit the ways in which we conceptualize and understand men’s experiences more broadly.
Men’s health has matured over the past 2 to 3 decades, and both Australia and Ireland have developed official federal male health policies. In Canada, issues around men’s health have captured increasing interest of health professionals, researchers, the media, the lay public, and politicians. However, a lack of partnership and synergy within and between research, practice, and policy contexts has encumbered the advancing of men’s health promotion in our country.
The Men’s Health Initiative of British Columbia (MHIBC) was officially launched in November, 2009. It is organized as an umbrella, a brand name, and a single point of contact to identify and include multiple academic and community foci of interest and excellence and to catalyze cooperation and partnership. In this way, it will facilitate educational collaboration, broad-spectrum research, the gathering or the production and dissemination of best practices or standards of care, and enable the advocacy of men’s health issues at all levels of government. The MHIBC will reach out to men across all ages, races, and socioeconomic groups and will apply a male lens to current and future health promotion, awareness, and policy activities. A male gender–approach will benefit spouses Vancouver, British Colimbia, Canada: children and extended families and communities by highlighting key gender-specific biologic, psychological, social, and cultural determinants aiming to achieve the best health care possible for the men of British Columbia.
In an early project of the MHIBC, the author and colleagues performed a review of the gray and white literature to address the complexities of decreased male life expectancy and potential years of life lost. This review resulted in the creation of “A Roadmap to Men’s Health: Current status, Research Policy and Practice” (The Roadmap), which is an overview of why men’s health matters, what we know, gaps in our knowledge/service delivery, and what new directions we should be taking. The scope of the report includes male-specific conditions (eg, prostate cancer, testis cancer, hypogonadism, and sexual dysfunction) and male-risk conditions (conditions for which being a man represents a significant risk factor regarding incidence, outcome, or mortality [eg, cardiovascular disease, lung cancer, osteoporosis, HIV, and suicide]). These conditions are examined in the framework of the factors that underlie sex and gender differences in health status, including differences in health-related attitudes and behaviors. Because it is unlikely that biology alone can explain all gender differences, much research is required to examine the interplay, perhaps through epigenomic phenomena, between environment, diet, socioeconomics, and biologic manifestations of disease. The author presents some of the findings of this extensive report.
Life Expectancy
Gender, as a key determinant of health, and the experience of being a man in our society both strongly affect our health and how it is managed. Many questions need to be asked and answered on gender-specific and gender-dominant issues affecting all the ages and stages of the male lifespan. In Canada and many countries around the world, a consistent pattern of life expectancy has developed over the past century: men die at an earlier age than women. British Columbia provincial data from 2004 to 2008 indicate that men had a mean life expectancy of 78.9 years, whereas women had a mean life expectancy of 83.3 years, a difference of 4.4 years. Life expectancy data for British Columbia over an extended time period (beginning about 1920) show a steady increase in life expectancy for both genders, with women consistently living longer than men ( Fig. 1 ). This gender difference in life expectancy was less than 5 years between 1920 and 1940 and then it increased steadily until 1980 at which time women had an almost 8-year advantage in life expectancy. This gender gap decreased just as dramatically between 1980 and the present, returning to a level of just more than 4 years.
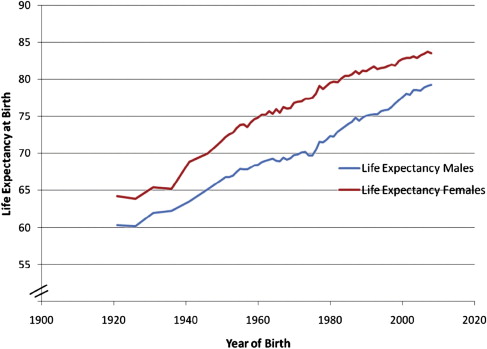
There is no clear explanation for this marked fluctuation in relative life expectancy and we cannot predict whether the gender gap in life expectancy will continue to diminish (we simply do not know the factors responsible for changes in the size of this gap). Also, these gender life expectancy differences are fairly consistent across various regions of the province over the past few decades.
Health Expectancy
Beyond length of life, more revealing statistics relate to the age at which a person loses his or her good health (health expectancy) and the numbers of years of life lost because of dying at an early age (potential years of life lost). In general, once men develop a serious health condition, the prognosis is worse than that for women and they are more likely than women to die of it; “in nearly all countries for which data were available, women live longer ’healthier lives’ and once sick live from 0.2 years to 7.3 years longer than men in sickness.” Such differential health outcomes affect millions of men every year. As one research team has observed: “There is a remarkable discrepancy between the health and survival of the sexes: men are physically stronger and have fewer disabilities, but have substantially higher mortality at all ages compared with women: the so-called male-female health-survival paradox.” With an average health expectancy of 65 years, Canadian men may experience 11 or more years of poor health and disability before they die. This figure is even higher in subgroups, such as Native Canadians.
Given this striking discrepancy in life expectancy and the decrease in health expectancy, one would expect to find that men’s health has been a high priority for many years, drawing substantial investment of financial and intellectual resources from policymakers and researchers. But in fact, the domain of men’s health has been neglected, receiving serious and widespread attention only in the last decade. Through most of the history of health care research and practice, findings of inferior health outcomes for men have been met with a kind of resignation, as though gender disparity in health outcomes were simply an unavoidable feature of the world, something to be accepted rather than addressed.
Clearly, identifying the reasons for differential mortality between men and women, the relative contribution of various causal factors, would enable us to research and develop meaningfully targeted interventions to reduce the gender gap in life expectancy. However, there has been surprisingly little focused research attempting to discover the nature of sex differences associated with the observed life expectancy gap, their causation, and potential remediation.
MHIBC: a roadmap to men’s health: current status, research, policy and practice
“Having a Y chromosome should not be seen as possessing a self destruct mechanism.”
To understand the differences in mortality and other health outcomes between men and women, a framework was developed for this report. This framework included biologic factors (eg, differences in hormone levels between men and women), environmental factors (eg, men being preferentially hired into physically dangerous jobs), and behavioral factors (eg, men taking risks at a high level, being reluctant to adopt positive health behaviors, and not seeking health care services when appropriate). This framework was applied to the leading causes of early male mortality and potential years of life lost.
Data concerning causes of death in British Columbia is available in a report produced by the British Columbia Ministry of Health Planning that shows the incidence of death by various causes in 2002 for men and women. Highlights of the report are presented in Table 1 , with data clustered by age group: individuals aged 15 to 24 years, 25 to 44 years, 45 to 64 years, and 65 to 84 years. This data table gives us some ideas about the sources of increased mortality of men. For example, we see that unintentional injuries seemed to be a significant source of mortality difference between men and women, with men showing much higher mortality caused by injuries in 2 of the age groups. Cardiovascular disease also presents much higher male mortality. By contrast, mortality caused by cancer is similar for men and women.
| Men | Women | |
|---|---|---|
| 15–24 y | ||
| Unintentional injuries | 105 | 36 |
| Suicide | 34 | 11 |
| Cancer | 9 | 11 |
| Congenital anomalies | 4 | 7 |
| Disorders of the nervous system | 5 | 3 |
| Other causes | 52 | 27 |
| 25–44 y | ||
| Unintentional injuries | 231 | 64 |
| Cancer | 98 | 115 |
| Suicide | 110 | 31 |
| Infections of the nervous system | 55 | 22 |
| Other causes | 280 | 144 |
| 45–64 y | ||
| Cancer | 943 | 934 |
| Cardiovascular diseases | 546 | 145 |
| Unintentional injuries | 190 | 53 |
| Liver diseases | 113 | 58 |
| Infectious diseases | 94 | 48 |
| Other causes | 786 | 42 |
| 65–84 y | ||
| Cancer | 2516 | 2083 |
| Cardiovascular diseases | 1934 | 1399 |
| Cerebrovascular diseases | 492 | 539 |
| Chronic pulmonary disease | 413 | 351 |
| Diabetes mellitus | 290 | 214 |
| Other causes | 1856 | 1667 |
This information is useful, but we need something more to make sense of the life-expectancy gap between men and women; we need a statistic that will take into account both the differential rate of mortality and the age at which death occurs. A death occurring in one’s 20s steals many more years of life than a death occurring in one’s 70s. Fortunately, there is an index that is commonly used in epidemiology to take into account these two aspects of mortality. This index is the potential years of life lost (PYLL), which is also known as years of life lost (YLL). The PYLL index indicates the “number of years of life ‘lost’ when a person dies ‘prematurely’ from any cause, before age 75 – taking the median age in each age group, subtracting from 75, and multiplying by the number of deaths in that age group disaggregated by sex and cause of death.” This index is very useful, allowing us to understand the longevity difference between the sexes in how much of the total gap (what proportion of the lost years of life) is attributable to various health conditions. By taking into account not only the rate but also the age of death, the PYLL is a powerful statistic that can help us understand the life expectancy gap in a more profound way, pointing us to key challenges and opportunities for creating change.
It must be noted that the PYLL does not fully measure the potential gain in life expectancy if we were to eliminate specific sources of mortality. This factor is mainly because there are other sources of mortality that would undo some of the gain (eg, preventing a fatal heart attack would not protect that person from other fatal conditions or accidents [competing risks]). There is another statistic for measuring the potential gain from reducing a source of mortality known as potential gains in life expectancy (PGLE). The PGLE, by the elimination of deaths from a particular cause, is the added years of life expectancy for the population if the deaths from that cause were removed or eliminated as a competing risk of death. This type of measurement is based on multiple-decrement life table techniques that properly take into account competing risks of death and the age structure of the population. Unfortunately, available epidemiologic data has mostly not been analyzed in terms of the PGLE. But keeping in mind the problem of competing risks will make us more cautious in projecting the benefit from interventions to reduce a source of male mortality, remembering that another health condition or accident may be waiting its turn to cause death. For example, we might succeed in reducing the likelihood of death from some type of cancer without extending life expectancy (if another condition takes that life around the same age that cancer would have).
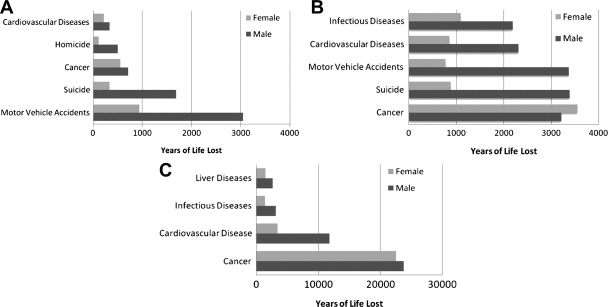
In Fig. 2 , we see the differences between men and women in British Columbia expressed in PYLL, once again organized by age at the time of death. These data are for the year 2006. Not surprisingly, the pattern of mortality changes considerably across the age groups, with motor vehicle accidents accounting for a much higher proportion of PYLL in the younger age groups, whereas cancer becomes the leading cause of death in the 45- to 74-year-old age group. Although not shown here, the pattern among those aged older than 75 years looks quite similar to that found in the 45- to 74-year-old age group. One further step is needed to attain a clear understanding of the differences between men and women in life expectancy: an overall picture of the differences between men and women in years of life lost, across the age groups, ranked in terms of the leading contributors to the life expectancy gap. To obtain this overall picture, the author calculated the difference between PYLL by men and those lost by women, that is, men’s PYLL minus women’s PYLL across the age groups. In this way, the author was able to identify the 5 sources of mortality contributing most to the life expectancy gap between men and women ( Fig. 3 ).
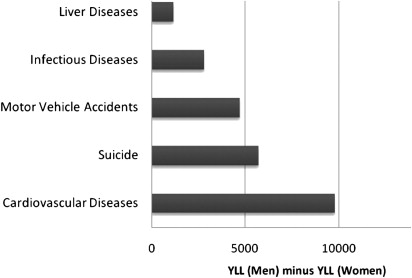
This information provides a novel picture of the life expectancy gap, yielding a different type of information from that provided by tables of death rates. Here, we see that the first contributor to the gender gap is cardiovascular disease (CVD), which causes substantial mortality in men at a younger average age than in women. The second greatest contributor to the gender gap is suicide, which affects men more often than women and occurs fairly often in younger age groups. The third greatest contributor to the gender gap is motor vehicle accidents. These accidents are more common and more often fatal in men, occurring relatively often in the younger age groups. The fourth greatest contributor to the gender gap is infectious disease. Note that the infectious disease accounting for the most years of life lost for men versus women is HIV/AIDS. The fifth greatest contributor to the gender gap is liver disease, with most of the liver disease accounting for years of life lost for men versus women caused by alcohol dependence. This overall picture of the gender gap in life expectancy provides a critically important indication of opportunities for reducing the gap. Each contributor to the gender gap represents an opportunity , an area in which interventions to improve knowledge or service delivery might make a meaningful improvement in men’s health and mortality risk.
Cardiovascular disease
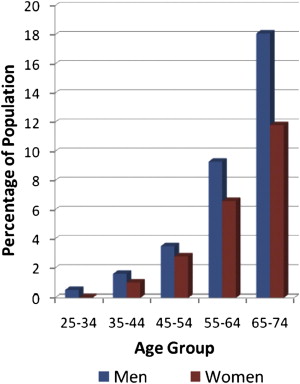
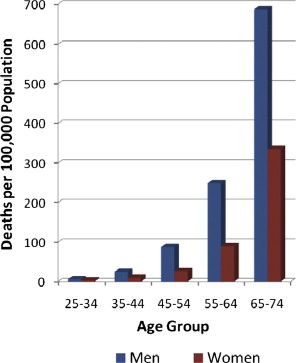
It can be seen in Fig. 4 that the prevalence of heart disease increases more quickly in men than in women, particularly from the 55 to 64 age range onwards. Not surprisingly, this greater prevalence of CVD in men translates into higher rates of CVD-related mortality. Fig. 5 , also adapted from 2009 Tracking Heart Disease and Stroke in Canada, shows the rates of death caused by CVD between the ages of 25 and 74 years for different age groups. Even more strikingly than in the prevalence graph, we see the greater impact of CVD on men’s mortality, beginning in the 55 to 64 age range. As we learned using the PYLL index, both the higher death rate and earlier onset for men contribute to CVD’s importance as a source of the average life expectancy gap.
Suicide
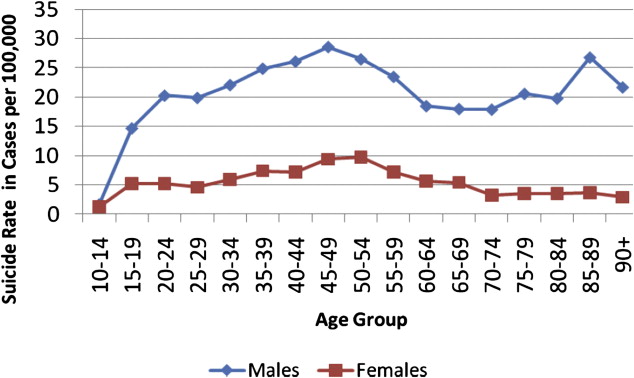
In Canada, the male suicide rate is about 3 times that of women. Fig. 6 charts the age- and gender-specific incidence of suicide in Canada, based on data from 2001to 2005. The chart shows 2 patterns: (1) The male suicide rate increases fairly steadily with age until peaking in the late 40s, then decreases significantly and increases again in the 80s. (2) Male rates are greater than female rates at all ages and substantially greater across most of the lifespan.
The evident male pattern of peak in suicide rate in the 40s and 50s is surprising in light of multinational data showing one of two patterns: a steady increase in suicide rate with age or a peak of suicide in younger age groups. However, a change in this suicide pattern may be underway:
Among U.S. white men, middle age has historically been a time of relatively lower risk of completed suicide, compared with elderly men. Yet by 2005, the suicide rate of white men aged 45–49 years was not only higher than the rate for men aged <40 years but also slightly higher than the rate for men aged 70–74 years…. In the past, suicide-prevention efforts have focused most heavily on the groups considered to be most at risk: teens and young adults of both genders as well as elderly white men, whose rates of suicide have historically been the highest in the U.S. Attention and resources dedicated to these subgroups may have increased the awareness and identification of suicide in these populations, perhaps partly because the very young and very old groups are easier to identify or study in settings such as schools or primary care. Suicide in the middle-adult years has not been studied as extensively.
It is apparent that our knowledge of male suicide is lagging behind changes in the age-specific incidence of this source of mortality. Until we understand the underlying reasons for this relative increase in men’s dying by suicide in middle age, we will not be able to implement preventative action. Suicide is the second leading source of PYLL by men in comparison with women, reflecting both men’s higher rate of suicide and the young age at which many suicide deaths occur (see Fig. 3 ). In Canada, suicide accounts for about 10% of all PYLL for men and in British Columbia, it accounts for about 7%. But the PYLL calculation does not measure the potential gain in life expectancy if we were to eliminate that source of mortality. Men in British Columbia would not live 7% longer on average if we prevented all male suicide. This factor is mainly because of other sources of mortality that would undo some of the gain; preventing an individual’s suicide would not protect that person from other health conditions or accidents (competing risks).
In addition to suicide rate, we also need to consider suicide attempts to understand the gender difference in suicidal behavior. Although men die by suicide at a higher rate, women have a higher rate of attempting suicide. It should be noted that there is a spectrum of self-harm, ranging from acts of physical self-harm not intended to be suicidal to acts that reflect ambivalence about dying to acts that reflect a clear and settled intention to die. The broad term deliberate self-harm (DSH) is used in the research to capture this range of possible actions. As one might expect from the suicide attempt statistics, women show much higher rates of DSH.
Motor vehicle accidents
Men are generally more likely to act in physically risky ways when it comes to operating motor vehicles. Considerable evidence shows that young men are more prone than young women to drive at unsafe speeds and in a reckless manner. In British Columbia, the rates of serious injury from motor vehicle accidents (MVA) between 2003 and 2007 declined in both genders but men consistently averaged 12% more injuries than women.
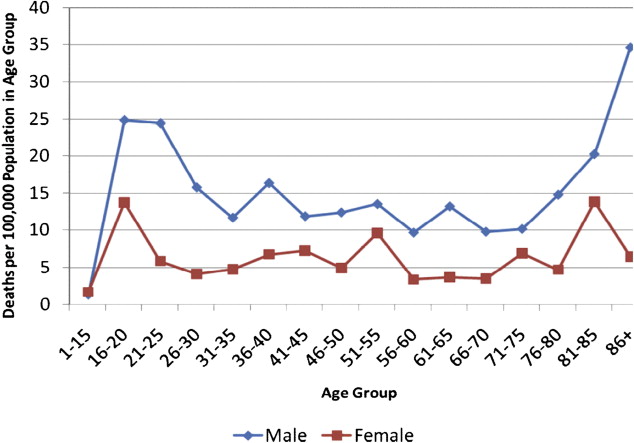
Motor vehicle accidents are among the leading cause of mortality for young men. Because these deaths happen at such a young age, they account for a large proportion of PYLL. As the author has shown, mortality from MVAs is the third leading cause of years of life lost by men in comparison with women (see Fig. 3 ). Mortality rates in British Columbia caused by MVA, by age and gender (for 2007), are shown in Fig. 7 . The overall pattern of higher male rates is consistent but the gender difference is accentuated, especially in the 16- to 25-year-old age group, accounting for a huge number of life years lost. There is also a higher mortality rate for men aged older than 80 years, but the absolute numbers are small.
Related posts:
 Men’s Health
 Changes in Male Fertility in the Last Two Decades
Androgen Deficiency in Aging and Metabolically Challenged Men
Adult Male Health Risks Associated with Congenital Abnormalities
The Optimal Male Health Diet and Dietary Supplement Program
Changes in Male Fertility in the Last Two Decades
Androgen Deficiency in Aging and Metabolically Challenged Men
Adult Male Health Risks Associated with Congenital Abnormalities
The Optimal Male Health Diet and Dietary Supplement Program
 Influences of Neuroregulatory Factors on the Development of Lower Urinary Tract Symptoms/Benign Prostatic Hyperplasia and Erectile Dysfunction in Aging Men
Stay updated, free articles. Join our Telegram channel

Full access? Get Clinical Tree


