Probe
Characteristic
Function
2-Photon ex range
Nuclear and cell structure
Hoechst 33342
Labels cell nuclei blue
Nuclear change (apoptosis, mitosis)
780–820 nm
Propidium iodide
Labels cell nuclei red, membrane impermeable
Necrotic change of nuclei
820–850 nm
Calcein-acetoxymethyl (AM)
Labels cytosol of tubular and endothelial cells
Cell viability
800 nm
Quinacrine
Loads preferentially into brush border and subapical vesicles
Endo- and exocytosis, and apical shedding. Renin granules in the juxtaglomerular apparatus
700–720 nm
Mitochondria and metabolism
Tetramethyl rhodamine methyl ester (TMRM)
Mitochondrial membrane-dependent dye
Mitochondrial density and health that loads well into proximal and distal tubules, and glomeruli
800–860 nm
Rhodamine-123
Mitochondrial membrane-dependent dye
Mitochondrial density and health that loads preferentially into the proximal tubule
780–860 nm
Rhodamine B hexyl ester
Endothelial cell mitochondrial membrane-dependant dye
Labels metabolically active endothelial cells
800–860 nm
Dihydroethidium
Superoxide sensitive dye that fluoresces red and binds to DNA
Indicates levels of reactive oxygen species production
700–720 nm
Monochlorobimane
Forms a fluorescent adduct in the presence of glutathione
Indicates levels of intracellular glutathione
700–720 nm
Calcium sensors
Rhod-2 AM
Calcium sensitive dye that is generally localized to the mitochondria
Indicates levels of intracellular calcium
850–900 nm
Fluo-4 AM
Calcium sensitive dye
Fluorescence intensity increases on calcium binding
810 nm
Vascular and permeability
3000–4000-Da dextran-fluorophore conjugate
Freely filtered by the glomerulus
Indicates glomerular permeability and proximal tubule endocytosis
Dependent on conjugate fluorophore
70,00–500,000-Da dextran-fluorophore conjugate
Not filtered by the kidney, but retained in the vasculature
Indicates glomerular permeability, vascular flow, and vascular permeability
Dependent on conjugate fluorophore
1.2 FLIM and Metabolism
The fluorescence lifetime is the mean time a fluorophore remains in an excited state before emitting a photon (fluorescence) and returning to the initial ground state. The fluorescence lifetime of a fluorophore, either endogenous or synthetic, depends on the type of molecule, its conformation, and the way the molecule interacts with the surrounding microenvironment [15]. FLIM constructs a spatial distribution map of fluorescence lifetimes of a sample imaged by confocal, multiphoton, endoscopic, or wide-field microscopy. Importantly, FLIM can be used to measure molecular environmental parameters, and the metabolic state of cells and tissues via endogenous fluorescence. There are two major approaches used to measure the fluorescence lifetime of a sample: time and frequency domain. Typically, frequency-domain FLIM has superior signal-to-noise ratio for complex systems with multiple fluorophores and faster acquisition times, yet requires more complex analysis compared to time-correlated FLIM. Background and principles to these two different techniques are readily available [1].
NAD(P)H lifetime measurements are widely used for metabolic and redox imaging in vitro and in vivo [16, 17]. The fluorescence lifetime of NAD(P)H is resolved as a two-component system with the short (~0.3–4 ns) and long (~2.3 ns) lifetime represented as the free and protein-bound conformations, respectively [18]. NAD+ is not excited at 740 nm whereas NAD(P)H is. The ratio of NAD(P)H:NAD(P)+ has been used previously as a measure of the redox state of the cell. Bird and colleagues demonstrated that the free-to-bound ratio of NAD(P)H, represented by the ratio of the amplitude coefficients for the short and long lifetimes (i.e. α 1/α 2), is related to the NAD(P)H/NAD(P)+ ratio and can be used as an indicator for redox changes within the cell [17]. FAD is also examined routinely by FLIM for intracellular metabolic and redox analysis. While FAD can be found in a free and protein-bound conformation, the former has a significantly higher quantum yield with a lifetime of 2.91 ns. In contrast to NAD(P)H, only the oxidized form of FAD is fluorescent and is used to measure changes in the redox state of the cell in combination with NAD(P)H [19]. The fluorescence lifetime of NAD(P)H and FAD is a viable indicator of ischemia-reperfusion injury (IR) within the liver [2] and kidney [20] in vivo. The fluorescence lifetime changes associated with necrosis [14] and apoptosis [21] have also been described and can be used to measure tissue responses to drug treatments and disease states. To date, however, studies using FLIM analysis in the kidney are limited in number (see Note 3 ).
1.3 Characteristics of Metabolic Changes Detected by MPM
Metabolic alterations to the kidney are readily observable via MPM. Discerning the reason for these changes requires knowledge of some basic pathophysiological processes. The oxidized and reduced redox cofactor pairs FAD/FADH2 and NAD+/NADH are becoming increasingly recognized as key metabolic indicators of the state of cellular metabolism associated with health and disease.
NADH and FADH2 are formed during glycolysis, fatty acid oxidation, and the citric acid cycle, and are both energy-rich molecules due to the presence of an electron pair (Fig. 1). The kidney has minimal glycolytic capacity and relies primarily on oxidative phosphorylation to produce ATP, which occurs as a result of the transfer of electrons from NADH or FADH2 to O2 by a series of electron carriers located on the inner mitochondrial membrane. NADH is a substrate for complex I of the electron transport chain (ETC) which catalyzes the oxidation to NAD+ (Fig. 1a, b). Decreased O2 supply causes reduced complex I activity and a failure to convert NADH to NAD+ (nonfluorescent). This “backing up” of NADH is observed by MPM (excitation ~740 nm) as increased fluorescence emission compared to basal conditions (Fig. 1c, d). Oxygen deprivation reduces ATP production and ATP-dependent processes, such as actin polymerization, causing plasma membrane disruption and alterations to ETC complexes. Oxygen re-presentation to damaged components of the ETC at reperfusion is thought to result in the production of ROS, mainly superoxide (O2 −) (Fig. 1e, f).
Fig. 1
Structural and metabolic alterations detected by MPM in the kidney following ischemia-reperfusion. In the normal healthy kidney cortex endogenous fluorescence at 740 nm detects NAD(P)H in the tubular epithelium indicated as green (a). The source of this fluorescence is primarily NADH which is a substrate produced by TCA cycle that acts as a proton donor for complex I of the ETC that contributes to oxidative phosphorylation and the production of ATP within mitochondria (b). FADH2 is also a proton donor produced by TCA cycle that is converted to FAD by complex II. During ischemia, tubular swelling, reduction in interstitial space, and increased endogenous fluorescence are observed (c). This represents accumulation of NADH within mitochondria due to reduced electron transfer on the ETC, resulting in ATP depletion and mitochondrial membrane disruption due to reduced ATP-dependent actin polymerization (d). At reperfusion, tubular cell detachment (arrow head) and cast material formation (arrows) can be observed (e). The re-presentation of oxygen to damaged components of the ETC on the IMM results in increased O2 − formation and mitochondrial swelling due to osmotic dysregulation (f). Abbreviations: OMM outer mitochondrial membrane, IMM inner mitochondrial membrane, TCA cycle the citric acid cycle, NADH nicotinamide adenine dinucleotide reduced, NAD+ nicotinamide adenine dinucleotide oxidized, FADH 2 flavin adenine dinucleotide oxidized, FAD flavin adenine dinucleotide reduced, ATP adenosine triphosphate, ADP adenosine diphosphate, Pi inorganic phosphate, Q Ubiquinone, C cytochrome c, CoQH 2 Ubiquinol
Fluorescence lifetime changes of NAD(P)H varying depending on the type of insult and temporal influences, and usually requires further investigation into the protein interactions of NAD(P)H such as the ratio of free-to-bound NAD(P)H (α 1/α 2). An increased ratio demonstrates either an increase in free NAD(P)H or decrease in protein-bound NAD(P)H. Binding of NAD(P)H occurs primarily on complex I of the ETC. An increased ratio is consistent with mitochondrial dysfunction and increased ROS production. FAD cannot be excluded when detecting fluorescence emission at 740 nm excitation, and further information can be provided by fluorescence lifetime differences of FAD detected by FLIM. Decreased lifetime fluorescence detected by FLIM likely indicates decreased protein-bound FAD to the succinate dehydrogenase enzyme complex of complex II of the ETC and, in addition, decreased free FAD due to decreased complex II utilization and re-presentation of FAD to the citric acid cycle (Fig. 1). Both explanations underlie impaired metabolism and/or mitochondrial dysfunction. Alternately, increased FAD lifetime may indicate enhanced metabolism and increased turnover of FADH2 to FAD.
The specific use of endogenous and infused fluorophores is now described, using as an example our investigation of changes in renal pathophysiology from IR injury to the kidney, and the role of mitochondrial dysfunction. Measurements of NAD(P)H and FAD were compared with other measurements of oxidative stress in progressive IR injury in the kidney.
2 Materials
2.1 Kidney Ischemia-Reperfusion Injury
1.
Animals: Male 4–6 week old C57Bl6 mice.
2.
Anesthetic: Mixture of ketamine (10 mg/mL) and xylazine combination (1 mg/mL).
3.
Protective eye cream.
4.
Small animal hair clippers.
5.
Betadine antiseptic liquid.
6.
Surgical instruments, sterilized.
7.
Microvascular clamps (16 mm straight micro-serrefine clamps from Fine Science Tools Inc. Foster City, CA, USA).
8.
4/0 Suture (for a chronic recovery model).
2.2 Multiphoton Microscopy
We routinely worked closely with a technician specialized in MPM; however the required skills can be learned by scientists with dedication over time.
2.2.1 The MPM Room
1.
The typical MPM room in any institute imaging facility is, of necessity, mostly filled with the large MPM and associated laser and computer equipment (Figs. 2 and 3). The room itself is cooled to cope with heat from the MPM and lasers, so it is necessary to carefully control any in vitro and in vivo experiments to physiological temperatures. For example, for our in vivo mouse experiments, animal body temperature is regulated with a heated pad that covered the animal on the MPM stage, and also served to weight the mouse and its kidney, and so minimize respiratory movement distorting live images (Fig. 4). A rectal probe can be used to monitor body temperature of the animals during the protracted MPM procedures.
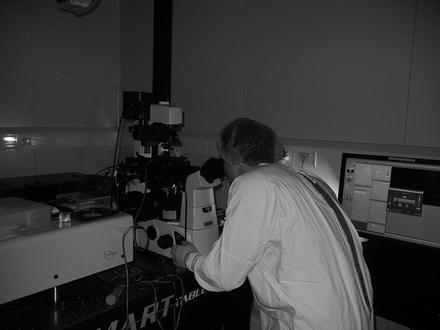
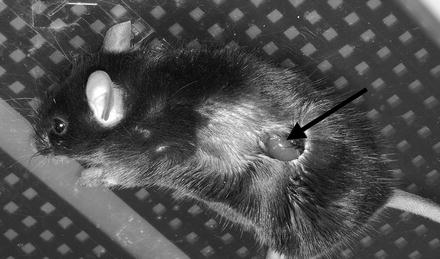
Fig. 2
Common equipment and floor plan for MPM facility. The equipment required for intravital MPM include the MPM microscope and associated computer station with automated operating software, pressurized suspension optical table, laser source, work bench, and Class 2 biohazard cabinet that can be used for small animal surgery. Interfering light needs to be considered, especially from the biohazard cabinet. The installation of a blackout curtain allows limited use of the biohazard cabinet, plus entry or exit from the room whilst the MPM is in use; however all room lights are turned off when image capture is occurring. Internal room temperature needs to be kept constant considering heat can be generated from the laser and an appropriate booster cooling system should be employed
Fig. 3
Practicalities of intravital MPM operation. Kidney MPM involves a coordinated approach, especially when imaging ischemia-reperfusion injury. An approximate field of view and imaging depth can be found using a mercury laser source and the microscope eyepiece, before switching to the titanium:sapphire laser source and engaging the PMT to observe through the computer operating system. It is ideal if these two systems are in close proximity. Always apply the appropriate health and safety requirements for your institution; in this case, a lab coat, hair cover, and gloves
Fig. 4
Externalized mouse kidney for intravital MPM. Surgical preparation requires the externalization of the kidney whilst maintaining appropriate temperature controls. Following a left flank skin incision, the external and internal muscle layers are cut to reveal the kidney (arrow). A small animal heat pad can be seen beneath the mouse. The animal is then inverted and the exposed kidney placed over the MPM objective for imaging of the kidney
2.
The room also usually houses a Class 2 biohazard cabinet (Fig. 2) that can also be used for small animal surgery. However, the light from the biohazard cabinet interferes with the MPM image capture. A blackout curtain was installed to allow some use of the biohazard cabinet whilst using the MPM, but the cabinet lights must be turned off during image capture. The curtain also allows some entry or exit from the room whilst the MPM is in use.
2.2.2 Basic Microscope for Image Capture
1.
 Propagation and Culture of Human Renal Fibroblasts
 Isolation and Primary Culture of Murine Podocytes with Proven Origin
 Isolation and Propagation of Rat Peritoneal Mesothelial Cells
 An In Vitro Murine Model of Vascular Smooth Muscle Cell Mineralization
 Qualitative and Quantitative Analysis of Histone Deacetylases in Kidney Tissue Sections
 The Isolation and Quantitation of Fetuin-A-Containing Calciprotein Particles from Biological Fluids


Multiphoton microscope: There are many specialized multiphoton microscopes with different lasers, objectives, and selection of direct or inverted microscopy. We use a Nikon Ti Eclipse—LaVision MPM (LaVision BioTec GmbH, Bielefeld, Germany) equipped with an ultrashort (85 fs pulse width) pulsed mode-locked 80 MHz Titanium:Sapphire MaiTai™ laser (Spectra Physics, Mountain View, CA, USA) and ImSpector Pro software. The MPM has a motorized xyz stage and is therefore capable of producing large xy and z montages. The choice of excitation wavelength is dictated by the probes and/or endogenous fluorescence being used.
Related posts:
Propagation and Culture of Human Renal Fibroblasts
Isolation and Primary Culture of Murine Podocytes with Proven Origin
Isolation and Propagation of Rat Peritoneal Mesothelial Cells
An In Vitro Murine Model of Vascular Smooth Muscle Cell Mineralization
Qualitative and Quantitative Analysis of Histone Deacetylases in Kidney Tissue Sections
Stay updated, free articles. Join our Telegram channel
Full access? Get Clinical Tree
