Fig. 1
Typical conventional EUS (right) and EUS elastography (left) images of the normal pancreatic parenchyma. EUS elastgraphy (right) shows red and green area in the entire pancreatic parenchyma which indicate soft tissue. EUS endoscopic ultrasonography
Fig. 2
Typical conventional EUS (right) and EUS elastography (left) images of the pancreatic carcinoma. Conventional EUS (right) shows a hypo-echoic lesion at the head of the pancreas. EUS elastography (left) reveals blue area in the entire lesion which indicates hard tissue. EUS endoscopic ultrasonography
Fig. 3
Typical conventional EUS (right) and EUS elastography (left) images of the chronic pancreatitis. The color map of chronic pancreatitis is more heterogeneous than that of normal pancreatic parenchyma which is shown in Fig. 1. EUS endoscopic ultrasonography
2.
The strain ratio
The strain ratio is the ratio of the elasticity of a reference region in the adjacent tissue to the elasticity of the suspicious mass, thus in each procedure, the elasticity of the mass lesion (A) and the soft-tissue reference area (B) is measured and the corresponding mean strain ratios (i.e., B/A) are calculated [27]. Two studies have assessed the accuracy of strain ratio-based EUS elastography for diagnosing pancreatic malignancies with the sensitivity ranging from 93 to 100 % and the specificity ranging from 17 to 95 % [28, 29]. Therefore, the strain ratio-based EUS elastography results are variable, especially in terms of specificity.
3.
Hue histogram analysis
Hue histogram analysis involves a quantitative scale of elasticity that ranges from 0 (softest) to 255 (hardest) and is applied by analyzing the traditional color distribution of hardness by post-processing software [29, 30]. Several studies have shown that, when the average hue histogram value of > 175 is used to indicate malignancy, the hue histogram-based EUS elastography differentiates benign from malignant pancreatic masses with a sensitivity and specificity of 85–93 % and 64–76 %, respectively [29, 30].
4.
Artificial neural networks
Recently, a study on neural networks that used artificial intelligence methodology was reported. In that study, the post-processing software analysis was used to compute the individual elastography frames into a numeric matrix [31, 32]. These data were then subjected to extended neural network analysis that automatically differentiates benign from malignant patterns. This method differentiated benign from malignant pancreatic masses with a sensitivity of 88 % and a specificity of 83 % (33 %). Moreover, the corresponding area under the receiver operating characteristic curve was 0.94, which was significantly higher than the values obtained by simple mean hue histogram analysis (33 %).
EUS Elastography for Evaluating Pancreatic Parenchyma
The EUS elastography is also used for diagnosis of chronic pancreatitis. The color map of chronic pancreatitis is more heterogeneous than that of normal pancreatic parenchyma (Fig. 3). A significant linear correlation is obtained between the strain ratio and the number of EUS criteria of chronic pancreatitis (r = 0.813; P < 0.0001) [34]. The area under the receiver operating characteristic (ROC) was 0.949 and the accuracy with which EUS elastography diagnosed chronic pancreatitis was 91 %, when the cut-off strain ratio of 2.25 was used [34]. Itoh et al. subjected the EUS elastographic images of the upstream pancreas and the pancreatic tumor in 58 patients to statistical analysis and then assessed how well parameters of elastography, including the mean, standard deviation, skewness and kurtosis, could diagnose the histological fibrosis of the pancreatectomy specimens, which was graded into four categories (normal, mild, marked, and severe fibrosis) [35]. The most useful EUS elastography parameter was the mean for diagnosing pancreatic fibrosis with the area under the ROC curve of 0.90.
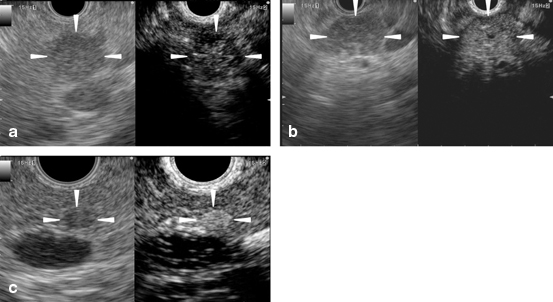
Fig. 4a-c
Typical conventional (left) and contrast-enhanced harmonic (right) EUS images of the pancreatic solid tumors. a A ductal carcinoma with hypo-enhancement. Conventional EUS (left) shows a hypoechoic area (arrowheads) of 15 mm in diameter at the body of the pancreas. Contrast-enhanced harmonic EUS (CH-EUS) (right) indicates that the area exhibits hypo-enhancement (arrowheads) compared with the surrounding tissue. b An inflammatory pseudotumor with iso-enhancement. Conventional EUS (left) shows a hypoechoic area (arrowheads) at the body of the pancreas. CH-EUS (right) indicates that the area exhibits homogeneous iso-enhancement (arrowheads) compared with the surrounding tissue. c A neuroendocrine tumor with hyper-enhancement. Conventional EUS (left) shows a hypoechoic area (arrowheads) of 5 mm in diameter at the body of the pancreas. CH-EUS (right) indicates that the area exhibits hyper-enhancement (arrowheads) compared with the surrounding tissue. EUS endoscopic ultrasonography
EUS Elastography for Evaluating Lymph Nodes
The differential diagnosis of benign and malignant lymph nodes is essential for clinically staging patients with cancer. Recently published meta-analysis with seven studies involving 368 patients with 431 lymph nodes showed that the pooled sensitivity of EUS elastography for the differential diagnosis of benign and malignant lymph nodes was 88 %, and the specificity was 85 % [36]. For the qualitative analysis, the dominance of blue color (relatively hard tissue) is used for as marker for malignancy, the accuracy reaches 85 % [37]. The quantitative analyses of the data indicated a sensitivity of 85–94 %, a specificity of 66–92 % and an overall accuracy of 86–89 % [38, 39]. The cut-off strain ratio value of 3.81 distinguished malignant lymph nodes from benign lymph nodes with a sensitivity and specificity of 86 and 85 %, respectively [40].
Contrast-Enhanced EUS
Ultrasound Contrast Agents
Intravenous ultrasound contrast agents are microbubbles consisting of gas covered with a lipid or phospholipid membrane [41]. A certain range of acoustic power induces microbubble oscillation or breakage [42, 43]. Contrast-enhanced harmonic ultrasonography selectively depicts the signals produced by microbubble oscillation or breakage. The first-generation ultrasound contrast agent was Levovist (Schering AG, Berlin, Germany), which is composed of microbubbles of room air covered with a palmitic acid membrane. Levovist requires high acoustic power to oscillate or break its microbubbles [41, 42]. The second-generation ultrasound contrast agents include SonoVue (Bracco Imaging, Milan, Italy), Sonazoid (Daiichi-Sankyo, Tokyo, Japan; GE Health care Milwaukee, WI, USA), and Definity (Lantheus Medical Imaging, North Billerica MA, USA) and are composed of gases (not room air). They can be oscillated or broken by lower acoustic powers [41, 43], and thus are more suitable for the EUS, because the small transducer of EUS produces limited acoustic power [44]. Immediately before performing contrast enhancement, the ultrasound contrast agents are reconstituted with sterile water. After images of the ideal scanning plane are displayed on the specific mode for contrast enhancement, a bolus injection of the ultrasound contrast agent is administered through a 22-gauge cannula placed in the antecubital vein.
Principle of Contrast-Enhanced EUS
Intravenous ultrasound contrast agents enhance EUS images by depicting the vessels. Contrast-enhanced EUS includes contrast-enhanced doppler EUS and contrast-enhanced harmonic EUS. The former modality is based on the principle that the phase shift of the signals received from ultrasound contrast agents produces pseudo-doppler signals [42, 43]. On contrast-enhanced doppler EUS, these pseudo-doppler signals increase the sensitivity with which color and power doppler imaging depict the doppler signals from vessels [45–51]. However, this modality remains limited in terms of real time vessel imaging, because of artefacts such as blooming.
The other contrast-enhanced EUS modality, namely, contrast-enhanced harmonic EUS, selectively depicts harmonic components that are integer multiples of the fundamental frequency [9, 10, 42–44]. When microbubbles are oscillated or broken after receiving a certain range of acoustic power, harmonic components are produced. The harmonic component derived from microbubbles is higher than that from tissues; thus, contrast harmonic imaging more intensively depicts signals from the microbubbles than those from the tissue by selectively detecting the harmonic components [9, 10, 42–44]. Contrast-enhanced harmonic EUS can be performed with a wideband transducer equipped with EUS and the second-generation ultrasound contrast agents which are oscillated or broken by low acoustic powers [9, 10, 44].
Contrast-Enhanced EUS for Pancreatic Solid Masses
On contrast-enhanced EUS, the solid pancreatic lesions can be characterized on the basis of their enhancement patterns relative to their surrounding tissue, namely, hypo-enhancement, iso-enhancement, or hyper-enhancement [52–55]. The contrast-enhanced harmonic EUS depicts pancreatic ductal carcinomas as nodules with hypo-enhancement that mostly have irregular network-like vessels (Fig. 4a) [52–55]. By contrast, most inflammatory pseudotumors exhibit iso-enhancement (Fig. 4b) and most neuroendocrine tumors exhibit hyper-enhancement (Fig. 4c) [52–55]. When Sonazoid which is the most sensitive ultrasound contrast is used for contrast-enhanced harmonic EUS, all pancreatic carcinomas possess a certain enhancement although the most are with hypo-enhancement, while benign necrotic tissues exhibit non-enhancement [54]. A recently published meta-analysis showed that when pancreatic adenocarcinomas are diagnosed on the basis of hypo-enhancement in contrast-enhanced harmonic EUS, the pooled diagnostic sensitivity and specificity are 94 and 89 %, respectively [56]. Moreover, when contrast-enhanced harmonic EUS was compared to conventional EUS, the former detected pancreatic adenocarcinomas (defined as hypo-enhanced lesions) with better sensitivity and specificity (96 and 64 %, respectively) than conventional EUS, where pancreatic adenocarcinomas were defined as hypoechoic lesions (86 and 18 %, respectively) [52]. Contrast-enhanced harmonic EUS also improves the depiction of the outline of ductal carcinomas with uncertain conventional EUS findings [52, 54, 57].
Fig. 5
Typical conventional (left) and contrast-enhanced harmonic (right) EUS images of the intraductal papillary mucinous neoplasm. Conventional EUS (left) shows a cystic lesion in the head of the pancreas. A mural nodule (arrowheads) is depicted in the lesion. Contrast-enhanced harmonic EUS (right) revealed the mural nodule has abundant vascularity (arrowheads). EUS endoscopic ultrasonography
The contrast-enhanced harmonic EUS and contrast-enhanced CT are comparable in terms of differentiating ductal carcinomas from other masses, although contrast-enhanced harmonic EUS (91 % sensitivity and 94 % specificity) is superior to contrast-enhanced CT (71 % sensitivity and 92 % specificity) for small (≤ 2 cm) carcinomas [55]. In particular, the contrast-enhanced harmonic EUS is useful for characterizing small neoplasms that contrast-enhanced CT cannot identify [55].
Contrast-Enhanced EUS for Pancreatic Cystic Tumors
Since contrast-enhanced harmonic EUS can identify vessels in the echogenic structure of cystic lesions, it discriminates mural nodules from mucous clots more sensitively than conventional EUS (Fig. 5) [58]. Mural nodules can also be further classified by contrast-enhanced EUS into four classes; low papillary, polypoid, papillary, and invasive nodules. Of these, the papillary and invasive nodules associate frequently with malignancy [58].
Fig. 6
Typical conventional (left) and contrast-enhanced harmonic (right) EUS images of the gallbladder carcinoma. Conventional EUS (left) shows a thickened wall (arrowheads) of the gallbladder. Contrast-enhanced harmonic EUS (right) reveals an enhancement in the thickened wall (arrowheads) and perfusion defects (arrows). EUS endoscopic ultrasonography
Contrast-Enhanced EUS for Tumor Staging and Lymph Node Assessment
Compared to conventional EUS, contrast-enhanced harmonic EUS improves the preoperative T-staging of pancreatobiliary tumors [59]. In particular, contrast-enhanced harmonic EUS is superior in diagnosing portal invasion by pancreatobiliary adenocarcinomas. With respect to lymph node metastases, these exhibit enhancement defects on contrast-enhanced doppler EUS [51]. When this property is used, contrast-enhanced doppler EUS distinguishes benign from malignant lymph nodes with significantly higher sensitivity (100 %) and specificity (86 %) than conventional EUS variables (88 and 77 %, respectively) [51]. The contrast-enhanced harmonic EUS is also useful for diagnosing intra-abdominal lesions of undetermined origin. When it is used, 96 % of malignant lesions exhibit heterogeneous enhancement, whereas 75 % of benign lesions exhibit homogeneous enhancement [60].
Contrast-Enhanced EUS for Gallbladder Lesions
When contrast-enhanced harmonic EUS was compared to conventional EUS in terms of the differential diagnosis of gallbladder wall thickening, the former had better diagnostic accuracy [61]. On contrast-enhanced harmonic EUS, inhomogeneous enhancement is strongly predictive of malignant gallbladder wall thickening (Fig. 6) [61]. With respect to gallbladder polyps, the presence of irregular intratumoral vessels or perfusion defects seen on the contrast-enhanced harmonic EUS are sensitive and accurate predictors of malignant gallbladder polyps [62].
Fig. 7
Typical conventional (left) and contrast-enhanced harmonic (right) EUS images of the gastrointestinal stromal tumor. Conventional EUS (left) shows a tumor (arrowheads) of 4 cm in diameter in the fourth layer of the gastric wall. Contrast-enhanced harmonic EUS (right) revealed irregular vessels (arrows) in the tumor. EUS endoscopic ultrasonography
Contrast-Enhanced EUS for Subepithelial Tumors in the Upper Gastrointestinal Tract
The contrast-enhanced harmonic EUS studies of subepithelial tumors in the upper gastrointestinal tract revealed that gastrointestinal stromal tumors (GISTs) had significantly higher echo intensity than benign tumors such as lipomas [63]. In addition, the contrast-enhanced harmonic EUS allows the vessels flowing from the periphery to the center of GISTs to be visualized (Fig. 7) [64]. By contrast, the contrast-enhanced CT cannot identify most of these vessels. All high-grade malignancy GISTs possess these contrast-enhanced harmonic EUS-depicted irregular vessels. When using higher echo intensity and detection of irregular vessels to diagnose high-grade malignancy GISTs, the contrast-enhanced harmonic EUS is more sensitive than conventional EUS findings (namely, a large size, a lobular border, and a heterogeneous structure) [64]. These results suggest that the contrast-enhanced harmonic EUS can be used to identify GISTs and estimate their malignant potential.
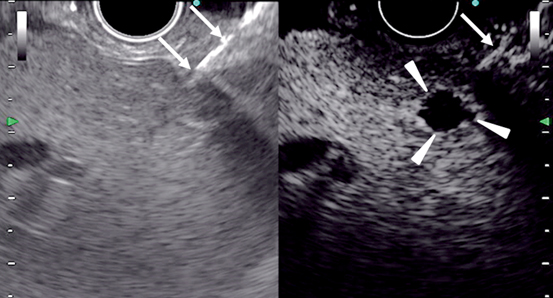
Fig. 8
Images of contrast-enhanced EUS-guided fine needle aspiration in the liver. Conventional EUS (left) cannot identify a nodule, while contrast-enhanced harmonic EUS (right) depicts a hypovascular nodule (arrowheads) in the liver. A needle (arrows) is inserted under guidance of contrast-enhanced harmonic EUS. EUS endoscopic ultrasonography
Quantitative Assessment of Parenchymal Perfusion with the Contrast-Enhanced EUS
The classification of pancreatic lesions on the basis of their enhancement patterns on the contrast-enhanced harmonic EUS is a convenient way to characterize the conventional EUS-detected lesions. However, the classification system depends on subjective assessment, which means that different readers can differ in their interpretations. This problem may be eliminated by quantitative analyses using a time-intensity curve with the contrast-enhanced harmonic EUS. Several time-intensity curve variables have been shown to be useful for the differential diagnosis of pancreatic masses. In particular, a low ratio of the uptake inside the mass to the uptake of the surrounding parenchyma [65], a low median intensity [66], a low maximum intensity [66], a long time to peak [67], a high area under the curve [67], and a high echo intensity reduction rate [68] have been found to be predictive of ductal adenocarcinomas.
Hybrid of Contrast-enhanced EUS and EUS elastography
It is unclear whether combining the contrast-enhanced EUS and EUS elastography yields a better diagnostic ability than each individual method. When Sãftoiu et al. assessed the diagnostic accuracy of the contrast-enhanced EUS and/or EUS elastography for solid masses in the pancreas, they found that the contrast-enhanced doppler EUS and EUS elastography had comparable sensitivity (91 and 85 %, respectively), but their specificities were less than 70 % [29]. By contrast, when hypo-enhancement on the contrast-enhanced doppler EUS and hard elasticity on EUS elastography were used to diagnose these masses, this combination was highly specific (95 %); thus, combining the two methods may be useful for reducing the number of false-positive cases [29]. However, Hocke et al. reported that the combination of fundamental B-mode, elastography and the contrast-enhanced doppler imaging (90 % sensitivity and 64 % specificity) did not improve on the result of the contrast-enhanced doppler EUS alone (90 % sensitivity and 92 % specificity) [26]. Further studies are needed to establish the contrast-enhanced harmonic EUS and EUS elastography criteria that can be used to diagnose pancreatic tumors.
Contrast-Enhanced EUS for EUS-FNA
The contrast-enhanced harmonic EUS can complement EUS-FNA in terms of identifying pancreatic ductal carcinomas that have false-negative EUS-FNA findings [53–55]. When pancreatic lesions with hypo-enhancement on contrast-enhanced harmonic EUS were regarded as ductal carcinomas in patients with negative EUS-FNA findings, the sensitivity of ductal carcinoma diagnosis increased from 92 % (EUS-FNA alone) to 100 % (both EUS-FNA and the contrast-enhanced harmonic EUS) [54]. Moreover, a French multicenter study showed that five false-negative EUS-FNA cases were correctly classified by the contrast-enhanced harmonic EUS [55].
Since the contrast-enhanced harmonic EUS clearly depicts subtle lesions that conventional EUS cannot identify, it can also be used to identify the target of EUS-FNA (Fig. 8) [52, 54, 57]. Moreover, it can be used to locate a specific site within a lesion that would be more suitable for EUS-FNA than other sites. Identifying and avoiding the avascular sites in a lesion may help avoid sampling necrotic areas and improve the sensitivity of pancreatic tumor diagnosis by EUS-FNA [69]. The contrast-enhanced EUS may also be helpful in terms of assessing lymph nodes that cannot be accessed by EUS-FNA, because of an intervening tumor or vessels; it can also help eliminate the time and risk associated with performing EUS-FNA at a second site [70].
Fig. 9
Procedure of EUS-guided choledochoduodenostomy. a Schematic image. b EUS image of bile duct puncture. Arrowheads: extrahepatic bile duct. Arrows: puncture needle. c Fluoroscopic image of bile duct puncture; arrow: puncture needle. d Fluoroscopic image of stent deployment; arrowheads: metal stent. e Endoscopic image of stent deployment. EUS endoscopic ultrasonography
EUS-Guided Biliary Drainage
Indication of EUS-Guided Biliary Drainage
The endoscopic biliary drainage is a common first-choice approach for obstructive jaundice. In standard endoscopic biliary drainage, a stent is inserted into the bile duct through the duodenal papilla by using a side-viewing endoscope; however, deep cannulation of the bile duct is difficult in some patients. Moreover, in some patients, the reconstruction after resection of the digestive tract or the duodenal infiltration of the tumor makes it impossible to reach the duodenal papilla. In such patients, endoscopic transpapillary treatment cannot be selected and percutaneous transhepatic biliary drainage (PTBD) and surgery had to be considered. In 2001, Giovannini et al. reported EUS-guided biliary drainage [12]. Since then, various EUS-guided biliary drainage techniques have been reported as an alternative treatment of obstructive jaundice after unsuccessful endoscopic transpapillary biliary drainage [12, 13, 71–108, 110–112].
EUS-Guided Biliary Drainage Procedures
The EUS-guided biliary drainage procedure is based on the EUS-guided pancreatic cyst drainage procedure. It consists of four steps, as follows: selection of the puncture site/route, puncture, dilation, and stenting [12, 13, 71–112]. As this procedure is performed in an organ with a specific shape, viz., the biliary tract, various puncture sites/routes and stenting methods can be used. This procedural variability is a feature of differing from EUS-guided pancreatic cyst drainage. There are two puncture routes, as follows: either from the gastric body (or small intestine after total gastrectomy with reconstruction of the digestive tract) to the intrahepatic bile duct, or from the duodenal bulb to the extrahepatic bile duct [71–112]. Another route from the duodenal bulb (or antrum) to the gallbladder may also be an option [113–121]. Stenting is classified into three methods: transmural drainage in which a stent is inserted into the site of puncture [12,13, 80, 81, 82, 90, 94, 96, 103, 104, 105, 109, 111], rendezvous drainage in which EUS-guided puncture is performed as an auxiliary procedure for transpapillary treatment [78, 88, 99, 102, 106], and antegrade stenting in which a stent is antegradely inserted/placed from the site of puncture into a stenotic site of the bile duct along a guide-wire after puncture [89, 101, 107, 110]. Because these different puncture sites/routes or stenting methods have not been systematically compared, it remains to be clarified which is the most effective method. The treatment choice depends on whether the site of biliary obstruction and papilla can be reached. For rendezvous drainage, an endoscope is needed to reach the papilla [78, 88, 99, 102, 106]. Furthermore, the EUS-guided transduodenal treatment is indicated for obstruction of the lower bile duct [81, 82, 83, 90, 94, 96, 103, 105, 109]. It is important to review which treatment method is appropriate for individual patients prior to the start of treatment and to plan a therapeutic strategy, so that a second choice can be selected in case the first-choice route of treatment or stenting method is difficult.
1.
EUS-guided choledochoduodenostomy (EUS-CDS) [12, 71–77, 81, 82, 90, 94, 96, 103, 105, 109] (Fig. 9).
The extrahepatic bile duct can be observed closely from the duodenal bulb. Usually, the middle part of the bile duct is suitable for the target. For optimal visualization, the echoendoscope should be in a long position, with tip of the echoendoscope directed toward the hepatic hilum. The puncture should be performed so that the guidewire is inserted into the proximal bile duct. Before puncturing the bile duct, intervening vessel should be avoided using Doppler mode. Under real time EUS guidance, a 19-gauge needle is inserted transduodenally into the extrahepatic bile duct. A cholangiogram is obtained to display the dilated intrahepatic and extahepatic bile ducts proximal to the obstruction, under fluoroscopy. After the cholangiogram, a guide-wire inserted into the proximal bile duct through the needle. For the dilatation of the needle tract, a tapered catheter with a thin tip is inserted into the bile duct. Biliary dilatation catheter, balloon dilator, or cautery dilator is used for subsequent dilatation of the tract. After the dilatation of the tract, a plastic stent or metal stent is deployed over the guide-wire. At the initial step during the stent deployment, the position of the stent should be observed under guidance of fluoroscopy and ultrasonography. At the second half step during the stent deployment, the deployment procedure should be performed under endoscopic guidance.
Fig. 10
Procedure of EUS-guided hepaticogastrostomy. a Schematic image, b EUS image of bile duct puncture; arrowheads: intrahepatic bile duct; arrows: puncture needle, c fluoroscopic image of cholangiogram; contrast is injected from the catheter inserted from the gastric wall into the intrahepatic bile duct, d Fluoroscopic image of stent deployment; arrowheads: metal stent. e. Endoscopic image of stent deployment.
2.
The intrahepatic bile duct can be observed closely from the lesser curvature of the stomach. The anterior lateral branch (B3) of the intrahepatic bile duct is the most suitable target of EUS-HGS. Compared with EUS-CDS, it is more difficult to identify an appropriate assess route, so that the tip of a guide-wire reach the hilar bile duct, because the intrahepatic bile duct is smaller, located at more profound place, and branching. After identification of an appropriate assess route, the intrahepatic bile duct is punctured with a 19-gauge needle, through which a cholangiogram is performed. A guide-wire is inserted toward the hilar bile duct through the needle. As performed in EUS-CDS, the needle tract is dilated. In the first report of EUS-HGS, a double pigtail stent was used for EUS-HGS. However, compared with EUS-CDS, the stent is more strongly affected by peristalsis and breathing, which may cause stent migration. Therefore, metal stent which can be anchored to the bile duct and gastric wall is recommended for the EUS-HGS. Also, the luminal side of the deployed stent should be long for prevention of post-procedural stent migration.
Fig. 11
Procedure of EUS-guided rendezvous drainage. a. Schematic image. b. Fluoroscopic image of cholangiogram. Contrast is injected from the catheter inserted from the duodenal wall into the extrahepatic bile duct. c. Fluoroscopic image of transpapillary drainage; after grasping the tip of the guide-wire in the duodenal lumen with duodenoscope; ordinary transpappilary drainage is performed. EUS endoscopic ultrasonography
3.
As the procedures previously described, a 19 gauge-needle is punctured via the duodenum or stomach. Through the needle, a guide-wire is inserted into the bile duct. The stricture and papilla should be passed by the tip of the guide-wire. The echoendoscope is exchanged to a duodenoscope, with which the guide-wire is grasped and pulled into its channel. Over the retracted guide-wire, the ordinary transpapillary drainage can be performed.
Fig. 12
Procedure of EUS-guided antegrade stenting. a Schematic image, b Fluoroscopic image of guide-wire insertion; a guide-wire is inserted from the catheter inserted from the gastric wall into the bile duct; The tip of the guide-wire passes the biliary stricture and the papilla, c fluoroscopic image of stent deployment. Arrowheads: metal stent. EUS endoscopic ultrasonography
4.
A cholagiogram is performed after the transhepatic needle puncture described previously. A guide-wire is inserted into the bile duct through the needle. As performed during EUS-guided rendezvous drainage (EUS-RV), the tip of the guide-wire is advanced to pass the stricture of the bile duct. Subsequently, the needle tract is dilated as performed in EUS-HGS. A delivery system for metal stent is inserted over the guide-wire through the needle tract, and advanced to the biliary stricture. The metal stent is deployed at the biliary stricture.
Fig. 13
Procedure of EUS-guided gallbladder drainage. a Schematic image, b fluoroscopic image of guide-wire insertion; a guide-wire is inserted from the catheter inserted from the duodenal wall into the gallbladder, c fluoroscopic image of stent deployment; arrowheads: metal stent, d endoscopic image of stent deployment. EUS endoscopic ultrasonography
5.
The gallbladder can be observed closely from the bulb of the duodenum or the antrum of the stomach. For optimal visualization, the echoendoscope should be in a long position. The gallbladder is punctured with a 19-gauge needle, and a cholecystogram is performed. After insertion of the guide-wire into the gallbladder, the guide-wire is coiled by more than two folds. As described previously, the needle tract is dilated. Over the guide-wire, a naso-bilairy tube, pigtail stent, or covered metal stent is inserted to create the amastomosis between the gallbladder and gastroduodenal lumen.
Fig. 14
Procedure of EUS-guided celiac plexus neurolysis. a EUS image of needle puncture; a needle (arrows) is inserted from the stomach to the area adjacent to the celiac artery (arrowheads), b CT image of the ethanol spread; CT depicts contrast (arrowheads) which is included in ethanol solution in front of the abdominal aorta. Arrow: celiac artery. EUS endoscopic ultrasonography, CT computed tomography
Outcomes of EUS-Guided Biliary Drainage
1.


Success rate and incidence of complications
Most studies on EUS-guided biliary drainage are retrospective. In those with more than 10 patients, the success rate and incidence of complications differ markedly—the success rates range from 67 to 100 %, while the complication incidences range from 0 to 46 % [12, 13, 71–96, 98–108]. These studies also differed in terms of the puncture sites/routes and stenting methods that were used, which may have contributed to the differences in the success rates. In a multicenter cooperative retrospective study involving 125 patients who underwent EUS-guided biliary drainage in Spain, the success rate, clinical improvement rate, and incidence of complications were 67, 63, and 23 %, respectively [97]. This success rate was markedly lower than that in another study involving a single institution. The most important factor responsible for the lack of success in this procedure was the number of endoscopists who participated in the treatment—single endoscopists had significantly lower success rates (57 %) than when two endoscopists were present (80 %), suggesting that the assistant, who helps with guide-wire insertion and dilating operations, plays an important role and that this procedure cannot be readily completed by a single endoscopist [97].
In the Spanish multicenter study described above, the success rate of EUS-CDS(86 %) was higher than those of EUS-HGS(65 %) and EUS-RV(68 %), although these differences did not achieve statistical significance [97]. In addition, the incidence of complications after EUS-CDS (15 %) was lower than that after EUS-HGS (29 %). By contrast, the large international multicenter retrpspective study in high volume centers compared intrahepatic and extrahepatic approaches in terms of success and complication rates, and concluded both approaches are comparable [112]. These two reports suggest that the number of attending endoscopists and presence of a skilled assistant affect outcomes of EUS-HGS more than those of EUS-CDS.
< div class='tao-gold-member'>
Only gold members can continue reading. Log In or Register to continue
Related posts:


Stay updated, free articles. Join our Telegram channel
Full access? Get Clinical Tree
